Atomic Force Microscopy in Cell Biology Episode 2 Part 1 ppsx
Bạn đang xem bản rút gọn của tài liệu. Xem và tải ngay bản đầy đủ của tài liệu tại đây (408.26 KB, 20 trang )
206 Braet and Wisse
A great help in interpreting results in relation to the forces used is the appli-
cation of glutaraldehyde which increases the rigidity or stiffness of cells,
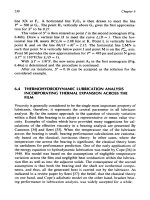
Fig. 2. Time-lapse AFM series of jasplakinolide A-induced microfilament disruption
in rat skin fibroblasts (see also ref. 7). (A) Untreated fibroblasts show a parallel fiber
orientation. Right after the acquisition of (A), 200 nM jasplakinolide A was added and
subsequently three sequential images of the same area were recorded (recording time 1
image ~ 15 min). (B) In the middle of the image the first signs of microfilament disrup-
tion could be noticed (>). (C) The cantilever is depicted instead of the cells.
Jasplakinolide A induces an accumulation of filamentous actin around the nucleus and
results in an increase of the nuclear height (from 8 to 12 µm; data not shown). In this case
the sample visualizes the cantilever (>), rather than vice versa. (D) Increasing the inte-
gral gain (see Note 16 during imaging resulted in an artifact-free image and reveal typi-
cal jasplakinolide-induced changes, that is, a loss of jasplakinolide A-sensitive fibers (>)
and nuclear swelling (*). 100 µm × 100 µm.
AFM Imaging of Living Cells 207
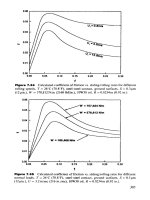
resulting in images dominated by surface details (Fig. 3D). This can be
explained by the fact that the stiffness of the cell membrane is enhanced by
fixation relative to the spring constant of the AFM-cantilever, resulting in less
deformation of the membrane around rigid submembranous structures.
Fig. 3. AFM micrographs of colon carcinoma cells (see also ref. 7). (A) Low mag-
nification showing central lying nuclei (white bumps) and clearly depicted cell bor-
ders (>), 80 µm × 80 µm. (B) Higher magnification of the cytoplasm obtained with a
loading force of 2 nN showing fine membranous detail in the form of microvilli (>).
Cell border (*), 20 µm × 20 µm. (C) Increasing the loading force with a factor 10
resulted in the disappearance of fine membranous detail and in clearly depicted cell
borders (*), 20 µm × 20 µm. (D) High-magnification AFM image after glutaraldehyde
fixation, confirming the presence of granular membranous elevations (>). Round mem-
branous indentations (→) could be visualized as well which could not be imaged in the
living state, 6.4 µm × 6.4 µm.
208 Braet and Wisse
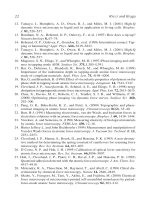
Fig. 4. AFM contact imaging of intracellular organelles in hepatic natural killer (A
and B; see also ref. 9) and endothelial cells (C and D; see also ref. 8). (A) Overview of
one cell showing the bulging nucleus (N) and surrounding cytoplasmic margins. Note
the well-attached cytoplasm (*). At the other side of the cell the scanning process appar-
ently deformed the cytoplasm, thereby showing less detail (>). This indicates that the tip
sweeps these parts of the cytoplasm along the scan direction, illustrating that these struc-
tures do not attach well to the substrate. Therefore, this part of the cell probably corre-
sponds to the pseudopodium or leading edge of the moving cell, 29 µm × 29 µm. (B)
Detailed image of a part of the well attached cytoplasm, showing clearly the grain-like
projections (>), 19.5 µm × 19.5 µm. (C) Low-magnification AFM image of living hepatic
endothelial cells showing well-spread cells and bulging nuclei (N) which are promi-
nently present. Artefactual smearing by the tip (<) is evidently present. Artifactual large
gaps (→) within the cells could be noticed and probably originates from the removal of
parts of the cytoplasm by the tip, 60 µm × 60 µm. (D) At higher magnification small
white dots (>) could be observed around the nuclei (N), illustrating the presence of intra-
cytoplasmic vacuoles (as known by correlative TEM studies), 25 µm × 25 µm.
AFM Imaging of Living Cells 209
3.5.3. Tip-Induced Smearing
In general, the lateral force can wipe away or smear out surface features,
whereas the constant force can deform soft biological samples (Fig. 4). Because
of these tip–specimen interactions, artifactual AFM images can be obtained,
that is, 1) streaks in the scan, indicating that material is being removed by the
tip (Fig. 4A and C) and 2) high corrugated regions are imaged as white bumps
(Fig. 4B and D), illustrating smearing or lateral deformation which is probably
caused by the cantilever indenting the cell surface.
Figure 4A and B are AFM images of cells moving along the substrate, show-
ing scanning-deformed membrane sheets with less detail. This indicates that
the tip sweeps these parts of the cytoplasm along the scan direction, at the
same time illustrating that these structures do not attach well to the sub-
strate. Whereas, the scanning of firmly attached protrusions reveals the
presence of submembranous granular projections underlying the cell mem-
brane. In this case, the artifactual tip-induced smearing helps to interpret
the activity of the cells, where the deformed membrane sheets probably
represent the pseudopodium or leading edge of the moving cell. In another
example, firmly attached cells show severe effects as a result of the tip–
sample interactions. In this case the tip interacts with the soft cytoplasm of
the cell, resulting in the formation of large artefactual gaps (Fig. 4C). How-
ever, the stiffer nuclear area facilitates imaging of perinuclear details, such
as storage vacuoles (Fig. 4D).
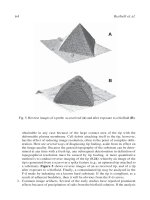
3.5.4. Cell Type Limitations
It happens that the cell type of interest bears extreme phagocytotic activities
(Fig. 5). In our studies we used liver macrophages, also called Kupffer cells
(Fig. 5A), which have a high phagocytotic capacity for latex beads (Fig. 5B)
and at the same time for the silicon nitride tip (Fig. 5C). Attempts to compose
time–lapse series of images during the process of phagocytosis partly failed.
Because the cells rounded up during phagocytosis and, as a consequence, the
higher parts of the cells were depicted as saturated images (Fig. 5B, see also
Subheading 3.5.1.). Moreover, during the first seconds of tip contact, as
observed in the inverted light microscope, it occurs that phagocytotic cells start
to react against the cantilever in an attempt to phagocytose the tip, resulting in
a image of the cantilever bottom side (Fig. 5C) or in pyramidal tip images (Fig.
5D). These pyramidal tip images are probably derived from the fine cytoplas-
mic protrusions, which have sharper contours than the AFM tip. In other words,
the fine-edged protrusions, which are trying to embrace the tip, image the tip;
rather than vice versa.
210 Braet and Wisse
Fig. 5. Set of AFM micrographs of living liver macrophages, also called Kupffer
cells (see also ref. 7 ). (A) Low magnification showing filopodial (below image) and
lamellipodial (top image) spreading 20 min after seeding of the Kupffer cells. Notice
numerous membrane projections (>), nucleus (N), 50 µm × 50 µm. (B) Living liver
macrophages after phagocytosis of latex beads of 3 µm diameter. Only beads in the
peripheral parts of the cells could be imaged (>). Most of the beads were depicted with
saturated image information (*) because the height of the cells after phagocytosis
exceeded the limits of the z piezo, 17.3 µm × 17.3 µm. (C) AFM image showing at the
end of the cantilever a Kupffer cell (<), which is trying to phagocytose the tip and as a
consequence loosing grip with the substrate, 100 µm × 100 µm. (D) In some cases
macrophages do not attach well to the substrate and probably forms structures on top
of their surface, which have sharper contours than the AFM tip. As a consequence,
these structures give rise to artefactual pyramidal tip images (>), 54 µm × 54 µm.
AFM Imaging of Living Cells 211
4. Notes
1. Collagen solution PC-3 (ICN, cat. no. 152391) can be used as an alternative for
collagen-S.
2. The pH of the medium during AFM imaging was stabilized in the physiological
range of pH 7.4 by using growth medium enriched with 25 mM HEPES. When
HEPES is used in combination with exogenous gas, it is important that the HEPES
concentration must be more than double for adequate buffering, that is, 2% CO
2
approx 10 mM HEPES vs 5% CO
2
–50 mM HEPES. Importantly, concentrations
higher than 25 mM are in general toxic for cells and HEPES should be added in
addition to, not in place of, sodium bicarbonate.
3. For very soft cells, such as living liver endothelial cells, which have an elastic
modulus of 1 kPa (13), cantilevers with the lowest force constant (i.e., 10 mN/m,
loading force 500 pN) should be used when the maximum resolution has to be
achieved. The expected theoretical resolution for a loading force of 500 pN is
300 nm, 100 nm, and 30 nm if the sample softness is 1 kPa, 10 kPa, and 100 kPa,
respectively (6). However, these low-force constant cantilevers have an arm
length of 320 µm, making optimal laser alignment difficult for some commercial
instruments and resulting in poor feedback.
4. Spontaneous adherence to and spreading on to the bottom of culture dishes is
restricted to (some) hemopoietic cells, (some) tumor cell lines, and a few other
selected cell types (fibroblasts) or cell lines. Therefore, the cells to be visualized
by AFM have to be checked whether they are anchorage-dependent (e.g., freshly
isolated rat liver endothelial cells need an addition to the substrate) vs anchorage-
independent (e.g., immortomouse liver endothelial cells can be cultured directly
on glass or plastic; ref. 8).
5. Prewarming the dishes before seeding accelerates the process of cell spreading.
6. It is advised to use well adhering and well spread cell cultures which can be
easily judged by using a routine inverted microscope. Less-adherent cells can
desorb off the substrate when they become in contact with the tip, and therefore
become impossible to image. However, crawling cells are an appealing topic for
AFM studies (9), but precautions regarding the scan rate should be taken when
studying them with the AFM (see Note 15).
7. The piezoelectric ceramics are used to generate and control scanner motion. Ide-
ally, piezoelectric ceramic distortion is linear with applied voltage (equals linear-
ized scanner). In principle, the present commercial scanners are corrected for
nonlinear behavior. However, the scanner should be checked regularly by measur-
ing a known sample. If nonlinearity occurs, the software of the scanner should be
reinstalled or display parameters should be recalculated and adapted with the aid of
a calibration sample. For more detail, all instruments contain an extended “calibra-
tion software” program in combination with a “verify calibration function.” Some-
times, nonlinearities in the piezoelectric ceramics can be discovered when an image
is zoomed. In this case, the image shifts from that which is desired.
212 Braet and Wisse
8. The main advantage of imaging in liquid is the reduction of the total force that
the tip exerts on the sample, since the large capillary force is isotropic in liquid.
Therefore, it is important that the cantilever is completely submerged in the
growth medium. For 35 Petri dishes we advise using 1.7 mL of liquid. Another
obvious advantage of liquid imaging is the reduction in vibration caused by acous-
tic waves (e.g., voices; see Note 12).
9. The combined AFM/inverted microscope is preferred when AFM imaging of liv-
ing cells is to be performed. This set-up allows movement of the sample via the
inverted microscope independently of the AFM and enables the user to easily
locate and identify the cells or areas of interest. Moreover, correlative informa-
tion is obtained and therefore improves the understanding of both microscopies,
providing a limit of confidence for AFM imaging of living cells. Finally, the use
of a video camera installed on the eyepieces of the inverted microscope in combi-
nation with a TV monitor and a (time-lapse) video recorder is advised, but is not
obligatory. Note that laser filters should be placed in the optical path to prevent
laser light accidentally entering the user’s eyes through the oculars. Moreover, to
prevent light-induced damage to the cells, a broad-spectrum green interference
filter should be placed in the light path of the microscope. This filter blocks the
light with a wavelength below 510 nm, which is extremely toxic for cells and
therefore prevents a decrease in cell viability. Because of the fact that the scan
head is positioned in the light path of the microscope, a very simple way of illu-
mination was chosen by the use of a fiber light source illuminating the close
proximity of the objective.
10. It is advised to align always first the laser beam by using a blank 35-mm Petri
dish (without cells) filled with growth medium before you start AFM imaging on
a real biological sample. By doing so, the most common pitfalls can be discov-
ered beforehand, such as false contact, thermal drift, oscillation, and vibration.
Importantly, sometimes air bubbles might become trapped between the tip and
glass sight-plate during mounting the tip on the liquid scanner. This can manifest
in the impossibility to find the reflected laser spot when the liquid has been added
in the liquid cell or the reflected laser spot can be found but appears to flicker,
resulting in a rapidly varying sum signal from the photo-diode.
11. The Petri dish holder of the microscope can fit 35-mm dishes and is connected to
the homemade XY specimen stage. The XY specimen stage and holder is made
of stainless steel and could be heated by the heating device, which is placed on
the saving of the XY specimen stage. To allow complete temperature equilibra-
tion it is advised to warm up the stage and holder one hour before imaging. By
doing so, temperature fluctuations during imaging are avoided which can cause can-
tilever drift. For the same reason, the microscope, the laser and the electronic control
units has to be switched on beforehand as well. Ideally, the whole instrument should
be placed in a constant-temperature environment to avoid drift problems.
12. Vibration is the greatest source of image noise in AFM. This can be easily deter-
mined when the instrument is in feedback, that is, the internal feedback signal
should be stable and noise-free (equals flat line). Therefore, to obtain the highest
AFM Imaging of Living Cells 213
resolution, the AFM scan head together with the inverted microscope must be
maintained in a vibration-free environment. Special vibration isolation tables are
commercially available and isolate the AFM instruments from the ground-floor
laboratory. In addition, it is advised to place the microscopic stage on a table
separate from the rest of the system. Moreover, also acoustic waves can excite
vibrations in the stage and should be minimized by using a plexiglas box around
the scan head for example. Sometimes, the mechanical components of the sample
holder and the XY specimen stage can give rise to vibrations. Therefore, attention
should be paid to make the combination of scan head and XY specimen stage as
rigid as possible to avoid mechanical vibration. Vibration can also be caused by the
sample holder. In this case, one or two drops of corn oil between the edges of the
sample and the base plate of the microscope can solve the vibration problems.
13. To assure an optimal viability of the cells, scanning of the sample should be
carried out for a maximum of 2-3 hours, after which the sample should be
replaced. At the end of the experiment, the viability should be checked routinely
with the aid of the trypan blue (see Subheading 3.4., ref. 7) and/or the propidium
iodide test (14). In our combined AFM-light microscope set-up, the overall vi-
ability usually drops with 5.8 ± 2.1% every hour. In addition, the combined AFM
/ inverted microscope allows the cell and AFM tip to be seen by the optical
microscope at all times during the scanning process (see Fig. 1 and Note 9). By
doing so, the morphology of the cells during AFM imaging can be easily judged
and tip-induced alterations such as detachment of removal of the peripheral parts
of the cytoplasm can be easily observed. These tip-induced changes are typical
morphological signs for the onset of a decreased cell viability (15).
14. The loading forces should be kept as low as possible under all imaging condi-
tions. A general idea about the force applied can be obtained by multiplying the
force conversion factor (feedback) with the set point value, for example, 0.208
nN/nA × 30 nA = 6 nN. The application of high loading forces become apparent
when an enhanced number of streaks are observed. This type of artifact is caused
by the interaction of the tip and the sample surface and may damage your prepa-
ration. Streaking can be easily diagnosed by changing the scan direction, which
should result in concomitant streaking. Streaking is more frequent when the
samples are imaged under air and dry conditions resulting from the supplemen-
tary capillary forces (16–18).
15. Optimize the scan rate during scanning to avoid smearing artefacts due to tip-
sample interaction. Sometimes it is possible to scan a sample so fast that the z
piezo cannot react quickly enough to the motion of the cantilever. Therefore,
typically the scan rate is set to two times the scan range, for example, for a scan
range of 10 µm, the scan rate would be set to 20 µm/s. For moving cells (9) or
less-adherent (19), cells the scan range should be set ideally on half of the scan
range, for example, for a scan range of 10 µm, the scan rate is 5 µm/s. In addition,
feedback parameters should be optimized as well (see Note 16).
16. It is of great importance to adjust feedback (proportional, integral, and derivate)
and scan (rate, size, set point) parameters to optimize image acquisition. The
214 Braet and Wisse
optimum settings are largely dependent on the sample properties and therefore
need to be determined experimentally. Adjusting the integral, controlling the re-
sponse of the cantilever and z piezo to the largest topographical features induces
the most noticeable improvement in image quality. Lowering this parameter too
much, results in a smear out of the sample, whereas increasing results in a optimal
image acquisition with regard to the size and shape. However, in our experience,
changing the proportional gain, which controls how the z piezo will respond to
fine structural details, did not affect the image quality. It is known that the effects
of the proportional gain are more significant for smaller scan ranges (1–2 µm).
Also the derivate gain was of secondary importance when cells wanted to be visu-
alized. Although when relatively large topographic cells wanted to be visualized
the derivate gain acts as a stabilizing parameter. Raising this parameter reduces
unwanted oscillation and allows a higher integral gain setting. The optimal value is
best determined experimentally and varies from cell to cell type and scan rate used.
17. Once in feedback, the signal should be stable and have no noise. If not, move the
tip away from the cells by increasing the set point (>60%). Alternatively, move
the tip closer the cells by decreasing the set point (<40%). Decreasing the set
point below 20% risks tip (and cell) damage.
18. Noncontact AFM takes place without physical contact between the tip and the
sample and for this reason it is the AFM mode of choice for scanning soft samples
(1–10 kPa), such as living cells. Another advantage of this imaging mode is the
reduction of the lateral forces that can push the sample around or smear out surface
features. It has to be emphasized that the mean drawback of non-contact imaging is
the increased acquisition time necessary when (fast) dynamic biological processes
are to be visualized. For living cells, the scan rate (see Note 15) and integral gain
(see Note 16) are the critical parameters for noncontact imaging (10,17).
Acknowledgments
This work was supported by the Fund for Scientific Research–Flanders,
Grant No. 1.5.411.98 and partially by the Free University of Brussels (Ignace
Vanderscheuren Price–Biomedicine 2000). F. Braet is a postdoctoral fellow of
the Fund for Scientific Research - Flanders. Our AFM work would have been
impossible without the collaboration with other departments. Special thanks to
Dr. Wouter Kalle (Waga Waga, Australia) and Prof. Dr. Manfred Radmacher
(Georg-August Universität Göttingen, Germany) for introducing us in the world
of AFM. The authors would also like to thank TopoMetrix Santa Clara, Califor-
nia (Dr. Steffan Kämmer), the Laboratory for Cytochemistry and Cytometry of
the State University of Leiden (Prof. Hans J. Tanke), and the Department of
Applied Physics of the Technical University of Twente (Prof. Bart G. de Grooth)
for their valuable collaboration, advice, and technical support.
References
1. Binnig, G., Quate, C. F., and Gerber, C. H. (1986) Atomic force microscope. Phys.
Rev. Lett. 56, 930–933.
AFM Imaging of Living Cells 215
2. Henderson, E., Haydon, P. G., and Sakaguchi, D. S. (1992) Actin filament dy-
namics in living glial cells imaged by atomic force microscopy. Science 257, 944–
1946.
3. Radmacher, M., Tillman, R. W., Fritz, M., and Gaub, H. E. (1992) From mol-
ecules to cells: imaging soft samples with the atomic force microscope. Science
257, 1900–1905.
4. Lillehei, P. T. and Bottomley, L. A. (2000) Scanning probe microscopy. Anal.
Chem. 72, 189R–196R.
5. Nagao, E. and Dvorak, J. A. (1998) An integrated approach to the study of living
cells by atomic force microscopy. J. Microsc. 191, 8–19.
6. Radmacher, M. (1997) Measuring the elastic properties of biological samples with
the AFM. IEEE. Eng. Med. Biol. Mag. 16, 47–57.
7. Braet, F., Seynaeve, C., De Zanger, R., and Wisse, E. (1998) Imaging surface and
submembranous structures with the atomic force microscope: A study on living
cancer cells, fibroblasts and macrophages. J. Microsc. 190, 328–338.
8 Braet, F., De Zanger, R., Seynaeve, C., Baekeland, M., and Wisse, E. (2001) A
comparative atomic force microscopy study on living skin fibroblasts and liver
endothelial cells. J. Electron Microsc. (Tokyo) 50, 283–290.
9. Braet, F., Vermijlen, D., Bossuyt, V., De Zanger, R., and Wisse, E. (2001) Early
detection of cytotoxic events between hepatic natural killer cells and colon carcinoma
cells as probed with the atomic force microscope. Ultramicroscopy 89, 265–273.
10. Braet, F., De Zanger, R., Kämmer, S., and Wisse, E. (1997) Noncontact versus
contact imaging: An atomic force microscopic study on hepatic endothelial cells
in vitro. Int. J. Imaging Syst. Technol. 8, 162–167.
11. Freshney, I. (1987) Measurement of cytotoxicity and viability, in Culture of animal
cells—A Manual of Basic Techniques (Freshney, I., ed.), A. Liss, New York,
pp. 245–256.
12. Braet, F., Kalle, W. H. J., De Zanger, R., de Grooth, B. G., Raap, A. K., Tanke, H.
J., et al. (1996) Comparative atomic force and scanning electron microscopy: An
investigation on fenestrated endothelial cells in vitro. J. Microsc. 181,10–17.
13. Braet, F., Rotsch, C., Wisse, E., and Radmacher, M. (1998) Comparison of fixed
and living liver endothelial cells by atomic force microscopy. Appl. Phys. A 66,
S575–S578.
14. Weyn, B., Kalle, W., Kumar-Singh, S., Van Marck, E., Tanke, H., and Jacob, W.
(1998) Atomic force microscopy: Influence of air drying and fixation on the mor-
phology and viscoelasticity of cultured cells. J. Microsc. 189, 172–180.
15. Schaus, S. S. and Henderson, E. R. (1997) Cell viability and probe-cell membrane
interactions of XR1 glial cells imaged by atomic force microscopy. Biophys. J.
73, 1205–1214.
16. Braet, F., De Zanger, R., Kalle, W. H. J., Raap, A. K., Tanke, H. J., and Wisse,
E. (1996) Comparative scanning, transmission and atomic force microscopy of
the microtubular cytoskeleton in fenestrated endothelial cells. Scan. Microsc.
10, 225–236.
17. Kalle, W. H. J., Braet, F., Raap, A. K., de Grooth, B. G., Tanke, H., and Wisse, E
(1997) Imaging of the membrane surface of sinusoidal rat liver endothelial cells
216 Braet and Wisse
by atomic force microscopy, in Cells of the Hepatic Sinusoid 6 (Wisse, E., Knook,
D. L., Balabaud, C., eds.), Kupffer Cell Foundation, Leiden, pp. 94–96.
18. Braet, F., De Zanger, R., and Wisse, E. (1997) Drying cells for SEM, AFM and
TEM by hexamethyldisilazane: A study on hepatic endothelial cells. J. Microsc.
186, 84–87.
19. Rotsch, C., Braet, F., Wisse, E., and Radmacher, M. (1997) AFM imaging and elas-
ticity measurements on living rat liver Kupffer cells. Cell Biol. Int. 21, 685–696.
AFM of Protein Complexes 217
217
16
Atomic Force Microscopy of Protein Complexes
Olga I. Kiselyova and Igor V. Yaminsky
1. Introduction
Scanning probe microscopy (SPM) is a rather new family of surface studies
methods, having broad applications to biomedical science. The main advan-
tage of SPM over conventional microscopic techniques (i.e., scanning and
transmission electron microscopy) is its ability to study living objects in their
natural environment and, therefore, the ability to observe dynamical processes
occurring to them with subnanometer resolution. Here, we will discuss one of
its family members, atomic force microscopy (AFM), which has yielded fasci-
nating results for the past decade.
AFM is a surface science technique and, thus, requires the immobilization
of the studied object on a flat rigid support (substrate). A crystalline microtip
attached to a cantilever is brought in contact with the investigated surface. The
deflection of the cantilever is roughly proportional to the force of interaction
between the tip and the surface. It can be registered by the deflection of a laser
beam directed to the reflective surface of the cantilever. The electronic system
maintains the constant force value, whereas the cantilever is scanning over
the sample. Registration of the cantilever position normal to the sample gives
the 3D surface profile. In the dynamical (or resonance) regime of registration the
cantilever oscillates near the surface and the amplitude is modulated by the
tip–sample interaction force. The surface profile roughly coincides with
the surface of equal oscillation amplitude. (For detailed description of the
AFM technique, see refs. 1 and 2). Probe microscopy technique does not nec-
essarily involve the sample–light interaction and, therefore, the λ/2 restriction
on resolution is removed.
Although AFM can attain the atomic resolution on inorganic crystals, on
biological objects it is up to date restricted to molecular one. For that reason,
From:
Methods in Molecular Biology, vol. 242: Atomic Force Microscopy: Biomedical Methods and Applications
Edited by: P. C. Braga and D. Ricci © Humana Press Inc., Totowa, NJ
218 Kiselyova and Yaminsky
the main fields of AFM morphological studies of proteins is the formation of
nucleic acid–protein and protein–protein complexes, oligomerization, and the
organization of protein molecules in biological membranes and Langmuir films
(for review, see ref. 3).
Here, for an example of AFM observation of the protein oligomerization
and complex formation, we reproduce the experiments in a system of mem-
brane proteins (cytochrome P450–cytochrome P450 NADH-reductase), which
we had previously reported (4) and give detailed explanations of the experi-
mental procedure and data interpretation.
2. Materials
1. AFM with tapping mode regime (e.g. Nanoscope, Digital Instruments).
2. Cantilevers (e.g., Nanoprobe, MicroMash).
3. Liquid cell for tapping mode.
4. Supports: highly oriented pyrolytical graphite (HOPG), mica.
5. Protein solution.
6. Tridistilled water.
7. Buffers for the protein under consideration.
8. Double-sided adhesive tape.
9. Metal discs.
10. Filter paper.
3. Methods
The cornerstone of successful imaging by AFM is a proper sample prepara-
tion, which can be considered as a sort of art. Preparation technique includes
the correct choice of the substrate for immobilization, the adjustment of speci-
men concentration and buffer ionic strength, drying conditions (if necessary).
3.1. Choosing the Substrate
The main properties a good substrate should posses is flatness (a monocrys-
tal plane would be ideal), rigidity and the studied objects’ high adhesion to it.
The choice of the substrate material is usually guided by the a priori informa-
tion about the object’s properties. Moreover, for biological research it is favor-
able to have a set of substrates with different hydrophobicity and surface charge
of different sign. Comparing the images of the same object fixed on substrates
with hydrophillic and hydrophobic surfaces one can reveal its surface proper-
ties. The strength of adhesion and the distribution on the substrate show
whether the object’s surface is polar, hydrophobic, or positively/negatively
charged. This information is of special importance in complex formation stud-
ies, indicating which parts of molecules are in contact with each other, and
which, with the solvent.
AFM of Protein Complexes 219
In biological SPM research, two substrates are the most widely used and
are the simplest to handle: HOPG and mica. These two materials do not require
any preliminary cleaning because simple cleavage (using tweezers or adhe-
sive tape) yields atomically flat crystalline planes of considerable area (tens
and hundreds of square microns) practically devoid of defects. Subsequent
cleavage of the used plate allows reusing it many times.
HOPG has hydrophobic neutral surface, composed of flat terraces separated
by steps. After anodization, the HOPG surface becomes hydrophilic and can
be used for covalent binding of proteins (Note 1; refs. 5–7).
The surface of mica is, on the contrary, polar, negatively charged, and has
high adhesion to many biological specimens. Unfortunately for microscopists,
a material with similar properties, but with positively charged surface, has not
been found yet. To recharge mica surface, a variety of procedures has been
elaborated. The simplest are based on divalent cationic treatment (8,9), others
imply more complicated lipid monolayer application (10,11), or one of the
most progressive techniques of silanization (12,13). Polypeptide coating pro-
duces rough surface and can be used for visualization of whole cells or
organelles (14,15). Description of other possible substrates, such as silicon
wafers (16), evaporated gold films (17), and Au(111) facets (18), can be found
elsewhere (Note 2).
3.2. Applying the Sample
The visualization of proteins requires special attention to be paid to the
application of material onto the substrate and to related aspects of the sample
purity and possible contamination artifacts. The two main techniques of appli-
cation of protein molecules onto the substrate are direct adsorption and
Langmuir film transformation. The latter technique, having certain advantages
for amphiphylic molecules, for example membrane proteins, is described else-
where (19,20) . Covalent binding of the proteins to previously applied lipid
films or silanized surfaces is specimen specific and requires a detailed descrip-
tion, which can be found elsewhere (21,22). Electrochemical deposition (23)
and covalent binding (5) of protein molecules onto anodized HOPG surface
are used mainly in scanning tunneling microscopy.
The direct adsorption technique implies, as can be understood from its name,
a direct application of the protein solution droplet (several microliters) onto
the prepared substrate. Then it is left to adsorb for several minutes, after which
the unbound material is rinsed by the same buffer as containing the protein.
The exact time of exposition depends on the protein concentration and the
adhesion rate and should be adjusted experimentally. Typically used protein
concentrations range between 1 µg/mL and 1 mg/mL. After adsorption the
220 Kiselyova and Yaminsky
researcher has two choices: to place the sample into the liquid cell of the
microscope, add more buffer if necessary and start in situ imaging or to dry the
sample first and image in air.
Although the second choice does not profit all the AFM potential, it is much
easier to perform, and we can recommend it to beginners or as a first step of the
experiment. Dried material better adheres to the substrate and cantilever tuning
is much easier as well. After drying of the buffer solution, all contaminants and
salts containing the drop bulk remain on the surface, sophisticating the objects’
identification. Working in liquid facilitates this problem, but on the other hand
decreases adhesion stability of the molecules on the substrate. For that reason,
before drying, the samples are rinsed with distilled water. The remaining water
can be removed by the airflow, then contaminants of the solution will also
leave the surface.
Despite all that precautions artifacts are quite often registered in AFM
images of the adsorbed proteins, obtained both in liquid and air. Typically,
these artifacts are all images of residual contaminants and have the shape of
protrusion 3–5 nm in diameter and can be easily mistaken for protein mol-
ecules themselves. It is usually the height of the artifacts (1 nm and less) that
allows one to distinguish them from the adsorbed protein molecules (Note 3).
3.3. AFM Imaging
AFM measurements start with cantilever tuning. In tapping mode lateral
tip–sample forces are minimized, which helps to avoid sweeping of the
adsorbed material by the tip during scanning. Contact mode silicon nitride can-
tilevers (Nanoprobe) with a force constant of 0.3–0.6 N/m or Ultrasharp canti-
levers of NSC17 series (MicroMash, Estonia) give reliable results for tapping
mode imaging of protein molecules in liquid. Samples dried in airflow can be
imaged with NanoSensors tapping mode etched silicon probes or cantilevers
from noncontact series produced by other manufacturers. The set of param-
eters is individual for each system. The oscillation amplitude depends on the
cantilever’s resonant properties. The amplitude of free resonant oscillations A
0
can be chosen between 10 and 50 nm. The aspect ratio of loaded vs free oscil-
lation amplitude A
S
/A
0
should be kept in the interval of 0.8–0.9 for air imaging
and 0.90–0.95 for imaging in liquid.
Scan rates in tapping mode are relatively low (1–3 Hz, depending on the
field size). For imaging individual protein molecules, it is recommended to get
several 2 × 2 µm
2
images first (to get the idea of coverage density and choose
an appropriate area) and then proceed to more detailed 0.5 × 0.5 µm
2
ones
(Note 4; ref. 24).
AFM of Protein Complexes 221
3.4. Image Interpretation
In SPM the interpretation of images is a key role task, more complicated
than obtaining the images. The registered objects are not “labeled” and it is
normally their shape and size that serves as criterion to distinguish between
them.
It is well established that apparent lateral dimensions of all AFM-imaged
objects are overestimated as a result of the influence of the geometry of the
probe tip, that has finite size, typically 5–10 nm, that is, the same order that a
protein molecule. This can be illustrated by a simple geometrical example (Fig.
1A; ref. 25).
d
= 2 r
2
+ 2Rr
Here, we roughly consider a protein molecule as a sphere with radius r and
the probe having a spherical tip with radius R. The depicted trajectory of the tip
during scanning and thus the image profile has bell-like shape. Evidently, the
apparent diameter d measured at half height does not coincide with the real
diameter of the molecule. A real cross-section profile taken from the AFM
image of a protein molecule (cytochrome P450) is shown in Fig. 1B. Simple
geometrical calculations yield the formula for this “tip-broadening” effect.
Knowing the tip radius R one can estimate the real diameter of molecule D
D
= 2r = 2 R
2
+ d
2
/4– R
In practice, the tip is not an ideal sphere of radius R, and its dimensions are
usually not known precisely and differ from tip to tip. Moreover, real mol-
ecules are not spherical and can be deformed, which makes the above-men-
tioned calculations very approximate. For this reason, single objects’ lateral
dimensions are seldom used in analytical measurements, whereas vertical di-
mensions are preferable in calculations. A more complicated model of ellipti-
cal sample is described elsewhere (26).
A successful AFM image of adsorbed globular protein molecules is a set of
dots (see Fig. 2). Assuming the protein does not oligomerize and the shape is
roughly spherical, the dots are round and of equal size. The histogram of height
distribution shows a single peak (Fig. 3A). In this article we will use the mol-
ecules height, measured on the cross-section made along the scan line (see Fig.
1B for example of cross-section). Apparent diameter measured at half height,
D, can be used for general description or rough estimation of the lateral dimen-
sions. If the molecules are spherical, the peak is very narrow, because all the
molecules are identical. If the shape is asymmetric, the peak is widened. The
222 Kiselyova and Yaminsky
molecules can adhere to the substrate with different sites, and therefore, differ-
ent parts contribute to the height measurements (see Fig. 4).
If the asymmetry is considerable, for example one deals with dimers com-
posed of two spherical globules, the histogram might show several peaks (27).
Comparing the relative heights of the peaks one can calculate the probability
of adsorption on this or that part and the free energy of binding (Note 5).
When transmembranous proteins are extracted from their native membrane
surrounding, their molecules form oligomers. The investigation of oligomer-
ization and protein complexes formation by X-ray and diffraction methods is
problematic because it requires crystallization of the sample. Meanwhile, the
Fig. 1. (A) Illustration of the tip-broadening effect resulting from the tip geometry.
R, tip radius, r, molecule radius; d, apparent molecule diameter. (B) A real cross-
section profile taken from the AFM image of a protein molecule (cytochrome P450).
Fig. 2. Molecules of Fp in monomer form adsorbed on HOPG surface (A). Image
size 0.3 × 0.3 µm
2
; (B) cross-section made along the marked line in (A).
AFM of Protein Complexes 223
223
Fig. 3. Histograms of heights distribution of adsorbed proteins. (A) Fp; (B) cytochrome P450; (C) mixture of Fp and
cytochrome P450; (D) mixture of noninteracting proteins.
224 Kiselyova and Yaminsky
crystallization of transmembrane proteins is one of the most difficult crystallo-
graphic tasks.
In this chapter we describe the results on AFM studies of oligomerization
and complex formation for the system of two membrane proteins: cytochrome
P450 2B4 (28) and NADPH–cytochrome P450 reductase (Fp) from rabbit liver
(29). These proteins are part of the microsomal monooxigenase system, play-
ing the key role in the metabolism of drugs, cancerogenes, mutagens, and
xenobiotics. Both proteins oligomerize when extracted from microsomal mem-
branes (30,31).
AFM demonstrates the efficiency of the monomerization procedure pre-
viously described (4) for these proteins. Fig. 2 depicting individual Fp mol-
ecules adsorbed on HOPG is a typical example of AFM image of adsorbed
protein in monomer form. The distribution of heights is reflected by the histo-
gram (Fig. 3A). The height of the molecules is 4–5 nm, the apparent diameter
d is 20–22 nm. The histogram consists of a single peak, which indicates that
one is dealing with one sort of particles. In order to confirm the fact that Fp is
in the monomer form, one should compare the obtained dimensions with inde-
pendent data. Despite the lack of crystallographic data, the average radius of a
protein globule r in Angströms can be roughly estimated using a simple for-
mula for spherical molecules cited by (19):
r = 0.717 M
1/3
,
where M is the protein’s molecular weight in Daltons.
For the Fp with molecular weight of 60 kDa, it yields r = 2.8 nm. Therefore,
the expectation for the average height in AFM image is 5.6 nm. The registered
value of 4.5 nm is quite close. The experimental value of height may be under-
estimated due to the deformation, caused by the tip’s pressure (32). Thus, we
can be sure that the obtained image demonstrates Fp monomers. Following
the same procedure, the AFM image of cytochrome P450 2B4 on HOPG can
be obtained (data not shown). The overall appearance of most globular pro-
teins AFM images is very similar and the measurements of heights are neces-
sary for their sizes evaluation. Height distribution histogram for cytochrome
P450 is presented in Fig. 3B (Note 6).
Fig. 4. Possible orientation of a protein molecule adsorbed on a flat substrae.
AFM of Protein Complexes 225
Complexes of cytochrome P450 2B4 and NADPH-cytochrome P450 reduc-
tase (2B4/Fp) were obtained by mixing respective solutions of monomer pro-
teins of the same molar concentrations. After the incubation, the mixture was
diluted and applied onto the substrate.
The AFM image of the mixture applied onto mica substrate is depicted in
Fig. 5. The image represents a variety of dots of different sizes, which visually
seem chaotic. Because the initial mixture contained Fp monomers and cyto-
chrome P450 monomers, the AFM image can represent those and, possibly,
the product of their interaction, that is, complexes. The identification of the
observed particles is based on the heights distribution.
The histogram of heights’ distribution consists of three peaks (Fig. 3C). The
position of the first peak (2.5–3.0 nm) coincides with that of the peak at
the histogram for cytochrome P450 2B4 (Fig. 3B), that is, it represents cytochrome
P450 2B4 monomers. The second one (the height of 4–5 nm) corresponds to
Fig. 5. Mixture of Fp and cytochrome P450 molecules in monomer form adsorbed
on mica surface. Image size 540 × 540 nm
2
. Arrows indicate: 1, cytochrome P450; 2,
cytochrome P450 NADPH-reductase (Fp); 3, complexes of cytochrome P450 2B4 with
Fp (P450/Fp).