Atomic Force Microscopy in Cell Biology Episode 2 Part 1 potx
Bạn đang xem bản rút gọn của tài liệu. Xem và tải ngay bản đầy đủ của tài liệu tại đây (679.28 KB, 20 trang )
186 Charras et al.
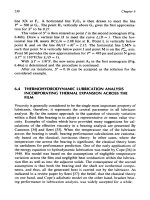
Fig. 6 Combined topography AFM imaging with confocal fluorescence microscopy using cells expressing
recombinant green fluorescent protein (GFP)-actin. (A) is a topographic AFM image of a melanoma cell
showing intracellular cytoskeletal elements (arrow), demonstrated by their height profile in contact mode
scanning under different applied forces. (B) is a fluorescence image of the same cellular region as (A) showing
the distribution of fluorescent GFP-actin (i.e., F-actin fibers) analyzed using the FITC channel of the linked
confocal microscope. A representative region rich in actin fibers is arrowed to show the coincident distribution
by both imaging techniques; actin-rich patches (“focal adhesion complexes”) are also seen and examples are
marked in both images (arrowheads). The nucleus of the cell (Nuc) is identifiable in both images. (The images
are sized at 100 ×100 μm.) Adapted from Horton et al. (2000), with permission. (See Color Plate.)
8. AFM and Cell Biology 187
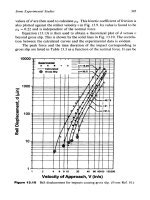
Fig. 7 (A) Osteoblasts loaded with Fluo-3 prior to indentation. The cell about to be indented is indicated
by the white arrow. (B) Osteoblasts after indentation. The indented cell (indicated by the white arrow) has
increased its intracellular calcium concentration. Time course of the calcium intensity within the indented
cell is shown graphically. TD (touch down) indicates the time when the AFM cantilever contacts the cell. FD
(force–distance) indicates the time when a force–distance curve is taken on the cell. LO (lift off) indicates the
time when the AFM cantilever is lifted from contact with the cell surface. Reprinted from Ultramicroscopy 86,
Charras, G., Lehenkari, P., and Horton, M. Atomic force microscopy can be used to mechanically stimulate
osteoblasts and evaluate cellular strain distributions. pp. 85–95. Copyright (2000), with permission from
Elsevier Science. (See Color Plate.)
188 Charras et al.
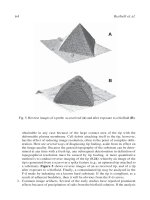
Fig. 8 Computational fluid dynamics (CFD) model of a primary osteoblast submitted to laminar flow. The
cellular profile was acquired, extracted from its substrate, digitally plated on a flat surface, and then transformed
into a mesh suitable for CFD. The flow speed and direction are represented by the red arrows for a region
around the center of the cell. (See Color Plate.)
V. Future Directions and Improvements
A. Problems To Be Solved
In summary, AFM has the potential of becoming a routine piece of equipment, rather
than an object of curiosity, in biological laboratories. However, a certain number of
problems remain to be addressed by manufacturers in order for this to happen.
1. Tips need to be designed that would be less deleterious to the cells being examined,
and enable the determination of material properties with a higher degree of precision.
2. To reliably examine biological phenomena in real time, an increased scanning speed
applying less force would be desirable. New methods to control applied force during
noncontact imaging need to be developed to improve resolution on soft materials such
as cell surfaces (see Chapter 16 in this book by Humphris and Miles).
3. The replacement of the red laser, commonly found in AFMs, by an infrared laser
would free the red channel when the AFM is coupled with a confocal microscope.
4. Tips less reflective on the underside would reduce confocal laser reflection when
combined with optical microscopy.
5. To realize the full potential of integration with the whole range of biological ex-
amination techniques, the design of the AFM needs to leave easy access to the sample.
This would enable easy simultaneous AFM and micromanipulation, microinjection or
electrophysiology.
6. For chemical force AFM, a robust, easy and reliable way of functionalizing tips
needs to be devised.
8. AFM and Cell Biology 189
B. Pharmaceutical Applications and Future Directions
Of the many applications that we have described, chemical force microscopy and
affinity mapping have the potential to be used industrially in the evaluation process
of candidate pharmaceuticals. The potency and structure–activity relationship of new
agonists/antagonists may be evaluated by measuring the binding force of compounds to
target receptors. More importantly, the specificity of the compound could be tested by
using a range of other cell types or cells in which the receptor of interest has been knocked
out or genetically modified. The antagonistic or agonistic properties of a drug may be
tested in conjunction with confocal microscopy and fluorescent dyes sensitive to proteins
known to be involved in early responses to agonist binding, such as inositol triphosphate
up-regulation in response to G-protein activation or the induction of apoptosis. Binding
map analysis is particularly useful for evaluating not only the location of receptors to
which there exist no antibodies but also the functionality of receptors present within the
cell membrane. With development, an AFM-based method could replace the standard
technique of receptor autoradiography for such studies.
Adhesion measurement of whole cells as described by Sagvolden et al. (1999) and
Thie et al. (1998) may enable the evaluation of cellular responses to new materials, for
example, in cardiovascular grafts. Indeed, one of the main problems of cardiovascular
grafts is that these need to be replaced within a few years as the cells attach to them have
a modified phenotype and form new atherosclerotic plaques or fibrotic strictures, hence
reducing their functionality. Evaluation of new orthopedic implants could also be carried
out to select those that promote adhesion of osteoblasts over other cell types to induce
osteointegration of the new material. In either case, conducting a series of adhesion
measurements on candidate graft materials would enable objective selection of the best
suited material for the specific purpose: materials that promote adhesion for orthopedic
implants and materials that do not promote adhesion for cardiovascular applications.
AFM may be of particular interest in the field of biomechanics. Indeed, cell bio-
mechanics has been hindered mainly by lack of a precise tool enabling the verification
of the hypotheses formulated. AFM may help comprehend how cells react to strain, how
they adapt to life in strained environments, or how the mechanical and the biochemical
pathways interact as has been hypothesized in several theories [for example, percolation
(Forgacs, 1995) and tensegrity (Ingber, 1997)]. Furthermore, in conjunction with finite
element modeling, AFM may help to answer some of the more intriguing questions
posed by biology. For example, how do erythrocytes manage to pass through capillaries
whose diameter is smaller than their own?
There is currently a lack of suitable methods to analyze the three-dimensional structure
of membrane glycoproteins at high resolution in their native context and configuration.
The pioneering work of M¨uller (Engel and M¨uller, 2000; M¨uller et al., 1995; M¨uller and
Engel, 1999) (see Chapter 13 in this work by M¨uller and Engel) used proteins of bacterial
purple membranes which are naturally present as tightly packed two-dimensional arrays
of high-purity crystals (such as bacteriorhodopsin and Ompf ). This makes equivalent
methods for molecules present in the membranes of eukaryotic cells particularly at-
tractive, especially if high-resolution “soft” imaging techniques can be developed. Here,
though, membrane glycoproteins are typically present at much lower densities and below
190 Charras et al.
levels that would be expected to form crystalloid features. By performing such experi-
ments on eukaryotic cells, essentially one may be able to gain a definitive insight into
the structure and function of, for example, ion channels, receptor complexes, or nuclear
pores. This would help draw out rational strategies to devise new specific drugs to one
particular part of a cell physiological mechanism.
In summary, through its capacity to quantify a number of biological phenomena in
engineering terms, AFM may bring certain fields of biology into the era of solution
engineering and exploitation of biological properties to reach a well-defined goal.
References
Arnaudies, J. M., and Fraysse, H. (1989). Equations algebriques. Equations de degre 3. In “Cours de Mathe-
matiques,” pp. 434–442. Dunod Universite, Paris, France.
Ballestrem, C., Wehrle-Haller, B., and Imhof, B. A. (1998). Actin dynamics in living mammalian cells. J. Cell
Sci. 111, 1649–1658.
Barbee, K. A., Mundel, T., Lal, R., and Davies, P. F. (1995). Subcellular distribution of shear stress
at the surface of flow-aligned and nonaligned endothelial monolayers. Am. J. Physiol. 268, H1765–
H1672.
Binnig, G., Quate, C. F., and Gerber, C. (1986). Atomic force microscope. Phys. Rev. Lett. 56, 930.
Charras, G. T., and Horton, M. A. (2002
A). Determination of cellular strains by combined atomic force
microscopy and finite element modelling. Biophys. J., in press.
Charras, G. T., and Horton, M. A. (2002
B). Single cell mechanotransduction and its modulation analyzed by
atomic force microscope indentation. Biophys. J., in press.
Charras, G., Lehenkari, P., and Horton, M. (2000). Atomic force microscopy can be used to mechanically
stimulate osteoblasts and evaluate cellular strain distributions. Ultramicroscopy 86, 85–95.
Danker, T., and Oberleithner, H. (2000). Nuclear pore function viewed with atomic force microscopy. Pfluegers
Arch. 439, 671–681.
Domke, J., Parak, W. J., George, M., Gaub, H. E., and Radmacher, M. (1999). Mapping the mechanical pulse
of single cardiomyocytes with the atomic force microscope. Eur. Biophys. J. 28, 179–186.
Donahue, H. J., McLeod, K. J., Rubin, C. T., Andersen, J., Grine, E. A., Hertzberg, E. L., and Brink, P. R.
(1995). Cell-to-cell communication in osteoblastic networks: Cell line-dependent hormonal regulation of
gap junction function. J. Bone Miner. Res. 10, 881–889.
Engel, A., and M¨uller, D. J. (2000). Observing single biomolecules at work with the atomic force microscope.
Nat. Struct. Biol. 7, 715–718.
Florin, E. L., Moy, V. T., and Gaub, H. E. (1994). Adhesion forces between individual ligand-receptor pairs.
Science 264, 415–417.
Forgacs, G. (1995). On the possible role of cytoskeletal filamentous networks in intracellular signaling: an
approach based on percolation. J. Cell Sci. 108, 2131–2143.
Grandbois, M., Dettmann, W., Benoit, M., and Gaub, H. E. (2000). Affinity imaging of red blood cells using
an atomic force microscope. J. Histochem. Cytochem. 48, 719–724.
Henderson, E., Haydon, P. G., and Sakaguchi, D. S. (1992). Actin filament dynamics in living glial cells imaged
by atomic force microscopy. Science 257, 1944–1946.
Hinterdorfer, P., Baumgartner, W., Gruber, H. J., Schilcher, K., and Schindler, H. (1996). Detection and
localization of individual antibody-antigen recognition events by atomic force microscopy. Proc. Natl.
Acad. Sci. U.S.A. 93, 3477–3481.
Horton, M. A., Charras, G., Ballestrem, C., and Lehenkari, P. (2000). Integration of atomic force and confocal
microscopy. Single Mols. 1, 135–137.
Ingber, D. E. (1997). Tensegrity: The architectural basis of cellular mechanotransduction. Annu. Rev. Physiol.
59, 575–599.
Johnson, K. L. (1985). In “Contact Mechanics.” Cambridge Univ. Press, Cambridge, UK.
8. AFM and Cell Biology 191
Kuznetsov, Y. G., Malkin, A. J., and McPherson, A. (1997). Atomic force microscopy studies of living cells:
visualization of motility, division, aggregation, transformation, and apoptosis. J. Struct. Biol. 120, 180–191.
Lehenkari, P. P., Charras, G. T., and Horton, M. A. (1999). New technologies in scanning probe microscopy for
the understanding of molecular interactions in cells. Expert Reviews in Molecular Medecine @ http://www-
ermm.cbcu.cam.ac.uk.
Lehenkari, P. P., Charras, G. T., Nyk¨anen, A., and Horton, M. A. (2000). Adapting atomic force microscopy
for cell biology. Ultramicroscopy 82, 289–295.
Lehenkari, P. P., and Horton, M. A. (1999). Single integrin molecule adhesion forces in intact cells measured
by atomic force microscopy. Biochem. Biophys. Res. Commun. 259, 645–650.
Lundberg, P., Lie, A., Bjurholm, A., Lehenkari, P., Horton, M., Lerner, U. H., and Ransjo, M. (2000). Vasoactive
intestinal peptide (VIP) regulates osteoclastic activity via specific binding sites on both osteoclasts and
osteoblasts. Bone 27, 803–810.
Merkel, R., Nassoy, P., Leung, A., Ritchie, K., and Evans, E. (1999). Energy landscapes of receptor-ligand
bonds explored with dynamic force spectroscopy. Nature 397, 50–53.
M¨uller, D. J., and Engel, A. (1999). Voltage and pH-induced channel closure of porin OmpF visualized by
atomic force microscopy. J. Mol. Biol. 285, 1347–1351.
M¨uller, D. J., Schabert, F. A., Buldt, G., and Engel, A. (1995). Imaging purple membranes in aqueous solutions
at sub-nanometer resolution by atomic force microscopy. Biophys. J. 68, 1681–1686.
Parpura, V., Doyle, R. T., Basarsky, T. A., Henderson, E., and Haydon, P. G. (1995). Dynamic imaging of
purified individual synaptic vesicles. Neuroimage 2, 3–7.
Quist, A. P., Rhee, S. K., Lin, H., and Lal, R. (2000). Physiological role of gap-junctional hemichannels.
Extracellular calcium-dependent isosmotic volume regulation. J. Cell Biol. 148, 1063–1074.
Radmacher, M. (1997). Measuring the elastic properties of biological samples with the AFM. IEEE Eng. Med.
Biol. Mag. 16, 47–57.
Radmacher, M., Fritz, M., Kacher, C. M., Cleveland, J. P., and Hansma, P. K. (1996). Measuring the viscoelastic
properties of human platelets with the atomic force microscope. Biophys. J. 70, 556–567.
Rubin, C. T., and Lanyon, L. E. (1985). Regulation of bone mass by mechanical strain magnitude. Calcif.
Tissue Int. 37, 411–417.
Sagvolden, G., Giaever, I., Pettersen, E. O., and Feder, J. (1999). Cell adhesion force microscopy. Proc. Natl.
Acad. Sci. U.S.A. 96, 471–476.
Sato, M., Nagayama, K., Kataoka, N., Sasaki, M., and Hane, K. (2000). Local mechanical properties measured
by atomic force microscopy for cultured bovine endothelial cells exposed to shear stress. J. Biomech. 33,
127–135.
Schaus, S. S., and Henderson, E. R. (1997). Cell viability and probe-cell membrane interactions of XR1 glial
cells imaged by atomic force microscopy. Biophys. J. 73, 1205–1214.
Schneider, S. W., Yano,Y., Sumpio, B. E., Jena,B. P.,Geibel, J. P., Gekle, M.,and Oberleithner,H. (1997). Rapid
aldosterone-induced cell volume increase of endothelial cells measured by the atomic force microscope.
Cell Biol. Int. 21, 759–768.
Shroff, S. G., Saner, D. R., and Lal, R. (1995). Dynamic micromechanical properties of cultured rat atrial
myocytes measured by atomic force microscopy. Am. J. Physiol. 269, C286–C292.
Thie, M., Rospel, R., Dettmann, W., Benoit, M., Ludwig, M., Gaub, H. E., and Denker, H. W. (1998). In-
teractions between trophoblast and uterine epithelium: Monitoring of adhesive forces. Hum. Reprod. 13,
3211–3219.
Weisenhorn, A. L., Khorsandi, M., Kasas, S., Gotzos, V., and Butt, H. J. (1993). Deformation and height
anomaly of soft surfaces studied with an AFM. Nanotechnology 4, 106–113.
You, H. X., Lau, J. M., Zhang, S., and Yu, L. (2000). Atomic force microscopy imaging of living cells: A
preliminary study of the disruptive effect of the cantilever tip on cell morphology. Ultramicroscopy 82,
297–305.
This Page Intentionally Left Blank
CHAPTER 9
Cellular Membranes Studied
by Photonic Force Microscopy
Arnd Pralle and Ernst-Ludwig Florin
Cell Biology and Biophysics Program
European Molecular Biology Laboratory
D-69117 Heidelberg, Germany
I. Introduction
II. Photonic Force Microscopy
A. Imaging and Characterizing the Plasma Membrane
B. Quantification of Molecular Interactions
III. Experimental Considerations
A. Design Principles
B. Details of the Position Detection
C. The Probe
D. Calibration of the Force Sensor
E. Resolution of the PFM
F. PFM Recording Modes
G. Sample Preparation
References
I. Introduction
Since the formulation of the fluid mosaic model for cellular membranes of cells by
Singer and Nicolson (1972), it has been recognized that the membranes are rather well-
structured interfaces whose structure is important for their diverse functions (reviews:
Vaz and Almeida, 1993; Jacobson et al., 1995). For a quantitative understanding and
subsequent modeling of membrane-bound processes, such as the lateral interaction of
membrane receptors, not only the lateral structure but also the interaction forces between
various membrane components and their mobility have to be known. The photonic force
microscope (PFM) reviewed here provides a novel tool to quantify those important
METHODS IN CELL BIOLOGY, VOL. 68
Copyright 2002, Elsevier Science (USA). All rights reserved.
0091-679X/02 $35.00
193
194 Pralle and Florin
parameters on the plasma membrane of intact cells at superior spatial and temporal
resolutions.
The first biophysical characterizations of intact cell membranes at the sub-light-
microscopic level were pursued using techniques such as scanning force microscopy
(SFM) and single-particle tracking (SPT). The membrane of living cells was imaged at
superior resolution by conventional force microscopy (H¨aberle et al., 1991; Grimellec
et al., 1994). The viscoelasticity, the bending modulus of the membrane ( Evans and
La Celle, 1975; Evans, 1983), and the elasticity of the membrane cytoskeleton
(Radmacher et al., 1992) were determined using related techniques. The lateral het-
erogeneity of the plasma membrane was shown by SPT studying the diffusion of in-
dividual membrane proteins (Edidin et al., 1991; Kusumi et al., 1993; Zhang et al.,
1993). However, quantitative models of membrane processes such as lateral interaction
between proteins in signal transduction require knowledge of the biophysical membrane
properties near the molecular scales. Here, the conventional SFM lacks dynamics and
sensitivity in force, while traditional SPT lacks spatial and temporal resolutions.
The recently developed PFM allows the measuring of a number of physical properties
of the plasma membrane at improved resolution. The PFM employs a laser trap as force
transducer with sensitivity in the sub-piconewton range. Various position sensors record
the force acting on the probe by measuring the three-dimensional displacement of the
probe from its resting position. Under appropriate conditions, the temporal and spatial
resolutions suffice for studying molecular diffusion and mechanics at the scale of a few
molecules. It is possible either to introduce molecular specificity to the sensor or even
to use a single molecule as a sensor itself.
The PFM has been applied to image the membrane of developing neurons (Florin
et al., 1997) and to determine the elasticity of their plasma membrane. The viscosity
of the plasma membrane and the rate of diffusion of single-membrane proteins were
determined at exceeding temporal and spatial resolutions (Pralle et al., 2000). Here,
we describe the design principles and the operation of the PFM. The various operation
modes and the data analysis are demonstrated on the bases of applications of the PFM
in cell biology.
II. Photonic Force Microscopy
A. Imaging and Characterizing the Plasma Membrane
The small forces in the PFM are well suited to image the plasma membrane of cells,
especially in regions with weak structural support by the cytoskeleton or limited adhe-
sion to the substrate, like, e.g., new branches in developing neurons. A scanning probe
image of the outer surface of such a small neurite from a cultured rat hippocampal neu-
ron is shown in Fig. 1a, and the corresponding differential interference contrast micro-
scope images (DIC) are shown in Figs. 1b and 1c. Two-dimensional images are formed
by laterally scanning a trapped latex bead across biological samples while recording
the bead’s deflection from its resting position. Under the experimental conditions, the
9. Cellular Membranes Studied by PFM 195
Fig. 1 (a) A PFM scan of a small neurite (N) branching (B) from a major neurite (M) of a growing
hippocampal neuron. (b, c) Different scale DIC overviews including the scan area. The PFM scan measures
the neurite to be 400 nm high and 300 nm wide. Adapted from (1997) J. Struc. Biol. 119, Florin et al. Photonic
force microscope based on optic tweezers and two-photon excitation for biological application, pp. 202–211,
(1997), with permission from Elsevier Science. (See Color Plate.)
maximal imaging force applied by the probe is well below 5 pN, and the lateral force
is at maximum threefold higher than the axial force. These low forces minimize me-
chanical deformations on soft biological samples. The softness of neuronal membranes
and the steep structures of these cells have limited measurements of their mechanical
properties. The image of the plasma membrane of the neurite in Fig. 1 was acquired in
a constant height mode. The constant height mode of the PFM is limited to flat surfaces
with corrugations smaller than the trapping range along the optical axis, which is about
0.5 μm. However, the PFM can be used with a feedback circuit in any conventional force
microscopy mode.
A very useful approach to study cells with their steep edges and trenches is a PFM
tapping mode functioning much like the force volume scans in SFM (Radmacher et al.,
1996). In each image point, the laser focus holding the probe particle approaches the
surface and is then retracted a fixed distance. This way, the probe can either climb up and
down steep slopes or enter deep trenches. Figures 2c and 2d show a tapping mode scan
of a branching neurite. At 1.2 μm high, the image of the structure exemplifies how this
mode extends the z range of the PFM, while the sensor still moves into the trench between
the two branches. The force can be reduced to fractions of piconewtons using the tapping
mode. In the second example of the PFM tapping mode, a line profile of a scan over the
surface of a fibroblast near its nucleus provides an example of a tilted surface imaged with
high aspect ratio (Fig. 2e). The plasma membrane of single fibroblasts cultured on cover-
slips grows almost vertically out of the surface to cover the large spherical nucleus, while
the remainder of these cells is mostly flat. The PFM can resolve these steep membrane
196 Pralle and Florin
Fig. 2 A PFM tapping mode image of another neurite of a hippocampal neuron is shown in (c) and (d).
Being up to 1200 nm high, these structures could only be resolved in the PFM tapping mode. Different scale
DIC overviews including the scan area are presented in (a) and (b). Part (e) displays a line scan taken from an
extreme example of the tapping mode in which the probe climbed down the side of a fibroblast cell near the
nucleus. (See Color Plate.)
structures because the probe is a submicrometer sphere trapped in three dimensions
without mechanical connection to the microscope actuator or sample holder (Fig. 5).
Hence, the PFM is especially well suited for biological applications, because it over-
comes the restriction to well-oriented surfaces of objects as long as they are transparent
to the wavelength of the laser. PFM scans yield topographical and elasticity information
of highly corrugated and very soft surfaces with a resolution limited by the probe size
and the thermal position fluctuations (see discussion on resolution in the following).
B. Quantification of Molecular Interactions
The observation of the motion of membrane-embedded molecules attached to beads
by videomicroscopy, known as single-particle tracking, has provided insights into the
protein diffusion in the membrane and the lateral organization of the plasma membrane
(De Brabander et al., 1991; Cherry, 1992; Kusumi et al., 1993). However, videomi-
croscopy studies are limited to two dimensions and provide normally only a low tem-
poral resolution, 25–33 fps. Using a sensitive camera with shorter integration time,
the frame rates can be increased, and Tomishige and Kusumi (1999) have achieved a
4.5-kHz bandwidth. The spatial resolution is coupled to the temporal resolution because
a membrane molecule with a typical diffusion coefficient of D = 1 × 10
−10
cm
2
/s moves
in an area of about 800 nm
2
between two subsequent video images (25 fps). The same
molecule diffuses only in an area of 0.4 nm
2
during the 20-μs interval between two PFM
9. Cellular Membranes Studied by PFM 197
Fig. 3 Three-dimensional particle tracking of a probe attached to a Thy1.1 molecule diffusing on the neurite
membrane. The position of the probe was measured every 20 μs over a period of 42 s resulting in 2.1 × 10
6
data
points. (a) Surface plot of the volume in which the molecule–bead complex is found 85% of the measurement
time. (b) DIC image of the bead (marked by the circle) on the neurite. Adapted from Pralle, A., Prummer, M.,
Florin, E L., Stelzer, E. H. K., and H¨orber, J. K. H. Three-dimensional position tracking for optical tweezers by
forward scattered light. Micro. Res. Technol. 44, 378–386, Copyright
C
(1999, John Wiley & Sons). Reprinted
by permission of Wiley-Liss, Inc., a subsidiary of John Wiley & Sons, Inc.
position measurements, which is about the area occupied by a single lipid molecule. In
addition, the PFM allows the determination of the position of the bead, hence, of the
molecular tracer in three dimensions, ensuring that the actually three-dimensional path
of diffusion on the corrugated cell surface is measured and not only a two-dimensional
projection as in video microscopy.
Figure 3 shows the result of a three-dimensional tracking experiment of a Thy1.1
molecule diffusing on a neurite membrane. For clarity, the information is presented
graphically as a surface representation of the volume in which the sphere has been
diffusing during 85% of the time. The tubular outline of the neurite is clearly visible as
empty space around which the molecule is diffusing. The diffusion coefficients can be
determined.
The local rate of diffusion obtained from the three-dimensional single molecule track-
ing in the plasma membrane allow study of the dynamics of a single-membrane molecule
at a scale not attainable previously. Using this approach, it became possible to measure the
viscous drag imposed on membrane components by the lipid bilayer directly separating
it from effects of obstacles like cytoskeleton-anchored proteins.
The viscous drag of an individual membrane protein in the plasma membrane of living
cells is measured by observing the thermal position fluctuations of an attached sphere.
The damping of the motion is dominated by the viscous drag on the membrane domain of
the protein because of the 1000-fold higher viscosity of the lipid bilayer compared to that
of the aqueous medium. For a local diffusion measurement, an antibody-coated sphere
is captured in the solution and placed onto the cell membrane, while maintaining the
interaction force between the bead and the membrane below 0.1 pN. The viscous drag on
198 Pralle and Florin
Fig. 4 (a) The experimental situation during a local membrane protein diffusion measurement is shown in
this scaled model: the sphere (r = 108 nm) is bound via an adsorbed antibody to the membrane protein, in
this case a GPI-anchored protein that is part of a raftdomain. To achieve single-molecule binding conditions,
the surface of the sphere not covered by antibodies is blocked with fish skin gelatin, and the majority of the
antibodies are blocked with soluble antigen. The darker sections in the lipid bilayer symbolize raft domains. The
extent of the thermal position fluctuations is kept well below the average distance between diffusion barriers.
(b) Summary of the result of local diffusion measurements of single proteins in the membrane of intact cells.
The proteins diffuse in intact cells not according to the size of their membrane anchor but according to the type
of membrane anchor (shaded bars): the viscous drag of the GPI-anchored proteins (PLAP and YFPGLGPI) is
larger than that of the nonraft transmembrane proteins (hTfRt and LYFPGT46). In cells in which the rafts
have been disrupted by cholesterol extraction the proteins diffuse according to the size of their membrane
anchor (crossed bars); the viscous drag of the GPI-anchored proteins is smaller than that of the transmembrane
proteins. If the rafts are left intact, the raft proteins diffuse with the raft, which leads to a higher viscous drag
than that of the transmembrane proteins in the remainder of the membrane. Reproduced from Pralle et al. The
Journal of Cell Biology, 2000, 148, 997–1007 by copyright permission of The Rockefeller University Press.
9. Cellular Membranes Studied by PFM 199
the same sphere is first recorded in the bulk solution, then near the membrane, and finally
after binding to the membrane protein. The comparison of these three measurements
allows separating the influence of the sphere diffusing unbound near the membrane from
the binding of the bead to the membrane protein. The continuous observation with high
temporal resolution resolves directly individual binding events ensuring single-molecule
measurements (Pralle et al., 2000).
A scaled scheme of a local diffusion measurement clarifies the advantages gained
by using the PFM (Fig. 4a): Confining the motion of a particle with the laser trap
to an area small compared to the spacing between immobile membrane components
minimizes the effects ofimmobile obstacles. Themeasured diffusion coefficient is mainly
determined by the interaction of the membrane region of the protein with the lipids in the
membrane. Figure 4b summarizes the results of local protein diffusion measurements
aimed at elucidating the existence and nature of lipid rafts, special lipid microdomains
rich in sphingolipids, and cholesterol. These measurements showed that the local protein
diffusion in the membrane of intact cells depends on both the membrane anchor of the
protein and the local lipid composition, in agreement with measurements on artificial
membrane systems and the theory of protein diffusion in a membrane. The measurements
showed also that proteins thought to reside in lipid rafts diffuse independently of their
type of membrane anchor slower than transmembrane proteins outside these domains
(Fig. 4b). The results provided evidence of lipid rafts in intact fibroblasts and an estimate
of their size and stability (Pralle et al., 2000).
III. Experimental Considerations
The PFM is based on a single-beam gradient laser trap (Ashkin et al., 1986, 1990)
combined with high-resolution three-dimensional position manipulators and sensors.
The laser trap offers a novel type of cantilever to build a scanning force microscope:
a sub-micrometer-sized dielectric particle held and scanned by the gradient forces of
a strongly focused laser beam. Depending on the properties of the optically trapped
particle and the readout, various scanning microscopes have been proposed: a scanning
optical near-field microscope (Malmquist and Hertz, 1992; Hertz et al., 1995), a local
pH sensor (Sasaki et al., 1996), and a simple optical force microscope (Ghishlain and
Webb, 1993). We built the first PFM with a detection scheme based on two-photon
fluorescence intensity to image soft three-dimensional biological samples (Florin et al.,
1997). Also, the PFM was modified to be the first microscope to exploit the thermal
position fluctuations of the position sensor to analyze the environment of individual
molecules (Pralle et al., 1999, 2000).
Figure 5 shows a scaled comparison of the force transducer and sensor of a conven-
tional SFM and those of the PFM. The much smaller PFM probe has an at least 100-fold
smaller hydrodynamic resistance, a smaller spring constant (10
−6
− 10
−4
N/m), a vir-
tually diminishing mass, and its motion is completely over-damped in water. These
characteristics allow faster and less disturbing measurements. The absent mechanical
connection to the outside allows imaging of deep narrow trenches and even inside of
200 Pralle and Florin
Fig. 5 A scaled comparison of the probes of a classical SFM and those of the PFM. A mechanical cantilever
(l = 200 μm) with a pyramidal tip and a 0.2-μm sphere trapped in the laser beam are displayed.
transparent three-dimensionalobjects. The accessible forces rangebetween 0.1and 20 pN
and depend not only on the laser intensity and wavelength but also on the properties of
the focus and probe particle (see following). In some experiments, the low trapping
forces can be disadvantageous as adhesive forces between the probe, and the sample
might become dominating. However, in cells, many macromolecular complexes are held
together by interaction potentials not much larger than the thermal energy, a range in
which the PFM has proven to be a powerful tool.
A. Design Principles
The basic setup of a PFM follows the principle of single-beam gradient traps, which
are mostly implemented in inverted microscopes. A guide for the design of laser traps
can be found in Mehta et al. (1998). Here, we focus on the points that are special for
the PFM, i.e., the combination of three-dimensional manipulators with high-resolution
three-dimensional particle tracking and the stability of the setup.
1. Optics of the Laser Trap
The combination of an optical trap with three-dimensional manipulation capabilities
and high-resolution position detectors requires special design principles. Figure 6 dis-
plays the optical paths in our PFM. To manipulate objects in lateral directions, we use
either a piezo-driven scanning mirror or a scanning stage. The probe is positioned along
the optical axis by the piezo-driven objective mount.
a. Fluorescence Detection
The position of the trapped particle is measured using either its emitted fluorescence
light or by the forward scattered laser light (see Section III,B). Since the fluorescently
labeled probe is essentially a point source, the emitted light can be detected with high
signal-to-noise ratio in a confocal manner. The fluorescence detection unit consists of
a pair of lenses, a pinhole, filters, and a PMT. Because we use a two-photon excitation
process, the pinhole is not really necessary. It is still used, because it efficiently rejects the
DIC illumination light allowing for simultaneous scanning and observation of the sample
by DIC microscopy. The filters are designed to reject the remaining DIC illumination
and trapping laser light.
The dichroic mirror 1 (DM1) splits the trapping laser from the fluorescent light. To
maintain flexibility, it transmits the entire visible spectrum. The second dichroic mirror
(DM2) couples the trapping laser into the optical path of the microscope. It reflects light
between 500 and 610 nm and in the near-infrared. All other wavelengths are accessible
9. Cellular Membranes Studied by PFM 201
Fig. 6 Optical paths in the PFM built around an inverted microscope with DIC equipment whose wavelength
of 700 nm is chosen to reduce photon damage. The DIC and fluorescence observation light paths are drawn
outlined while the specific PFM light paths are solid and labeled in italic. The IR laser trapping beam is
widened using a beam expander formed by two lenses. By diverting part of the beam with a polarizing beam
splitter (PBS) the laser intensity sent to the microscope can be adjusted. The beam is redirected via the
scanning mirror and scanning lens and coupled into the optical path of the microscope via dicroic mirror
DM2. An oil immersion objective lens mounted on a piezo focuses the beam. The forward-scattered laser
light is collected by the condenser lens and projected by DM4 and a lens onto the QPD for the position
detection. The TPF is uncoupled from the laser path by DM1 and detected confocally by a photomulti-
plier.
202 Pralle and Florin
to DIC microscopy. Access to longer wavelength is important for in vivo observation
of neurons, because they are known to suffer under strong illumination in the visible
spectrum (unpublished data).
b. DIC Optics
The DIC optics in the PFM differs from the commercial optics in several aspects.
The accessible wavelengths are restricted for reasons discussed earlier. The analyzer is
normally positioned between the objective and the tube lens. To increase the detection ef-
ficiency for fluorescence light, we positioned the analyzer between DM2 and the camera.
This slightly degrades the DIC quality, because of the convergent rays at that position.
The dichroic mirror DM4 separates the DIC illumination from the trapping laser and
collimates it on a QPD. This mirror causes a lateral displacement of the DIC illumina-
tion. The QPD should be positioned around the back-focal plane of the condenser lens
(Gittes and Schmidt, 1998).
c. Stability
The entire microscope and optics are mounted on a vibration-isolated table. However,
to achieve a resolution of a few angstroms requires additionally a compact design of the
components steering the trapping laser with the probe particle, holding the sample, and
detecting the relative position of sample and probe. Our design is arranged around a main
plate in which the sample holder containing an xy-piezo stage is directly integrated. The
objective lens focusing the trapping laser is mounted with a piezo drive at the bottom
of the main plate, omitting any coarse focusing. The light-collecting condenser and the
QPD with its optics are mounted on a tripod on the main plate. This design minimizes
the distances and number of movable adjustments between the trap-generating objective
lens and the position sensor while providing enough flexibility for the experiments.
The power and pointing stability of the trapping laser are extremely critical,because the
laser determines the relative sample-probe separation and simultaneously serves as a light
source for the position detection. Microradian shifts in the laser pointing translate into
nanometer movements of the laser focus in the object plane. Laser intensity fluctuations
are indistinguishable from relative z-position changes of the probe.
Laser traps used in biology, usually designed with a diode-pumped solid-state in-
frared (IR) laser, are a good compromise between availability and stability and provide
wavelengths which are very slightly absorbed by water and biomolecules but are eas-
ily detectable. Our system uses the 1064-nm line of a Nd:YVO
4
laser (T20-B10-106Q,
Spectra Physics, Germany).
d. Scan and Feedback Control and Data Recording
A personal computer is used to generate the scan pattern, to control the PFM, and
to record the data. The actual requirements for the recording depend on the type of
scan performed. In general, three channels for the position of the scanner, plus another
three for the position of the probe, and eventually the probe’s fluorescence need to be
recorded. Custom-designed amplifiers are used to optimize the amplification and offset
of all signals for the data acquisition board. The fluctuation analysis of the thermal
motion requires an acquisition rate of at least 50 kHz to provide reasonable statistics.
9. Cellular Membranes Studied by PFM 203
Ideally the data are recorded at a constant rate of several 100 kHz over the length of
an experiment, which might be several minutes. We use data acquisition boards from
National Instruments (www.ni.com) and a digital signal processor (DSP) board. The DSP
is used to create the scan pattern and to implement the tapping mode and a feedback
in constant force mode. The boards can be controlled using software packages like
LabView (National Instruments, www.ni.com), the visual programming suite (Microsoft,
www.microsoft.com), and IgorPro (Wavemetrics, www.wavemetrics.com). The three-
dimensional reconstruction of position histograms and energy landscapes are represented
with AVS (Advanced Visual Systems Inc., www.avs.com).
B. Details of the Position Detection
Because of the harmonic nature of the trapping potential for small displacements, the
force acting on the trapped bead can be deduced from the displacement of the probe
within the trap. Due to the three-dimensional trapping volume, the position of the probe
should ideally be measured in all three dimensions. The PFM contains two position
detectors: first, a device measuring the two-photon fluorescence intensity emitted by
a fluorescently labeled bead to determine the axial displacement (Florin et al., 1997);
and second, a quadrant photodiode (QPD) placed in the back-focal plane (BFP) of
the condenser measuring the interference of the laser light scattered by the probe with
unscattered light (Finer et al., 1994; Allersma et al., 1998; Pralle et al., 1999). The
position sensor based on fluorescence is predominantly sensitive along the optical axis;
however, the actual signal is a convolution of the three-dimensional displacement. The
fluorescence intensity is largely independent of any distortion by the sample or the scan.
It is therefore the preferred position signal for larger scans on cells. However, one has
to integrate over a few milliseconds to obtain reasonable photon statistics for the laser
intensities (∼100 mW in the focal plane) andbead size (r = 0.1 μm) used. Themaximum
sensitivity of the fluorescence intensity is about 15% change in fluorescence intensity
per 100 nm (Florin et al., 1997). The upper part of Fig. 7 shows the fluorescence signal
of a lateral and an axial scan through a 0.2-μm sphere. Because the minimum of the
trapping potential along the optical axis is behind the geometric focus, the two-photon
fluorescence signal can be used in most applications as an axial position sensor. The
exact location of the trapping minimum along the optical axis depends on the properties
of the laser focus and the probe.
The lower part of Fig. 7 displays the corresponding signals for the interference of
the scattered light with the unscattered laser light measured by the QPD. The detection
principle based on the interference of the light scattered at the probe with unscattered
light has been used to measure one-dimensional lateral displacements and forces in
single-molecule experiments (Finer et al., 1994; Svoboda and Block, 1994). Gittes and
Schmidt (1998) presented a first explanation for the one-dimensional position detection.
We have shown that a QPD placed in the BFP indeed yields information about the
displacement of the probe in all three dimensions (Pralle et al., 1999). Because the
QPD diode detects the light of the trapping laser, this position sensor is not limited by
the light intensity and can be very fast (up to 1 MHz, only limited by the capacity of
the QPD, the amplifier, and the recording device). However, any scattering caused by
204 Pralle and Florin
Fig. 7 Upper half: Line profiles of the TPF intensities measured when moving the focus across a 0.6-μm-
diameter bead immobilized on a coverslip perpendicular to (a) and along (b) the optical axis. Lower half:
Corresponding signal form the QPD measured along the x axis (a) and along the optical axis (b). The fits are
taken from the theoretical two-dimensional description for the QPD detection for a focus with a beam-waist
radius of w
0
= 0.33 μm and a Rayleigh length of z
0
= 0.76 μm.
inhomogeneities in the sample may distort the signal. This detection method is best suited
for small scans, and is ideal for the detection of the Brownian motion of the probe without
moving the laser relative to the sample (see scan modes in the following). The measured
intensity changes are described as interference of the light scattered on the sphere with
the noninteracting transmitted light. The lateral position of the sphere with respect to
the optical axis is measured as the difference between the left and the right halves of the
QPD and the difference between the upper and the lower halves. Displacements along
the z axis will instead affect the total light intensity detected by the QPD. The detector
response is modeled as interference of the scattered light from the trapped particle,
described as Rayleigh scatterer, and unscattered laser light. Figures 7a and 7b display
one-dimensional profiles taken perpendicular to (a), and along (b) the optical axis with
the theoretical description is overlaid. The lateral sensitivity of the interference signal is
about threefold higher than the axial sensitivity because the focal volume is elongated
along the optical axis. The signals are linear for small displacements. However, all three
signals are coupled for larger displacements, and it is advisable to record the three-
dimensional position response on a known object to calculate a correction matrix that
compensates the coupling between the signals.
C. The Probe
1. Probe Material and Size
Polystyrene or silica spheres, colloid gold particles, or elongated glass particles can
be used for PFM experiments. More sophisticated probes may be available in the near
future. Probe material, size, and shape selection must be optimized for each type of
experiment. Maximizing trapping force and detection contrast needs to be combined
9. Cellular Membranes Studied by PFM 205
with best lateral resolution, with minimizing the surface interactions, or with specific
surface modifications.
The factors influencing the trapping force and the surface modifications necessary for
specific targeting of the probe limit the choice of probe materials to mostly polymer,
silica, and gold particles. The trapping forces depend mainly on the probe size, the ratio
of the probe’s index of refraction n to that of the suspending medium, and on the focal
dimensions. For particles which are small compared to the wavelength of the trapping
light, the gradient force is proportional to the particle radius r and the polarizability α
(Visscher and Brakenhoff, 1992). Hence, polystyrene (latex) spheres (n = 1.57) are more
strongly trapped than silica spheres (n = 1.45). In diffraction-limited laser traps the focal
dimensions are on the order of the wavelength.
The two-photon fluorescence detection provides the best signal-to-noise ratio for
spheres with diameters comparable to the focus, as larger spheres average the intensity
profile of the laser beam and smaller ones contain fewer fluorophores. The same is true
for the detection relying on the interference of the scattered light as spheres just smaller
than the focal volume scatter the most amount of light, optimizing the interference signal
detected by the quadrant photo-diode.
A sphere as sensor provides the advantage of isotropic resolution independent of
the orientation of the sensor to the surface in space. An asymmetrical probe with a
pointed end orientated along the optical axis provides increased lateral resolution on flat
surfaces (Stout and Webb, 1998). The contact area of the probe and the sample deter-
mine the lateral resolution achievable in imaging. Hence, in the case of spherical probes,
the one with the smallest diameter providing still reasonable signal-to-noise ratio and
the desired trapping strength should be chosen for a particular PFM experiment. We
use mostly 0.2-μm polystyrene spheres (average measured radius: 108 nm ± 3.8 nm).
Polystyrene spheres are produced by several manufactures in a broad range of diame-
ters from 20 nm to several micrometers: molecular probes (www.probes.com), Bangs
(www.bangslabs.com), Seradyn (www.seradyn.com), and others. Spheres with various
surface functional groups to bind proteins covalently and a selection of fluorophore or
dye labels are available. The spheres used in the examples shown here were orange-
fluorescent (530 nm ex./560 nm em.) carboxyl-modified latex (CML) from molecular
probes. These are the preferred probe particles in our group because their fluorophores
are excitable by a two-photon process by the IR-trapping laser, and a wide range of sizes
with the same surface functional group is available. Polystyrene spheres tend to exhibit
stronger nonspecific interactions with surfaces and often have tendrils of polymer hang-
ing off the surface, which can tether them to a substrate (Dabros et al., 1994; Zocchi,
1996). Also, for some molecules, like the molecular motors, kinesin and myosin, silica
spheres seem to provide a favorable surface for adsorption (Svoboda and Block, 1994).
Plain silica spheres can be obtained from Bangs (www.bangslabs.com) and others.
2. Probe Surface Modifications
To probe the properties or the environment of a specific protein, that protein needs
to be attached to the sphere acting as sensor. The protein, the antibody, and the ligand