Automated Continuous Process Control Part 5 pps
Bạn đang xem bản rút gọn của tài liệu. Xem và tải ngay bản đầy đủ của tài liệu tại đây (146.65 KB, 20 trang )
70 CASCADE CONTROL
Steam
Process
SP
Fluid
T
TT
22
TC
22
T(t)
Condensate
return
Ti(t)
T
Figure 4-3.1 Temperature control.
Steam
Process
SP
Fluid
T
TT
22
TC
22
T(t)
Condensate
return
Ti(t)
FT
21
FC
21
T
F
F
set
vp
(a)
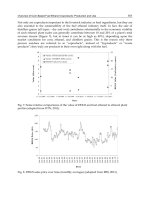
Figure 4-3.2 Cascade control schemes in heat exchanger temperature control.
c04.qxd 7/3/2003 8:22 PM Page 70
resets the flow controller set point. Any flow changes are now compensated by the
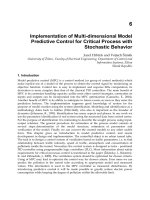
flow loop. The cascade scheme shown in Fig. 4-3.2b accomplishes the same control,
but now the secondary variable is the steam pressure in the exchanger shell side.
Any change in steam flow quite rapidly affects the shell-side pressure. Any pressure
change is then compensated by the pressure loop. This pressure loop also compen-
sates for disturbances in the heat content (superheat and latent heat) of the steam,
since the pressure in the shell side is related to the condensing temperature and thus
to the heat transfer rate in the exchanger. This last scheme is usually less expensive
in implementation since it does not require an orifice with its associated flanges,
which can be expensive. Both cascade schemes are common in the process indus-
tries. Can the reader say which of the two schemes gives a better initial response to
disturbances in inlet process temperature T
i
(t)?
The cascade control systems shown in Fig. 4-3.2a and b are very common in indus-
trial practice. A typical application is in distillation columns where temperature is
controlled to maintain the desired split. The temperature controller is often cas-
caded to the steam flow to the reboiler or the coolant flow to the condenser.
Finally, another very simple example of a cascade control system is that of a posi-
tioner on a control valve. The positioner acts as the inner controller of the cascade
scheme.
OTHER PROCESS EXAMPLES 71
Steam
Process
SP
Fluid
T
TT
22
TC
22
T(t)
Condensate
return
Ti(t)
PC
21
T
P
P
set
PT
21
(b)
Figure 4-3.2 Continued.
c04.qxd 7/3/2003 8:22 PM Page 71
4-4 CLOSING COMMENTS
So far, no comments have been made regarding the action of the controllers in a
cascade strategy. This is important because, as learned in Chapter 3, if the actions
are not chosen correctly, the controllers will not control. The procedure to choose
the action is the same as explained in Chapter 3. That is, the action is decided by
process requirements and the fail-safe action of the final control element. As noted
previously, for some of the controllers in the cascade strategy, the final control
element is the set point of another controller.
Consider the three-level cascade strategy shown in Fig. 4-3.1. The action of FC103
is reverse (Inc/Dec), because if the flow measurement increases above the set point,
indicating that more flow than required is being delivered by the valve, the valve
opening must be reduced, and for a fail-closed valve this is accomplished by reduc-
ing the signal to it. The action of TC102 is also reversed because if its measurement
increases above the set point, indicating a higher outlet preheater temperature than
required, the fuel flow must be reduced, and this is accomplished by reducing the
set point to FC102. Finally, the action of TC101 is also reversed because if its mea-
surement increases above the set point, indicating a higher reactor temperature than
required, the way to reduce it is by lowering the inlet reactant’s temperature, which
is accomplished by reducing the set point to TC102. The decision regarding the con-
troller action is simple and easy as long as we understand the significance of what
each controller is doing.
Considering Fig. 4-2.1, the output from TC101 is a signal, meaning 4 to 20mA or
3 to 15 psig or, in general, 0 to 100%. Then for a given output signal from TC101,
say 40%, what is the temperature, in degrees, required from TC102? This question
is easy to answer by remembering that the job of the controller is to make its mea-
surement equal to the set point. Therefore, TC102 will be satisfied when the signal
from TT102 is 40%. Thus the required temperature is 40% of the range of TT102.
Considering Fig. 4-2.1 again, it is important to realize what would happen if
TC102 were taken off remote set-point operation while leaving TC101 in automatic.
If this is done, and if TC101 senses an error, it would send a new signal (set point)
to TC102. However, TC102 would be unable to respond to requests from TC101. If
TC101 has reset action, it would wind up, since its output would have no effect in
its input. That is, the effect of taking the secondary controller off remote set point
is to “open” the feedback loop of the primary controller.
With their inherit flexibility, computers offer the necessary capabilities to avoid
this windup possibility and thus provide for a safer cascade strategy. The computer
can be programmed, or configured, so that at any time the secondary controller is
taken off remote set-point operation, the primary controller “automatically” goes
into manual mode if it is in automatic. The primary controller remains in manual as
long as the secondary controller remains off remote set point. When the secondary
controller is returned to remote set point, the primary controller could then return
“automatically” to the automatic mode if the designer desires it. However, if while
the secondary controller is off remote set point, its set point changes, then at the
moment it is returned to remote set point mode, its present set point may not be
equal to the output of the primary controller. If this occurs, the set point of the sec-
ondary controller will immediately jump to equal the output of the primary con-
troller, thus generating a “bump” in the process operation. If a bumpless transfer is
72 CASCADE CONTROL
c04.qxd 7/3/2003 8:22 PM Page 72
desired, most computer-based controllers can also be programmed so that while the
secondary controller is off remote set point, the output from the primary controller
is forced to equal either the process variable or the set point of the secondary con-
troller. That is, the output from the primary controller “tracks” either variable of
the secondary controller. Thus, when the secondary controller is returned to remote
set point operation, a smooth transfer is obtained.
The tracking option just explained, often referred as output tracking, reset feed-
back (RFB), or external reset feedback, is very important for the smooth and safe
operation of cascade control systems. We represent this option by the dashed lines
in Fig. 4-2.1.
4-5 SUMMARY
In this chapter we have presented in detail the fundamentals and benefits of cascade
control, which is a simple strategy, in concept and implementation, that provides
improved control performance. The reader must remember that the secondary vari-
able must respond faster to changes in the manipulated variable than the primary
variable. Typical two-level cascaded loops are temperature to flow, concentration to
flow, pressure to flow, level to flow, and temperature to pressure.
REFERENCES
1. G. Pressler, Regelungs-Technik, Hochschultashenbucher, Band 63, Bibliographischer
Institut, Mannheim, Germany.
2. V. D. Austin, Development of tuning relations for cascade control systems, Ph.D. disser-
tation, Department of Chemical Engineering, University of South Florida, Tampa, FL,
1986.
3. A. B. Corripio, Tuning of Industrial Control Systems, Instrument Society of America,
Research Triangle Park, NC, 1990.
REFERENCES 73
c04.qxd 7/3/2003 8:22 PM Page 73
CHAPTER 5
RATIO, OVERRIDE, AND
SELECTIVE CONTROL
In Chapter 4 we began the presentation of control techniques that aid simple feed-
back to provide improved control performance. Specifically, in Chapter 4 we pre-
sented cascade control. In the present chapter we continue this presentation with
three other techniques: ratio, override, and selective control; override control is also
sometimes referred to as constraint control. Ratio control is commonly used to
maintain two or more streams in a prescribed ratio. Override and selective control
are usually implemented for safety and optimization considerations. These two tech-
niques often deal with multiple control objectives (controlled variables) and a single
manipulated variable; up to now we have dealt only with processes with one control
objective. The chapter begins with a presentation of distributed control systems
(DCSs), how they handle signals, and some computing algorithms and programming
needed for implementing control techniques.
5-1 SIGNALS AND COMPUTING ALGORITHMS
Many of the control techniques presented in this and subsequent chapters require
some amount of computing power. That is, many of these techniques require the
multiplication, division, addition, subtraction, and so on, of different signals. Several
years ago all of these calculations were implemented with analog instrumentation.
Computers allow for a simpler, more flexible, more accurate, more reliable, and less
expensive implementation of these functions.
5-1.1 Signals
There are two different ways that field signals are handled once they enter the DCS.
The first way is to convert the signal received by the computer into a number with
engineering units. For example, if a signal is read from a temperature transmitter,
74
c05.qxd 7/3/2003 8:28 PM Page 74
Automated Continuous Process Control. Carlos A. Smith
Copyright
¶ 2002 John Wiley & Sons, Inc. ISBN: 0-471-21578-3
the number kept in memory by the computer is the temperature in degrees. The
computer is given the low value of the range and the span of the transmitter, and
with this information it converts the raw signal from the field into a number in engi-
neering units. A possible command in the DCS to read a certain input is
or
This command instructs the DCS to read an analog input signal (AIN) in channel
3, it tells the DCS that the signal comes from a transmitter with a low value of 50
and a span of 100, and it instructs the DCS to assign the name T to the variable read
(possibly a temperature from a transmitter with a range of 50 to 150°C). If the signal
read had been 60%, 13.6 mA, then T = 110°C.
The second way of handling signals, and fortunately the least common, is not by
converting them to engineering units but by keeping them as a percentage, or frac-
tion, of the span. In this case the input command is something like
or
and the result, for the same example, is T = 60% (or 0.6).
In DCSs that work in engineering units, the range of the transmitter providing
the controlled variable must be supplied to the PID controller (there are different
ways to do so). With this information, the controller converts both the variable and
the set point to percent values before applying the PID algorithm. This is done
because the error is calculated in %TO. Remember, the K
C
units are %CO/%TO.
Thus the controller output is then %CO. A possible way to “call” a PID controller
could be
or
This command instructs the DCS to control a variable T at 75 (degrees) that is sup-
plied by a transmitter with a range from 50 to 150 (degrees). The controller output
(OUT) is in percent (%CO).
5-1.2 Programming
There are two ways to program the mathematical manipulations in DCSs: block-
oriented programming and software-oriented programming.
OUT = PID T, 75, 50,100
()
OUT = PID controlled variable, set point, low value of range, span of transmitter
()
T = AIN 3
()
variable = AIN input channel
()
T =
()
AIN 3 50 100,,
variable AIN input channel #, low value of range, span of stransmitter=
()
SIGNALS AND COMPUTING ALGORITHMS 75
c05.qxd 7/3/2003 8:28 PM Page 75
Block-Oriented Programming. Block-oriented programming is software in a
subroutine-type form, referred to as computing algorithms or computing blocks.
Each block performs a specified mathematical manipulation. Thus, to develop a
control strategy, the computing blocks are linked together, the output of one block
being the input to another block. This linking procedure is often referred to as con-
figuring the control system.
Some typical calculations (there are many others) performed by computing
blocks are:
1. Addition/subtraction. The output signal is obtained by adding and/or sub-
tracting the input signals.
2. Multiplication/division. The output signal is obtained by multiplying and/or
dividing the input signals.
3. Square root. The output signal is obtained by extracting the square root of the
input signal.
4. High/low selector. The output signal is the highest/lowest of two or more input
signals.
5. High/low limiter. The output signal is the input signal limited to a preset
high/low limit value.
6. Function generator, or signal characterization. The output signal is a function
of the input signal. The function is defined by configuring the x, y coordinates.
7. Integrator. The output signal is the time integral of the input signal. The indus-
trial term for integrator is totalizer.
8. Lead/lag. The output signal is the response of the transfer function given
below. This calculation is often used in control schemes, such as feedforward,
where dynamic compensation is required.
9. Dead time. The output signal is equal to a delayed input signal. This calcula-
tion is very easily done with computers but is extremely difficult to do with
analog instrumentation.
Table 5-1.1 shows the notation and algorithms we use in this book for mathe-
matical calculations. Often, these blocks are linked together graphically using stan-
dard “drag-and-drop” technology.
Software-Oriented Programming. Manufacturers have developed their own pro-
gramming languages, but they are all similar and resemble Fortran, Basic, or C. Table
5-1.2 presents the programming language we use in this book; this language is similar
to those used by different manufacturers.
5-1.3 Scaling Computing Algorithms
When signals are handled as a percent, or fraction, of span, additional calcula-
tions must be performed before the required mathematical manipulations can be
Output input
ld
=
+
+
◊
t
t
s
s
1
1
lg
76 RATIO, OVERRIDE, AND SELECTIVE CONTROL
c05.qxd 7/3/2003 8:28 PM Page 76
SIGNALS AND COMPUTING ALGORITHMS 77
TABLE 5-1.1 Computing Blocks
OUT = output from block
I
1
, I
2
, I
3
= input to blocks
K
0
, K
1
, K
2
, K
3
= constants that are used to multiply each input
B
0
, B
1
, B
2
, B
3
= constants
Summer:
OUT =+++KI KI KI B
11 22 33 0
S
I
1
I
2
I
3
OUT
SUM
I
1
I
2
I
3
OUT
Multiplier/divider:
OUT =
+
()
+
()
+
+
KKI B KI B
KI B
B
011 1 22 2
33 3
0
¥
I
1
I
2
OUT
MUL
I
1
I
2
OUT
∏
I
1
I
3
OUT
DIV
I
1
I
3
OUT
Square root:
OUT = KI
11
÷
—
I
1
OUT
Lead/lag:
OUT
ld
=
+
()
+
Ks
s
I
0
1
1
1
1
t
t
lg
L/L
I
1
OUT
(Continued)
c05.qxd 7/3/2003 8:28 PM Page 77
78 RATIO, OVERRIDE, AND SELECTIVE CONTROL
TABLE 5-1.1 Continued
Selector: OUT = maximum of inputs I
1
, I
2
, I
3
OUT = minimum of inputs I
1
, I
2
, I
3
Dead time: OUT = input delayed by t
0
HS
I
1
I
2
I
3
OUT
LS
I
1
I
2
I
3
OUT
DT
I
1
OUT
TABLE 5-1.2 Programming Language
Input/output: AIN = analog in; AOUT = analog out
Format:
In variable = AIN (input channel #, low value of range, span of transmitter)
“In variable” will be returned in engineering units.
Out variable = AOUT (output channel #, out variable)
“Out variable” will be returned in percent.
Mathematical symbols: +, -,*,^,/,<, >, =
Statements: GOTO; IF/THEN/ELSE
Controller:
Output = PID (variable, set point, low value of range of variable, span of variable)
“Output” will be returned in percent.
Every term in the PID argument must be in engineering units.
Comments: To insert a comment in any line, use a semicolon followed by the comment.
implemented. The necessity and meaning of the additional calculations are
explained by the following. Consider a tank, shown in Fig. 5-1.1, where temperature
transmitters with different ranges measure temperatures at three different locations
in the tank. The figure shows the transmitter ranges and the steady-state values of
each temperature, which are at midvalue of each range. It is desired to compute the
average temperature in the tank. This computation is straightforward for the control
system that reads each signal and converts it to engineering units. The three values
are added together and divided by 3; the program in Fig. 5-1.2 does just that. The
first three lines, T101, T102, and T103, read in the temperature, and the fourth state-
ment calculates the average temperature, TAVG.
For control systems that treat each signal as a percent of span, this simple com-
c05.qxd 7/3/2003 8:28 PM Page 78
putation would result in an answer without much significance; Fig. 5-1.3 shows this
program. That is, because each signal is 50% of its range, the computation result
would also be 50%. However, 50% of what range? How do we translate this answer
into a temperature? Furthermore, notice that even though every input signal is 50%,
their measured temperatures are different because the ranges are different. Thus,
for the computation to “make sense,” the range of each input signal, and a chosen
range for the output variable, must be considered. The consideration of each range
will ensure compatibility between input and output signals, and it is called scaling.
Reference 1 presents the method to scale the computations.
5-1.4 Significance of Signals
During the presentation of the types of field signals in Chapters 1 and 4, and in the
discussion earlier in this section, it was mentioned that signals are used by the instru-
ments to convey information and that, therefore, every signal has physical signifi-
cance; that is, every signal used in the control scheme has some meaning. Signals are
in percent, but percent of what (pressure, temperature, flow, etc.)? The what is the
SIGNALS AND COMPUTING ALGORITHMS 79
TT
101
TT
102
TT
103
50–150 C
25–75 C
0–50 C
100 C
50 C
25 C
DCS
Figure 5-1.1 Tank with three temperature transmitters.
1 T101=AIN(1,50,100) ; reads in T101
2 T102=AIN(2,25,50) ; reads in T102
3 T103=AIN(3,0,50) ; reads in T103
4 TAVG=(T101+T102+T103)/3 ; calculates avera
g
e
Figure 5-1.2 Program to read in temperatures, in engineering units, and calculate average
temperature.
1 T101=AIN(1) ; reads in T101
2 T102=AIN(2) ; reads in T102
3 T103=AIN(3) ; reads in T103
4 TAVG=(T101+T102+T103)/3 ; calculates avera
g
e
Figure 5-1.3 Program to read in temperatures, in percent of span, and calculate average
temperature.
c05.qxd 7/3/2003 8:28 PM Page 79
meaning of the signal. It is now important to stress this fact again as we embark on
the design of complex strategies to improve control performance.
As mentioned earlier in this chapter, the new strategies frequently require the
manipulation of signals in order to calculate controlled variables, set points, or
decide on control actions. To perform these calculations correctly, it is most impor-
tant to understand the significance of the signals.
Very often, the first step in the design of a control strategy is to give a signal,
sometimes referred to as the master signal, a physical significance. Then, based on
the given significance, the strategy is designed. Currently, this presentation may
seem somewhat abstract; however, as we continue with the study of different control
strategies, the presentation will become clear and realistic.
To help keep all the information in order and to understand the calculations, we
indicate next to each signal its significance and direction of information flow. This
practice is not common in industry, but it helps in learning and understanding the
subject.
5-2 RATIO CONTROL
A commonly used process control technique is ratio control, which is the term used
to describe the strategy where one variable is manipulated to keep it as a ratio or
proportion of another. In this section we present two industrial examples to show
its meaning and implementation. The first example is a simple and common one and
explains clearly the need for ratio control.
Example 5-2.1. Assume that it is required to blend two liquid streams, A and B, in
some proportion, or ratio, R; the process is shown in Fig. 5-2.1. The ratio is R = F
B
/F
A
,
where F
A
and F
B
are the flow rates of streams A and B, respectively.
An easy way of accomplishing this task is shown in the figure. Each stream is
controlled by a flow loop in which the set points to the controllers are set such that
80 RATIO, OVERRIDE, AND SELECTIVE CONTROL
FC
16
FT
16
FT
17
FC
17
Stream A
Stream B
F
A
F
B
SP
SP
Figure 5-2.1 Control of blending of two liquid streams.
c05.qxd 7/3/2003 8:28 PM Page 80
the liquids are blended in the correct ratio. However, suppose now that one of the
streams, stream A for example, cannot be controlled, just measured. The flow rate
of this stream, often referred to as wild flow, is usually manipulated to control some-
thing else, such as level or temperature, upstream. The controlling task is now more
difficult. Somehow the flow rate of stream B must vary, as the flow rate of stream
A varies, to maintain the blend in the correct ratio. Two possible ratio control
schemes are shown in Fig. 5-2.2.
The scheme shown in Fig. 5-2.2a consists of measuring the wild flow and multi-
plying it by the desired ratio, in FY16, to obtain the required flow rate of stream B;
that is, F
B
set
= RF
A
. The output of FY16 is the required flow rate of stream B, and it
is used as the set point to the flow controller of stream B, FC17. So as the flow rate
of stream A varies, the set point to the flow controller of stream B will vary accord-
ingly to maintain both streams at the ratio required. If a new ratio between the two
streams is required, the new ratio is set in the multiplier. The set point to the flow
controller of stream B is set from a computation, not locally. Figure 5-2.3a shows
the software equivalent to Fig. 5-2.2a and assumes that the control system works in
engineering units. FT16LO, FT16SPAN, FT17LO, and FT17SPAN are the low value
and span of FT16 and FT17.
The ratio control scheme shown in Fig. 5-2.2b consists of measuring both streams
and dividing them, in FY16, to obtain the actual ratio flowing through the system.
The calculated ratio is then sent to a controller, RC17, which manipulates the flow
of stream B to maintain the set point. The set point to this controller is the required
ratio and it is set locally. Figure 5-2.3b shows the equivalent scheme using software.
Note that in the controller it is necessary to specify RLO and RSPAN, which are
the low value and span you expect the ratio to change. This is the same as selecting
a ratio transmitter range.
RATIO CONTROL 81
F
A
F
B
FC
17
FT
17
FT
16
X
Stream B
Stream A
F
B
set
FY
16
R
Stream A
FT
17
FT
16
RC
17
F
B
F
A
R
R
set
FY
16
Stream B
.
.
(a) (b)
Figure 5-2.2 Ratio control of blending system.
c05.qxd 7/3/2003 8:28 PM Page 81
Both control schemes shown in Fig. 5-2.2 are used, but the scheme shown in Fig.
5-2.2a is preferred because it results in a more linear system than the one shown in
Fig. 5-2.2b. This is demonstrated by analyzing the mathematical manipulations in
both schemes. In the first scheme FY16 solves the equation F
B
set
= RF
A
. The gain of
this device, that is, how much its output changes per change in flow rate of stream
A, is given by
which is a constant value. In the second scheme, FY16 solves the equation
Its gain is given by
so as the flow rate of stream A changes, this gain also changes, yielding a
nonlinearity.
From a practical point of view, even if both streams can be controlled, the imple-
mentation of ratio control may still be more convenient than the control system
shown in Fig. 5-2.1. Figure 5-2.4 shows a ratio control scheme for this case. If the
total flow must be changed, the operator needs to change only one flow, the set point
∂
∂
R
F
F
F
R
F
A
B
A
A
==
2
R
F
F
=
B
A
∂
∂
F
F
R
B
set
A
=
82 RATIO, OVERRIDE, AND SELECTIVE CONTROL
1 FA=AIN(1, FT16LO, FT16SPAN) ; reads in flow of stream A
2 FB=AIN(2, FT17LO, FT17SPAN) ; reads in flow of stream B
3 FBSET=R*FA ; FY16
4 CO17=PID(FB, FBSET, FT17LO, FT17SPAN) ; FC17
5 AOUT(1, CO17) ; outputs signal to valve
(a)
1 FA=AIN(1, FT16LO, FT16SPAN) ; reads in flow of stream A
2 FB=AIN(2, FT17LO, FT17SPAN) ; reads in flow of stream B
3 RCALC=FB/FA ; FY16
4 CO17=PID(RCALC, R, RLO, RSPAN) ; RC17
5 AOUT(1, CO17)
(b)
Figure 5-2.3 Software equivalent of Fig. 5-2.2.
c05.qxd 7/3/2003 8:28 PM Page 82
to FC16; then the set point to FC17 changes automatically once the flow rate of
stream A changes. In the control system of Fig. 5-2.1 the operator needs to change
two flows, the set points to FC16 and FC17.
The schemes shown in Figs. 5-2.2a and 5-2.4 are quite common in the process
industries. Recalling what was presented about computing blocks in section 5-1, we
realize that the implementation of the ratio stations can simply be accomplished
with the use of a unit such as the one shown in Table 5-1.2. Most computer control
systems offer a controller, referred to as PID-RATIO, that accepts a signal, applies
the same algorithm as the ratio unit, FY16, in Fig. 5-2.2a, and uses the internal result
as its set point. Thus, if a PID-RATIO is used, the calculations done by FY16 and
FC17 in Fig. 5-2.4 are performed in only one block.
As we have mentioned several times already, it is helpful in developing control
schemes to remember that every signal must have physical significance. In Figs.
5-2.2 and 5-2.4 we have labeled each signal with its significance. For example, in
Fig. 5-2.2a the output signal from FT16 is related to the flow rate of stream A and
has the label F
A
. If this signal is then multiplied by the ratio F
B
/F
A
, or simply R, the
output signal from FY16 is the required flow rate of stream B, F
B
set
. Even though
this use of labels is not standard practice, for pedagogical reasons we continue to
label signals with their significance throughout the chapter. We recommend that the
reader do the same.
Example 5-2.2. Another common example of ratio control used in the process
industries is control of the air/fuel ratio to a boiler or furnace. Air is introduced in
a set excess of that required stoichiometrically for combustion of the fuel; this is
done to ensure complete combustion. Incomplete combustion results not only in
inefficient use of the fuel, but may also result in smoke and the production of pol-
lutants. In addition, if not enough air is introduced, this may result in pockets of
pure fuel inside the combustion chamber—not a very safe condition. The excess air
introduced is dependent on the type of fuel, fuel composition, and equipment used.
However, the greater the amount of excess air introduced, the greater the energy
RATIO CONTROL 83
F
A
F
B
FC
17
FT
17
FT
16
X
Stream B
Stream A
F
B
set
FY
16
R
FC
16
SP
Figure 5-2.4 Ratio control of blending system.
c05.qxd 7/3/2003 8:28 PM Page 83
losses through the stack gases. Therefore, control of the air and fuel flows is most
important for safe and economical operation.
The flow of combustibles is generally used as the manipulated variable to main-
tain the pressure of the steam produced in the boiler at some desired value. Figure
5-2.5 shows one way to control the steam pressure as well as the air/fuel ratio control
scheme. This scheme is called parallel positioning control [2–4] with manually
adjusted fuel/air ratio. The steam pressure is transmitted by PT22 to the pressure
controller PC22, and this controller manipulates a signal, often referred to as the
boiler master signal, to the fuel valve. Simultaneously, the controller also manipu-
lates the air damper through the ratio unit FY24. This ratio station sets the air/fuel
ratio required.
The control scheme shown in Fig. 5-2.5 does not actually maintain an airflow/fuel
flow ratio, but rather, maintains only a ratio of signals to the final control elements;
the actual flows are not measured and used. The flow through the valves
depends on the signals and on the pressure drop across them. Consequently, any
pressure fluctuation across the valve or air damper changes the flow, even though
the opening has not changed, and this in turn affects the combustion process and
steam pressure. A better control scheme to avoid this type of disturbance, shown in
Fig. 5-2.6, is referred to as full metering control [2]. (Figure 5-2.6 is referred to as a
top-down instrumentation diagram, and it is commonly used to present control
schemes.) In this scheme the pressure controller sets the flow of fuel, and the airflow
is ratioed from the fuel flow. The flow loops correct for any flow disturbances. The
fuel/air ratio is still adjusted manually.
84 RATIO, OVERRIDE, AND SELECTIVE CONTROL
LT
LC
Steam
Boiler
feedwate
r
Stack
gases
Fuel
Air
FC
FO
PT
22
PC
22
FY
24
x
P
F
F
set
F
A
set
F
F
A
F
SP
Figure 5-2.5 Parallel positioning control with manually adjusted air/fuel ratio.
c05.qxd 7/3/2003 8:28 PM Page 84
RATIO CONTROL 85
FC
23
FC
24
PC
22
FT
24
FT
23
PT
22
Stack
Steam
Fuel
Air
FC
FO
F
F
set
F
F
P
F
A
SP
FY
24
x
F
F
A
F
F
A
set
(a)
F
F
F
A
FC
23
FC
24
PC
22
FT
24
FT
23
PT
22
Stack
Steam
Fuel
Air
FC
FO
FY
24
F
F
set
F
F
set
F
F
F
F
P
F
A
SP
x
(b)
Figure 5-2.6 Full metering control with manually adjusted fuel/air ratio.
c05.qxd 7/3/2003 8:28 PM Page 85
Notice the differences between the two figures. In Fig. 5-2.6a the signal from FT23
is multiplied by the ratio F
F
/F
A
before it is used as the set point to FC24; note that
the significance of all signals make sense. Figure 5-2.6b is the one that seems some-
what strange. The figure shows that the signal setting the set point to FC24 comes
from FT23; therefore, it is related to F
F
; FC24 is the controller that moves the airflow.
Note, however, that the signal from FT24, which is related to the airflow, is multi-
plied by F
F
/F
A
before it is used as the measurement to FC24. Thus, both the mea-
surement and the set point to FC24 have the same meaning. It seems that Fig. 5-2.6b
is somewhat more difficult to understand, but its use in the following schemes results
in fewer blocks to use.
Let us analyze the control scheme shown in Fig. 5-2.6 in more detail. When the
steam header pressure increases, probably due to a decrease in steam demand, the
pressure controller reduces the demand for fuel. As the set point to the fuel flow
controller is reduced, the controller closes the valve to satisfy the set point. As the
fuel flow decreases, the set point to the airflow controller is also reduced. Thus the
airflow follows the fuel flow, and during a transient period the entering combustible
mixture is richer in air than usual. Let us now consider the case when the header
pressure decreases, probably due to an increase in steam demand, and the pressure
controller increases the demand for fuel. As the set point to the fuel flow controller
increases, the controller opens the valve to satisfy the set point. As the fuel flow
increases, the set point to the airflow then increases; the airflow again follows the
fuel flow. In this last case, during a transient period, the entering combustible
mixture is not richer in air, and if not careful, it may even be lean in air. This situ-
ation is certainly not desirable, for the reasons explained at the beginning of the
example. Therefore, a control scheme must be designed to avoid these situations.
The control scheme must be such that when more combustibles are required to
maintain pressure, it increases the air first, followed by the fuel. When fewer com-
bustibles are required, it decreases the fuel first, followed by the air. This pattern
ensures that during transient periods the combustible mixture is air-rich. Figure 5-
2.7 shows a scheme, referred to as cross-limiting control, that provides the required
control. Only two selectors, LS23 and HS24, are added to the previous control
scheme. The selectors provide a way to decide which device sets the set point to the
controller. The reader is encouraged to go through the scheme to understand how
it works. As a way to do so, assume that the required air/fuel ratio is 2 and that at
steady state the required fuel is 10 units of flow. Consider next what happens if the
header pressure increases and the pressure controller asks for only 8 units of fuel
flow. Finally, consider what happens if the header pressure decreases and the pres-
sure controller asks for 12 units of fuel flow.
Since the amount of excess air is important for economical, environmentally
sound operation of the boilers, it has been proposed to provide a feedback signal
based on an analysis of the stack gases; the analysis is often percent O
2
or percent
CO. Based on this analysis, it is then proposed that the fuel/air ratio be adjusted.
This new scheme shown in Fig. 5-2.8 consists of an analyzer transmitter, AT25, and
a controller, AC25. The controller maintains the required percent O
2
, for example,
in the stack gases by setting the required fuel/air ratio.
Before finishing this section it is interesting to see how the control scheme shown
in Fig. 5-2.8 is programmed using the software language; this is presented in
86 RATIO, OVERRIDE, AND SELECTIVE CONTROL
c05.qxd 7/3/2003 8:28 PM Page 86
F
F
F
A
FC
23
FC
24
FT
24
FT
23
Stack
Fuel
Air
FC
FO
FY
24
F
F
set
F
F
set
F
F
F
F
F
A
<
PC
22
PT
22
Steam
P
>
F
F
set
F
F
set
LS
23
HS
24
SP
x
Figure 5-2.7 Cross-limiting control.
F
F
F
A
AC
25
AT
25
FC
23
FC
24
FT
24
FT
23
Fuel
Air
FC
FO
FY
24
F
F
set
F
F
set
F
F
F
A
<
PC
22
PT
22
>
F
F
set
LS
23
HS
24
SP
SP
%
O
2
Steam
P
F
F
F
F
x
Stack
Figure 5-2.8 Cross-limiting with O
2
trim control.
c05.qxd 7/3/2003 8:28 PM Page 87
Fig. 5-2.9. The comments associated with each statement help to relate the program
to Fig. 5-2.8. In this section we have shown two applications of ratio control. As
mentioned at the beginning of the section, ratio control is a common technique used
in the process industries; it is simple and easy to use.
5-3 OVERRIDE, OR CONSTRAINT, CONTROL
Override,orconstraint, control is a powerful yet simple control strategy generally
used as a protective strategy to maintain process variables within limits that must
be enforced to ensure the safety of personnel and equipment and product quality.
As a protective strategy, override control is not as drastic as interlock control. Inter-
lock controls are used primarily to protect against equipment malfunction. When a
malfunction is detected, the interlock system usually shuts the process down. Inter-
lock systems are not presented, but Refs. 5 and 6 are provided for their study. Two
examples of constraint control are now presented to demonstrate the concept and
implementation of the strategy.
Example 5-3.1. Consider the process shown in Fig. 5-3.1. A hot saturated liquid
enters a tank and from there is pumped under flow control back to the process.
Under normal operation the level in the tank is at height h
1
. If, under any circum-
stances, the liquid level drops below the height h
2
, the liquid will not have enough
net positive suction head (NPSH), and cavitation at the pump will result. It is there-
fore necessary to design a control scheme that avoids this condition. This new
control scheme is shown in Fig. 5-3.2.
The level in the tank is now measured and controlled. The set point to LC50 is
somewhat above h
2
, as shown in the figure. It is important to notice the action of
the controllers and final control element. The variable-speed pump is such that as
88 RATIO, OVERRIDE, AND SELECTIVE CONTROL
1 P = AIN(1, P
low
, P
span
) ; reads in pressure
2 FA = AIN(2, FA
low
, FA
span
) ; reads in air flow
3 FF = AIN(3, FF
low
, FF
span
) ; reads in fuel flow
4 %O2 = AIN(4, %O2
low
, %O2
span
) ; reads in %O
2
5 FOUT = PID(P, P
set
, P
low
, P
span
) ; PC22
6 ROUT = PID(%O2, %O2
set
, %O2
low
, %O2
span
) ; AC25
7 PFF
set
= (FF
span
/100)*FOUT + FF
low
; converts output of PC22 to
; fuel flow set point in engineering units
8 RATIO = (RATIO
span
/100)*ROUT + RATIO
low
; converts output
;of AC25 to FA/FF ratio in engineering units
9 RFF = FA*RATIO ; FY24
10 IF PFF
set
< RFF THEN FF
set
= PFF
set
ELSE FF
set
= RFF ; LS23
11 COFUEL = PID(FF, FF
set
, FF
low
, FF
span
) ; FC23
12 IF PFF
set
> FF THEN FF
set
= PFF
set
ELSE FF
set
=FF ; HS24
13 COAIR = PID(RFF, FF
set
, FF
low
, FF
span
) ; FC24
14 AOUT(1, COFUEL) ; outputs signal to fuel valve
15 AOUT(2, COAIR) ; outputs signal to air valve
Figure 5-2.9 Software program equivalent to Fig. 5-2.8.
c05.qxd 7/3/2003 8:28 PM Page 88
the input energy (current in this case) to it increases, it pumps more liquid. There-
fore, the FC50 is a reverse-acting controller, while the LC50 is a direct-acting con-
troller. The output of each controller is connected to a low selector, LS50, and the
signal from this selector goes to the pump.
Under normal operating conditions the level is at h
1
, which is above the set point
to the level controller; consequently, the controller will try to speed up the pump as
much as possible, increasing its output to 100%. Under normal conditions the output
of the flow controller may be 75%, and the low selector selects this signal to manip-
ulate the pump speed. Thus, under normal conditions the flow controller is manip-
ulating the pump. The level controller is not connected to the pump because the
level is not at an undesirable state. This is the desired operating condition.
Let us now suppose that the flow of hot saturated liquid into the tank slows down
and the level starts to drop. As soon as the level drops below the set point on the
level controller, the controller will try to slow down the pump by reducing its output.
When the level controller’s output drops below the output of the flow controller,
the low selector selects the output of the level controller to manipulate the pump.
It can be said that the level controller “overrides” the flow controller.
OVERRIDE, OR CONSTRAINT, CONTROL 89
FT
50
FC
50
To process
2
h
h
1
Hot saturated
liquid
F
Speed
Figure 5-3.1 Tank and flow control loop.
2
h
h
1
Hot saturated
liquid
LT
50
LC
50
LS
50
FT
50
FC
50
To process
h
SpeedSpeed
F
RFBRFB
Set point
Figure 5-3.2 Override control scheme.
c05.qxd 7/3/2003 8:28 PM Page 89