Biofuels, Solar and Wind as Renewable Energy Systems_Benefits and Risks Episode 1 Part 4 pot
Bạn đang xem bản rút gọn của tài liệu. Xem và tải ngay bản đầy đủ của tài liệu tại đây (345.38 KB, 25 trang )
3 A Review of the Economic Rewards and Risks of Ethanol Production 59
agri-businesses as production of ethanol and byproducts increase. The last section
discusses the near and longer term growth prospects for rural areas in the Midwest
and the nation as they relate to biofuels production.
3.2 Measuring and Mismeasuring Biofuels Economic Impacts
It is important to sort out the rhetoric of claimed economic benefits to be expected
from biofuels development in the Midwest and the nation because there are tremen-
dous amounts of public money at stake. In the very early stages of this modern
boom in ethanol plant construction, politicians, farm commodity groups, and eco-
nomic developers hailed the emerging industry as the right and proper evolution
of modern agricultural production capacities coupled inexorably with technological
breakthroughs and long overdue changes in the nation’s energy policies. Amidst this
enthusiasm, biofuels trade associations and some agricultural commodity groups
reported in various venues that scores of thousands of jobs have been created across
the Corn Belt and the nation. Some politicians and government agency represen-
tatives parroted those reports uncritically; Midwestern state governments began to
specifically and energetically apply government agency services in support of the
boom, along with offering lucrative tax credits and incentives to promote even faster
growth; land-grant universities promoted their vital scientific contributions in this
coming energy revolution; cities and counties scrambled to be the site of a modern
ethanol factory, to be on the plus side of economic trends for a change given the
historical deterioration of rural Midwestern economies and communities; and some
leaders in Midwestern states began to envision a social and economic resurgence in
rural areas.
Profound expectations like the aforementioned demand careful scrutiny, espe-
cially when massive amounts of national, state, and local government subsidy are at
stake. The place to begin is with the measurement of net economic gain attributable
to this run-up in ethanol production in the U.S. and the identification of who ben-
efits. Those aggressively promoting private and public investment in more biofuels
processing capacities range from farm commodity groups, farm state politicians,
some environmental organizations, automobile manufacturers, to both liberal and
conservative political orientations.
There are wide ranges of economic activity attributed to biofuels production. The
nation’s production of ethanol creates jobs at the ethanol plants, boosts the demand
for critical mechanical, technical, and service inputs, and helps to improve the prices
received by input commodity providers, namely corn producers. Beyond that, few
of the conclusions about the economic impacts of biofuels production appear to be
based on rigorous, enterprise or industry level research, however (Swenson 2006).
Much is of a very rudimentary level using broad assumptions about ethanol industry
activity and applying, uncritically and often inappropriately, national economic im-
pact ratios to deduce the size of economic activity attributable to ethanol production.
The estimates either at the local level or at the national level are quite diverse and
often incredible.
60 D. Swenson
As examples, at the national level, an Urbanchuck (2005) report for the Renew-
able Fuels Association used US Bureau of Economic Analysis factors to conclude
that 114,844 jobs in the national economy depended indirectly on the operation of
all ethanol plants and the purchases that are made by workers (and this did not
include ethanol plant employment). Earlier in the decade, when the industry was
even smaller, Novack (2002) of the Federal Reserve Bank of Kansas City was more
upbeat about the job total and reported in a widely read periodical that “ the
[ethanol] industry added nearly 200,000 jobs to the U.S. economy.” This is a curi-
ous claim given that the U.S. Department of Commerce’s industrial census for that
same year (2002) indicated the ethyl-alcohol industry had just 2,200 jobs. How the
author got from 2,200 jobs to 200,000 is not revealed, but the writer went on to
predict that “an additional 214,000 jobs [would] be created through the economy
over the next decade.” Last, as just one example of comments made by many farm
state politicians, former South Dakota U.S. Senator Thomas Daschle concluded in a
national and widely reprinted publication that the production of 3.1 billion gallons
of ethanol in the U.S. created 200,000 jobs (Daschle 2006).
These three examples are emblematic of the rhetoric underscoring ethanol pro-
duction expansion and public policy development in the U.S. The first was made by
a consultancy with long-standing ties with the Renewable Fuels Association, a trade
group that aggressively promotes corn ethanol policies and serves as the primary
information source for information on renewable fuels opportunities and capacities
in the U.S. The second claim came from a writer from the nation’s respected public
banking regulatory and financial research sector. In this case the Kansas City Federal
Reserve Bank also has a specialization in rural development economic studies and
affairs; hence, an assumption of rigor and credibility. The third job claim came from
a respected and long-time political leader and strong advocate for alternative energy
development. Given the implied authority of these three sources it is important to
investigate the source of their numerical enthusiasms. A good example for under-
standing the basis for the robust, yet quite misleading, job claims can be found in
recent work sponsored by the Iowa Renewable Fuels Association.
3.2.1 Deconstructing Ethanol Job Impact Claims in the Midwest
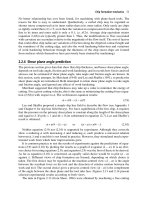
An Urbanchuck (2007) report for the Iowa Renewable Fuels Association (IRFA)
concluded that Iowa’s ethanol industry had created 46,938 jobs and contributed
$7.315 billion in state domestic product. Research at Iowa State University (Swenson
2007b) concluded, in contrast, that the state’s 28 ethanol producers in processing
600 million bushels of corn into approximately 1.65 billion gallons of ethanol cre-
ated from 4,100 to 4,700 net new jobs in the Iowa economy through 2005. The
public university statistics are a tenth of those produced by the trade group. The
following exercise explains most of the differences. Figure 3.1 displays the type and
number of jobs the IRFA research credited to lowa.
First, from the original number of 46,938 jobs are subtracted the 19,733 jobs
linked to capital development and construction. There are several good reasons for
3 A Review of the Economic Rewards and Risks of Ethanol Production 61
Construction
19,733
Corn production
18,398
Chemicals,
maintenance,
etc., 3,231
All Utilities
2,591
Transportation
1,442
Worker spending
1,192
Refined petroleum
351
Fig. 3.1 Iowa renewable fuels association estimates of ethanol job impacts in Iowa for 2005
doing this: Those are not net new permanent jobs – the jobs were all ready in the
larger regional economy as there is a generally fixed rate of capital formation in
the U.S. linked to the availability of investment resources and the overall pace and
pattern of capital growth; according to U.S. Bureau of Economic Analysis statis-
tics, the overall national rate of investment in the chemical manufacturing industry
where ethanol is located is actually less than the average for all manufacturing for
the 2000–2005 period; there is a finite number of plants that can and will be built
given this state’s current and likely future supply of corn and the rate of national
absorption of ethanol; and the capital development that those construction workers
are contributing to serves significantly as substitutes for energy-related and other
forms of industrial development in Iowa, the greater region, and in the nation. Elim-
inating the existing and spatially temporary construction jobs leaves us 27,205 jobs
to further parse.
Next, a full two-thirds of the purported non-construction ethanol impact jobs
were already in the economy whether there was or there was not an ethanol industry.
The IRFA study used a set of final demand multipliers to estimate the remaining
ethanol job and product impacts (BEA 1997). Final demand means that either the
industry is producing for final consumption by households and institutional users
within the region or it is producing for consumption by entities external to the
region of production. The fundamental assumption in the use of a final demand
multiplier and its interpretation, however, is that expansion in ethanol production
creates, concomitantly and at fixed rates, expansions in all inter-industrial relations
that industry has with all of its inputs suppliers. So the use of a final demand mul-
tiplier for a particular industry, like the organic chemical industry where ethanol
production is located assumes that as that industry expands production, there are
fixed-ratio expansions in all industries that provide its intermediate inputs.
62 D. Swenson
There is a fundamental flaw here because there is no real change in the overall
demand for corn in the short run, just a shift in corn deliveries destined for local
processing instead of for export. As a consequence, the application of a final demand
multiplier to the corn sector is completely spurious. Those jobs already existed and
would have existed had there not been an expansion in Iowa ethanol facilities. The
ethanol plant did not create the corn production jobs or all of the corn industry’s
up-stream supply linkages. To claim them as ostensibly having been created by
the emerging ethanol industry is misleading. To reiterate: ethanol production is not
creating more farmers.
So from the 27,205 total jobs attributed to Iowa’s ethanol industry operations in
the RFA report we must next subtract the 18,398 jobs linked to its existing corn
production sector. That leaves 8,807 jobs to investigate.
Several other items of critical inputs into production into this industry that are
listed in the IRFA study after the already discounted corn values must be scrutinized.
First, and importantly, the Iowa ethanol industry requires a large amount of natural
gas, electricity, and water. The job gains attributable in that study to these three
industries combined for 2,591 of the remaining 8,807 potential ethanol economic
impact jobs. Those utility suppliers, however, are massive, declining cost industries
in which the average costs of delivering their respective commodities up to capacity
decline sharply. An industry that is an extremely heavy, and therefore comparatively
easy to supply, user of a particular commodity is delivered that commodity at a
substantially reduced price due to strong distributional efficiencies. Large users of
utilities do not stimulate average job multiplier effects – they stimulate much lower,
marginal effects and as a consequence are charged rates that are significantly lower
than those charged to smaller users. This is a fundamental flaw in fixed-ratio impact
analysis employed by the authors of the study and one of the reasons that experi-
enced analysts conduct additional secondary research before reporting a statistic.
As part of the research conducted at Iowa State University on the potential eco-
nomic impacts of a biofuels ethanol plant, water, natural gas distributors, and rural
electric cooperative professionals were contacted to ascertain the potential new job
requirements from a large, single industry increase in demand of their respective
commodities in amounts indicative of a modern 50 million gallon per year (MGY)
ethanol plant. In all instances, the job requirements reported by those profession-
als was a tenth or less than the amount assumed in the multiplier-driven modeling
systems that are commonly used (Swenson and Eathington 2006). Based on that re-
search and on fundamental scale economy dynamics, it would not be unreasonable
to assume that the marginal job gains from all new utility related activities were
no greater than 25 percent of the reported values, the much lower estimates of the
utility professionals notwithstanding. If that were so, and there is strong economic
and practical evidence that it is, the utility job impacts could reasonably be reduced
to 648 jobs leaving a total of 6,864 jobs on the operational side of ethanol and other
corn processing production in Iowa.
Next to scrutinize is the reasonableness of the transportation assumptions creat-
ing 1,442 jobs. Iowa’s corn historically was hauled to a mill, to a livestock feeder,
or exported out of state. After processing in an ethanol refinery, the amount of
3 A Review of the Economic Rewards and Risks of Ethanol Production 63
weight that must be hauled is roughly the same as it had been when the corn was
simply exported, although the nature of the haulage is changed. We can allow for a
modicum of new rail capacity, new rail transport needs, and some shifting in local
transportation to account for these changes; although, like the corn statistic at the
start of this section, we have to conclude that nearly all of the overall transportation
had already existed in the region. Consequently, it is not unreasonable to allow for
only a 25 percent bump in net new transportation jobs to the region (considering
of course a substantial realignment from grain hoppers to ethanol tankers and other
hauling substitutes). That would lower the 1,442 transportation jobs to 361 net new
transportation jobs, thus leaving 5,782 corn processing jobs in Iowa to consider.
There are several categories of inputs that are not controvertible and would be
expected to in fact be new regional indirect industrial demand linked linearly to
ethanol plant operations. New ethanol plants will require substantial maintenance
and repair services; they will help to stimulate demand for a variety of financial
business services, to include banking, accounting, insurance, and other important
activities; and they do require a new schedule of industrial chemical inputs into the
production process, primarily yeasts, enzymes, and denaturants. For the time being,
we can conclude that those inputs and their concomitant output and job multipliers
are reasonable.
There is a fundamental question, though, about the likelihood of the bump in
petroleum refinery inputs that the IRFA report claims. In all, when one looks at
a modern ethanol plant’s production recipe, one does not identify a set of refined
petroleum product inputs (Tiffany and Eidman 2003). Their energy demands are
met overwhelmingly by natural gas and electricity. The organic chemicals industry,
the industry that manufactures such diverse commodities as acetone, nail polish,
and tear gas along with dozens of others, however, does have strong linkages to
refined petroleum products. The assumption that a modern Iowa corn ethanol dry
mill operation buys $84.4 million in refined petroleum products from state suppliers
as stated in the study is, however, not reasonable. It is especially dubious because
Iowa’s refineries made just $48.7 million in total sales across the whole state of
Iowa and only needed 13 jobs to make those sales. It seems quite appropriate, then
to reject the assertion that 351 refinery related jobs were created in Iowa.
After all adjustments, the impact estimate has now been reduced to 5,431 total
Iowa jobs that produce ethanol and other processed corn commodities, supplied
non-corn inputs, or otherwise produced goods and services for the households that
are supported by all of these enterprises.
The Renewable Fuels Association of Iowa report (Urbanchuck 2007) indicated
that the operational side of ethanol production in Iowa “ support[ed] 27,200 jobs.”
After systematically deconstructing the authors’ procedures and assumptions, how-
ever, it is more likely that somewhere around 5,431 total jobs in Iowa can be at-
tributed to ethanol and to all other non-fuel, corn processing production that were
also counted in that analysis. That adjusted amount is less than 20 percent of the
claimed operational amount and 11.6 percent of the original grand total that in-
cluded the construction jobs. It is not unreasonable to conclude that the magnitude
of misstatement at the national level is often analogous to the Iowa example.
64 D. Swenson
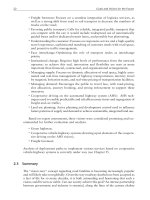
3.2.2 The Policy and Practical Implications of Bloated Economic
Impact Claims
The foregoing assessment assists in understanding the basic job growth potential
of modern ethanol production and the possible magnitude of error common in es-
timating that potential. The gap between perception and reality is profound and
procedurally troublesome because it has implications for public policy develop-
ment. Modern industrial development benefits strongly from federal, state, and lo-
cal government underwriting. New ethanol plants across the U.S. are reaping large
amounts of risk-reducing tax credits, subsidies, and other kinds of public support.
According to one recent study (Koplow 2007), U.S. subsidies in support of ethanol
production ranged from $1.42 to $1.84 per gallon in 2006 considering all capital
development, credits, and other support. Using the same criteria for comparison
that study concluded that subsidies for petroleum averaged just 2.4 percent of those
amounts (Brasher July 2007). In Iowa, newer plants are demanding and receiving up
to 20 year local property tax abatements, along with several other very valuable state
tax breaks under its High Quality Job Creation Program, programs to spur capital
development, and transportation assistance.
Local, state, and national public policies, incentives, and subsidies are currently
allocated based on an expectation of net gains to regional economies. The IRFA
study and others like it entice conclusions about the economic gains to regions that
are unwarranted, however. Across the nation there is evidence of confusion and a
fusion of the statistics that are used for promotion, which one must necessarily look
at with a grain of salt, and of statistics that are used to justify sound public decision
making, which are supposed to be based on sound scientific, economic, and policy
research. If public resources are allocated on the basis of misleading or exagger-
ated expectations of economic gain that will not materialize, then public resources
will have been squandered and the competing alternative uses to which those pub-
lic resources could have been put will have been thwarted. And if so, society
suffers.
3.3 Ethanol Production Economic Opportunities and Offsets
In a mature and relatively stable commodity production and distribution system,
large changes in one segment of that system have consequences for other aspects
of agriculture, non-agriculture industries, the public, and households. Initially it is
important to note that the placement of a modern biofuels plant in a rural economy
will result in an expansion of net regional industrial production. In the short run
there is a positive economic impact to be expected. The rapid run-up in ethanol plant
development in the 2005 through 2007 period, however, has also had consequences
in many other aspects of agriculture, the impacts of which are just starting to be un-
derstood. This section works through some of the regional economic opportunities
and offsets that must be considered as this industry matures in the Midwest.
3 A Review of the Economic Rewards and Risks of Ethanol Production 65
3.3.1 The Incidences and Economic Benefits of Farmer
Ownership are Waning
The majority of ethanol plants in Iowa, South Dakota, and Minnesota in the first part
of this decade were considered to be “farmer” or otherwise cooperatively or locally
owned. The structure of this relationship was such that corn producers as inves-
tors linked themselves to a value added production process for their commodity
(Gallagher 2005). The reason for this vertical configuration was that transportation
costs from some of the nation’s best corn production areas ate away at much of
the profits to be made from farming. The greater the production costs of shipping
corn for export, for example, to the barge terminals on the Mississippi River in
Minnesota, Iowa, and Illinois, the lower the price received locally. Areas with a
substantial commodity price basis penalty due to transport costs had strong incen-
tives to convert grain to more profitable uses. Livestock feeding is one value added
opportunity, and ethanol production is another. A local ethanol plant allowed area
farmers to receive a nominally higher price for their corn as it was not sold with the
implied shipping penalty.
Most new plants are not in any meaningful sense farmer or even locally owned
(Lavigne 2007). Still, there is a strong preference in the Midwest for promoting
local ownership of industrial stock (Morris 2007). States like Iowa, the Dakotas,
and Minnesota have, to differing degrees enacted programs and policies to promote
combinations of local, often-times small or rural investors in emerging enterprises
like wind energy and biofuels. The policy and development argument is that local
investors will rely on local banks along with financial and legal expertise will be
more likely to contract for construction and input services with local suppliers, and
most of all will be likely to convert their returns on investment to local consumption
and additional local investment.
While local or farmer ownership was the early model for ethanol plant develop-
ment, as this industry began to rapidly grow, equity investments were sought and
received from all kinds of investors from all over the country. Research at Iowa
State University (Swenson and Eathington 2006) indicated that, given a 50 MGY
ethanol plant, the total added job impacts grew by 29 jobs for every 25 percent
that the plant is owned by local residents. In short, local ownership coupled with
large returns on investment locally yielded greater main street sales in the plant
communities.
Those enhancements to local economic impacts were calculated based on the
very robust returns received by investors in 2005 and would not be appropriate in
the current market where returns are much more constrained. Importantly, those
robust returns were also calculated without measuring the opportunity cost of the
locally-supplied investment capital. The opportunity cost would be the normal next
best alternative to which this investment money would have been put in that regional
investment environment. The net return in excess of the opportunity cost is an un-
known as we have no way of knowing exactly how regional investors had hitherto
used their savings.
66 D. Swenson
There are, therefore, three considerations that must temper the expectation of
localized economic impacts from high levels of regional ownership. The value of
alternative uses of that investment capital is not known, but one would assume that
the normal investors’ returns on all savings would have at least matched the na-
tional rate of return. Second, many farmer investors have borrowed against existing
assets to invest in biofuels production. That action shifts net gains away from the
now mortgaged enterprise, farming, to the new enterprise. That investment option
has been widely reported, but the magnitude of it cannot be measured. Last, an
increasing number of investors are not farmer-investors, and whether they reside
regionally or not, there is no reason to expect those kinds of investors to behave,
in the aggregate, any differently than all other investors (Lavigne 2007). Hence, for
them, there is no discernible local impact to be assumed.
By the middle of 2007, growth in ethanol production capacity outstripped the
national rate of absorption of ethanol and prices moderated considerably leading
biofuels researchers to forecast constraints on the profitability in many of the plants,
especially the older, smaller, and less efficient operations (Tokgoz et al. 2007). Con-
sequently, one would expect that many plants are not paying substantial dividends as
before, and that means the overall benefits of farmer or local ownership are expected
to erode.
3.3.2 Higher Returns to Corn Producers and Land Owners Plus
Higher Land Rents
Corn producers first promoted ethanol as a mechanism for localized gains in corn
prices. The closer a corn farmer was to an ethanol plant, the better the net return
on the corn as the comparatively high cost of shipping to alternative buyers was
minimized. The farther a farmer was away from a plant, the less of an implied
price bump (McNew and Griffith 2005). As the pace of ethanol plant expansion
increased through the 2006 production year, however, corn prices nationwide, not
just locally, began to climb. Figure 3.2 shows the nominal (not adjusted for inflation)
average annual price of corn per bushel over the past several years and as projected
through futures. While corn prices demonstrate some strong fluctuations, they aver-
aged near $2.00 for much of the previous decade. In 2006, however, average prices
rose sharply as more and more plants began to process ethanol, as demonstrated in
Figure 3.2. Accordingly, the average price received nationwide rose by 58 percent
over the previous year, though there is the expectation of strong localized volatility
in corn prices over time as corn supplies and demand adjust (Hart 2007).
Corn farmers, however, did not see their net receipts increase by 58 percent over
those two years, and in fact the U.S. BEA noted that Iowa farm earnings in 2006
were actually 5.3 percent lower than the year previous (BEA 2007) despite the
corn price run-up. First, like all producers and consumers in the U.S., higher energy
prices have affected farmers’ bottom lines. Modern corn farming is energy intensive
requiring large amounts of distillates for tractors, fertilizers derived in the main
from natural gas, and propane for drying grain. So the same high oil prices boosting
ethanol demand, and consequently, the demand and price received by farmers for
3 A Review of the Economic Rewards and Risks of Ethanol Production 67
$-
$0.50
$1.00
$1.50
$2.00
$2.50
$3.00
$3.50
1997 1998 1999 2000 2001 2002 2003 2004 2005 2006 2007 2008
FAPRI U.S. and world a
g
ricultural outlook, 2007
Fig. 3.2 U.S. corn prices per Bushel
their corn, is also boosting variable production costs on the farm. Second, as market
prices increase, the total amount of government payments to corn farmers decrease,
which assuredly is good news for taxpayers but still must be counted when com-
piling the net change in corn farmer returns and, by extension, the well being of
rural economies (Westcott 2007). In all, as price increases the financial position of
corn farmers improves, but the exact amount of improvement must be calculated
net of subsidy reductions and the changes in all other fixed and variable costs of
production changes.
Price driven gains to farmers have two very important outcomes regionally. First,
they eventually help bolster the overall profitability of farming as an enterprise,
which in turn is realized in higher amounts of on-farm capital and other investment
along with boosted farm family spending. Second, sustained higher prices must in-
crease the value of farm land. Over time, farmers who are landowners will realize
price-induced capital gains on their land investments. For farmers that must rent
their land, however, they will realize higher land use costs, which in turn will limit
their net gains on production. In Iowa, according to the 2002 Census of Agriculture,
51 percent of the land in farms was rented. Higher corn prices will therefore result
in increased land rent costs for 51 percent of Iowa corn crop production.
3.3.3 Higher Feed and Input Costs for Other Corn Consumers
Most Americans do not eat much corn. They do, on the other hand, eat a tremendous
amount of products that are directly or indirectly derived from corn. Nearly all pork,
68 D. Swenson
beef, dairy, chicken, turkey, and egg products in the U.S. rely strongly on corn as
a feedstock. Also, Americans have increasingly come to rely on high fructose corn
syrups (HFCS) as a sugar substitute in many foods, beverages, and confections. It is
apparent that there is strong demand for corn as a critical input into food production
in the U.S.
Table 3.1 demonstrates the uses of corn historically. In 2000 about 11.3 percent
of all corn was made directly into food or high fructose corn syrup. Over 50 percent,
however, was a feed to livestock, 16.7 percent was exported, and only 5.4 percent
was used for ethanol. By 2005, the amount of feed demanded had increased to 6.1
billion bushels, but ethanol’s demand for corn had increased by more than 150 per-
cent. As a consequence of the increased demand for ethanol, the projection for 2010
has the amount of corn available for feed as eight percent lower than in 2005. At
that time ethanol is expected to consume 30 percent of the nation’s corn supply, up
25 percentage points in just a decade.
The high reliance on corn inputs by the livestock sector is ostensibly offset by the
production of distillers’ grains at the ethanol plants. Distillers’ grains are the high
protein residue left after the ethanol fermentation process is completed. Distillers’
grains can be fed in varying degrees to livestock, ranging from 30 to 40 percent of
diet to feeder cattle down to 10–20 percent for dairy cows, swine, or poultry. No
matter the supply and price of distillers’ grains and the mix of rations employed,
feeders will still have to include some corn input costs in the mix. American cattle
producers appear to be cautious about the rapid growth in the ethanol industry and
have recently argued against an expansion in federal ethanol production subsidies
beyond current levels (NCBA 2007), with increased corn prices as the rationale.
Higher feed prices have several likely expected outcomes that may reduce meat
and poultry supply. First, livestock producer net returns will shrink; this is especially
the case for those that are located at some distance from ethanol plants and who had
historically depended on Midwestern corn supplies. In some cases, less profitable
operations will cease production entirely. In other instances, producers will not fin-
ish livestock as long – the point at which additional feed yields an optimal return
will move towards a smaller animal. Hence, animals will be marketed at a lighter
weight.
Table 3.1 Historical and projected uses of corn
2000 Percent of
supply
2005 Percent of
supply
2010 Percent of
supply
Corn Supply
(Millions of Bushels)
11,639.42 100.0 13,237.00 100.0 14,266.60 100.0
Ethanol 627.59 5.4 1,603.00 12.1 4,307.65 30.2
Feed 5,842.09 50.2 6,140.83 46.4 5,657.81 39.7
Food 780.24 6.7 829.90 6.3 861.69 6.0
HFCS 529.75 4.6 528.60 4.0 530.38 3.7
Other 185 1.6 190.20 1.4 196.52 1.4
Seed 19.30 0.2 20.17 0.2 23.33 0.2
Exports 1,941.35 16.7 2,147.34 16.2 1,885.72 13.2
FAPRI U.S. and world agriculture outlook, 2007.
3 A Review of the Economic Rewards and Risks of Ethanol Production 69
Finally, all consumer prices will increase as consumers absorb the higher costs
associated with a lower meat and poultry supply. In all other instances, say for the
production of HFCS and other corn to food products, prices will likely be passed
on to consumers or otherwise result in lower returns to manufacturing producers
(Westcott 2007).
In the longer term, expansion in ethanol production may lead to further concen-
tration and vertical integration in the U.S. meat production sector. The dominant
business model for poultry and meat production has a prominent firm like Tyson
Foods or Smithfield Foods involved significantly with all aspects of breeding, pro-
duction, processing, and distribution. As modern ethanol plants produce immense
amounts of distillers’ grains that are mainly suitable as cattle feed, it is possible
that future ethanol plants will include very large integrated cattle feeding operations
in order to efficiently feed distillers grains and to capture additional efficiencies by
using animal waste as a source of fuel.
Spatial shifts in meat production are another possible outcome. Areas of the
Midwest that have the highest concentration of corn production also have some
of the nation’s greatest concentrations of swine and poultry production because of
very strong production efficiencies to be achieved from locating amidst high feed
supplies. Iowa, as an example, ranks first nationally in swine and in egg production,
and those animal concentrations are centered in the best corn growing areas. Cat-
tle on feed, in large measure, are located much further to the west and southwest.
Paradoxically, the animals that are least tolerant of distillers’ grains and can only
consume it in smaller amounts are found in higher numbers in the areas of the U.S.
where there are comparatively high concentrations of ethanol plants, and the animals
that are most tolerant are in comparatively lower numbers. It remains to be seen
whether production advantages accumulate to the beef industry because it can more
readily incorporate distillers’ grains as feed and whether those advantages will work
at the expense of poultry and swine production.
3.3.4 Grain Storage, Processing, and Distribution
Systems Will Change
The nation’s grain storage and transportation infrastructure developed over the years
in direct response to the historical pace and pattern of crop production in the U.S.
As Midwestern states have most of the nation’s corn producing capacity, there are
extensive systems for storage, marketing, and distributing that bounty. The nation’s
infrastructure for moving corn includes the inbound systems, the storage systems,
grain processing systems, and the outbound systems. The nation’s capacity in all
aspects of managing its grain supply has developed over a long period of time and,
as these are all highly capital intensive systems, that capacity closely matches pro-
duction. There are several issues affecting this complicated sector of the economy
that must be taken into account as the ethanol industry develops (Ginder 2007).
Ethanol plants are able to store anywhere from 10 to 25 days worth of corn. Corn
that is delivered directly to the ethanol plant from farm storage, however, is corn that
70 D. Swenson
is not conveyed through local grain elevator systems or moved outbound via rail as
historically had been the situation. So in the initial stages of ethanol plant develop-
ment, gains to farmers and the expansion of ethanol production must be assessed in
light of a reduction in gross receipts and reduced efficiencies on investments in all
grain handling systems. As the industry matures and as competition for corn requires
greater grain origination and distribution skills and efficiencies, the nation’s elevator
systems may come to play an integral role in moving corn into ethanol plants, but
the extent and effectiveness of the sector remains to be demonstrated. In the near
term, the rapid diversion of grain stocks into ethanol plants has impinged on the
profitability of traditional grain handlers.
The rail transportation rolling stock that evolved to move corn is ill-suited to
moving either ethanol or the byproducts of ethanol. Ethanol is primarily transported
in truck and rail tankers, and cannot be transported by pipeline. Its primary byprod-
uct is distillers’ grains, which in either wet or dried form needs special rail stock as
well. Furthermore, planned improvements and expansions on the Mississippi River
and Illinois River locks and dams have been justified based on controversial ex-
pectations of strong growth in corn exports out of the Midwest (WSTB 2004). The
expansion of ethanol production interferes with that justification in the long run, and
in the short run makes the existing barge and terminal systems in the interior of the
country less efficient and, therefore, less profitable.
Corn acre plantings in 2007 are estimated at 19 percent higher than 2006, and
soybean plantings are down by 15 percent. Each acre of corn produces from two
to three times the bushels per acre as soybeans, the primary crop sacrificed for
expanded corn acres. As the nation’s grain storage capacity is closely matched to
grain production historical development, this rapid rise in corn supply will rapidly
exhaust the nation’s existing on-farm and elevator storage capacity. Storage capacity
is very expensive, and it remains to be seen exactly where the economic incentives
will accrue that will induce capital investment in this area. The risk, of course, is
that expansion in grain storage will become potentially excess capacity if and when
the nation shifts towards cellulosic ethanol production.
3.3.5 Spatial Changes in Crop Production
Which crop can be produced on which acre of land most profitably depends on
many factors, but when the price of a commodity rises sharply, as has been the
recent experience with corn in the U.S., land that had been primarily suitable for
one mix of crops might now be suitable for a different mix.
Corn acreage increased in 45 of the lower 48 states between 2006 and 2007 due
primarily to strong futures prices during the crop planning season of post harvest
2006 and planting time in 2007. The states of Indiana, Illinois, Minnesota, Califor-
nia, and North Dakota posted record corn plantings. The amount of greatest gain
was in Illinois at 1.9 million more acres. A grain producing state with the strongest
shift is North Dakota with nearly a 48 percent rise in corn plantings. Their increase
came at the expense of a 7 percent reduction in all wheat planting and a 21 percent
3 A Review of the Economic Rewards and Risks of Ethanol Production 71
reduction in soybean acres. Kansas soybean plantings were down by 24 percent,
Nebraska’s by 21 percent, Indiana’s by 19 percent, and South Dakota’s by 16.5
percent. (NASS 2007).
Increased plantings of corn will affect the aforementioned storage issue: corn
produces significantly more bushels per acre than either soybeans or wheat. In ad-
dition, large shifts in production will have up-stream impacts on normal regional
uses of agricultural commodities. Existing processors of oil seeds for food, feed, or
other uses will have sharply increased input costs due to the supply reductions. In
the longer run, some commodity needs such as soybeans will necessarily be met by
increased imports (Westcott 2007).
The large shift in corn acres also places stress on the nation’s corn-inputs system.
Corn requires fertilizers that derive mainly from natural gas, petroleum distillates for
machinery, and large amounts of propane for drying corn. In all, a strong positive
shift in corn production in the U.S. increases the demand for a wide array of energy
inputs, which in turn drive up the prices charged to other users of those same inputs.
Finally and importantly, there are important environmental issues associated with
corn production. The crop’s need for high amounts of petroleum based and chemical
inputs degrades groundwater and shallow aquifers. Dominant corn tilling practices
also result in soil runoff, siltation of streams and rivers, and ultimately the creation
of hypoxia zones in the Gulf of Mexico due to, primarily, ag-originated nutrient
runoff into that area. These all entail external economic costs that are not borne by
the industry or its beneficiaries, but by society at large.
There is pressure to expand the nation’s land in production. There are two
sources: existing pasture land and land currently enrolled in the Conservation Re-
serve Program (CRP). In both instances, long term land use preferences and national
policy combined to remove vulnerable and marginal land from crop production. The
conversion of these acres may exacerbate a wide array of environmental issues, to
include increased soil erosion, surface water degradation, and soil nutrient depletion.
3.3.6 The Biofuels Industry will Obtain Scale Economies
Some early ethanol plants produced just 10–20 million gallons yearly (MGY) of
ethanol. Over time, ethanol plant sizes increased as investment capital became
more available, as public subsidies helped to underwrite and offset risk, and as
ethanol prices stabilized and demand demonstrated positive growth. Like many cap-
ital intensive industries, there are strong internal economies of scale opportunities.
Economies of scale occur as a firm is able to, through more efficient utilization of
its capital stock, procurement of inputs, and labor, achieve lower average costs of
production per unit of output.
An obvious demonstration of scale economies presents itself readily in the
ethanol industry itself. As is demonstrated in Figure 3.3, a 50 million gallon per
year (MGY) ethanol plant in Iowa requires 36 jobs. A 100 MGY per year plant only
requires 46 jobs. The plant increases its output by 100 percent, but its job needs
only go up by 28.5 percent. Similarly, the plants will achieve strong efficiencies in
72 D. Swenson
36
46
98
124
50 MGY 100 MGY
Ethanol
Plant
All
Other
Fig. 3.3 Ethanol plant job impacts by plant capacity in millions of gallons per year (MGY)
the use of storage systems, grain moving and handling infrastructure, its land, much
of its technical inputs, and larger bulk purchases of its required inputs.
As the industry shifts, as firms become, on the average, larger and more effi-
cient, larger and better operated firms, usually those that were built most recently
will have higher returns per unit of production when compared to smaller and less
efficient plants. In consequence there is the expectation that in the very near future
several of the nation’s smaller, typically locally owned ethanol plants will become
less profitable and will likely be forced out of business (Miranowski 2006).
3.4 Bioenergy Promotion and the Overall Sustainability
of Rural Economies
In October of 2006 a joint U.S. Department of Energy and U.S. Department of
Agriculture conference was held in St. Louis entitled “Advanced Renewable En-
ergy: a Rural Renaissance.” New York Senator Hillary Clinton that year noted in
a press release that “We can create a rural renaissance and restore the promise of
Main Street ”inpartby“ investing in renewable energy ” (Clinton 2006).
Along similar lines, U.S. Senators Norm Coleman of Minnesota and Mark Prior
of Arkansas jointly proposed a Rural Renaissance II program in the U.S. Senate
that would provide low-interest loans along with grants to rural areas to develop
infrastructure and to entice investment in renewable fuels and energy sources (U.S.
Senate 2005). The head of the United Nation’s Food and Agriculture Organization,
3 A Review of the Economic Rewards and Risks of Ethanol Production 73
Alexander Mueller, concluded in 2007 that properly promoting biofuels could be
an “important tool for improving the well-being of rural people if governments
take into account environmental and food security concerns.” (FAO Newsroom
2007).
In each of these instances there is the assumption that the production of renew-
able energy from wind, corn, and biomass feedstocks will rejuvenate rural areas.
Those assumptions are, however, lacking significant substantiating evidence in the
near term. For example, wind energy, which is expanding smartly in several places
in the Midwest and Plains areas, is disproportionately controlled by existing, re-
gionally dominant investor-owned utility systems. Those companies negotiate land
rents for their structures, but otherwise their overall economic impact to regional
economies is quite limited – once the machines are up and running, they do not
require significant regionally supplied inputs.
The rural economic development potential of cellulosic systems is a complete
unknown. Scientists and engineers can agree on many of the technical details and
distributional requirements. Technical agreement notwithstanding, economics, how-
ever, require that the price of fuel must increase drastically before biomass can be
efficiently and competitively processed. The only realistic contemporary laboratory
for gauging the revitalization potential of modern biofuels is the current expansion
in corn ethanol production in the U.S. and to a lesser extent biodiesel production
from oil seeds (Tokgoz et al. 2007). And the market attributes of both of those
examples are distorted via the range of subsidies underwriting the current pace of
growth.
There are heady expectations for growth, and some recent research (Ugarte
et al. 2006) has projected that the attainment of several biofuels production goals
in the U.S. will by 2030 create as many as 2.4 million new production related
jobs in the U.S. were the nation to produce 60 million gallons of biofuels, many of
which could accrue to rural areas. That research is probably much too enthusiastic
about the potential: much of it presupposes yet to be proven technical, distribu-
tional, investment, and policy developments that would allow for the optimization
of production in attaining that optimistic goal. It also projects a future national in-
dustrial structure based primarily on the contemporary economy, a dicey prospect
in economic modeling. The structure of the national economy in 2030 will be very
different from the structure at present.
3.4.1 Putting Biofuels Job Change and Growth
into Perspective in the Near Term
The interior economy of the U.S., to include its more rural areas, has not grown
at anywhere near the pace as the remainder of the U.S. We also know that manu-
facturing in the interior of the U.S. has been hard-hit over the past decade. Ethanol
production from corn is a form of chemical manufacturing. When we look at the
overall value of manufacturing to any economy, two factors are paramount: the
number of jobs created and, of course, the associated earnings that workers convert
74 D. Swenson
to household consumption. Per unit of output, ethanol requires relatively few jobs as
compared to the average manufacturing firm. The jobs produced, however, are good
jobs when measured by wage and salary.
There have been very strong declines in manufacturing jobs during the present
decade. Nationally, between 2000 and 2005 the nation lost nearly 3 million manu-
facturing positions, about 18 percent were in non-metropolitan areas of the nation,
areas that did not have a central city of 50,000 or more. The chemical manufacturing
industry, of which ethanol production is a subset, lost almost 100,000 jobs over the
same time period. In 2005 the average earnings of a U.S. manufacturing job consid-
ering all wages, salaries, and benefits was $60,100. In the chemical manufacturing
sector it was $69,150.
The firm and job growth directly associated with ethanol production in the U.S.
can be readily estimated even though current detailed U.S. statistics are not avail-
able. In 2005, just over 1.6 billion bushels of corn were converted into ethanol.
Assuming that those plants generated at a maximum 2.7 gallons of ethanol per
bushel (EEOE 2007), that their average size at that time nationally was 65 million
gallons per year (MGY), that they operated at 115 percent of average capacity, and
that each plant averaged 38 jobs, then the U.S. ethanol industry directly required
78 plants and 2,910 jobs to process 1.6 billion bushels of corn. Average pay at
new U.S. ethanol plants ranged from $45,000 to $55,000 per year – substantially
less than either the U.S. manufacturing average or the average for chemical man-
ufacturing, but substantially more than the nonfarm earnings average in most rural
areas.
Were the industry to grow to process just over 4.3 billion bushels of corn annually
by 2010, and assuming that plants were, on average producing 2.7 gallons of ethanol
per bushel of corn, were rated at 85 MGY in average capacity, produced at 120
percent of rated capacity, and had 47 jobs per plant, then the U.S. ethanol industry
would require 165 plants and 7,716 jobs in 2010 as shown in Table 3.2. If the rural
areas of the U.S. lost some 540,000 manufacturing jobs between 2000 and 2005, it
is impossible to conclude that just from corn ethanol the addition of 7,716 jobs will
yield a rural renaissance. Figure 6.4, compares just the expected gains in ethanol
plant jobs through the end of this decade nationally to the erosions in just chemical
manufacturing jobs in the U.S. during the first half of the decade.
Finally, for distributional perspective, if it is assumed that two thirds of the fu-
ture corn ethanol production capacity were concentrated in Iowa, Indiana, Illinois,
Nebraska, and Minnesota, then there would be, on average, one plant per just over
four counties, which would work out to slightly fewer than 11.5 new manufacturing
jobs per county.
Table 3.2 U.S. ethanol plants and jobs
Corn bushels
in millions
plants jobs
2005 1,603 78 2,964
2010 4,307 165 7,716
3 A Review of the Economic Rewards and Risks of Ethanol Production 75
Organic chemicals,
–99,717
Ethanol
(Corn), 4,806
2000 to 2005 2005 to 2010
Fig. 3.4 Organic chemical manufacturing job change compared to expected ethanol job growth
3.4.2 The Longer Term Prospects for Rural Areas
from Biofuels Development
A hallmark of modern agribusiness and modern manufacturing is the persistent sub-
stitution of capital for labor. In 1970 the average farm worker in Iowa tended 200
acres of crop land. In 2005 the average Iowa farm worker tended 300 acres of crop
land.
The prospect of increased biofuels production presupposes an extension if not
an acceleration in the uses of mechanical and chemical inputs into agricultural
production as farmers shift production to accommodate the corn ethanol industry’s
rapid expansion of late. Simultaneously, the corn ethanol industry itself will expand
preferring to develop highly efficient production systems closer to the 100 MGY
per year range and larger, which also will require much less labor per gallon of
production than is currently the industry average. Both of these assumptions do not
portend a rural economic recovery, but rather a continuation if not an acceleration of
the fundamental factors undermining most rural areas in the interior of the country:
limited and specialized labor demands in only a few dominant industries that are
increasingly capital intensive; and production systems that require, over time, fewer
and fewer regionally supplied intermediate labor inputs.
The longer term technical and policy outlook contains an expectation of ethanol
production deriving significantly from cellulosic stocks, to include ultimately acres
of crop land that are dedicated to perennial energy production. If such a situation
were to eventuate, then there indeed may be the potential for meaningful expansion
in the value of productivity in many places of the U.S. that heretofore had not pros-
pered. Before those unhatched chickens can be counted, however, there are several
very important factors that will have to be resolved.
First and foremost, given current technology, cellulosic ethanol production, even
under ideal conditions, is not cost effective.
76 D. Swenson
The infrastructure needs for harvesting, converting, separating, transporting, and
ultimately processing cellulosic feedstocks currently do not exist and can only be
imagined. The production and distributional efficiencies at the plant and spatially
are significantly unknown.
The overall labor requirements of processing cellulosic feedstocks is not well
understood in light of the current trends in the ratios of labor to all crop acres. Shifts
from one form of production, as in the current corn system, to another, such as what
might eventuate from energy crop production will require a reallocation of labor
and machinery, but not necessarily changes that will indirectly stimulate regional
growth, especially in rural households.
The distribution of crop production and processing capacity relative to regional
demand will likely favor development closer to built up areas with high demand
potential to minimize transport cost and maximize returns.
More remote, yet potentially productive, areas of the U.S. may realize long de-
lays in the timing of biofuels development due to distance, infrastructure, and other
constraints.
Global volatility in oil prices may not stimulate the pace and pattern of invest-
ment expected to produce expected future levels of biofuels.
The nation’s absorption of ethanol as a fuel source will have to increase
dramatically.
And finally, an energy policy and a rural development promise that depends on
rain has inherent volatility.
There are many important considerations associated with biofuels production and
development in the United States that were not dealt with in detail in this chapter.
Enterprise-level analysis of the overall costs of operation helps policy makers and
decision makers understand the production characteristics of corn and alternative
ethanol production and the effects of both external and internal production factors
in determining the profitability of ethanol (Tiffany and Eidman 2003). The scope
and costs of ethanol subsidies are neither detailed nor assessed here, but it must
be recognized that the combined public costs of ethanol production as measured
in total or on a per gallon basis is high and promises to grow. Last this analysis
does not look at the overall efficacy of this form of energy development vis a vis
all others. It is very difficult for many economists to discern net national gains to be
derived from the current biofuels policies, and in light of that we see the rationale for
ethanol promotion and biofuels development shifting from economics and economic
welfare to one of “enhanced national security ” (Brown 2007).
There are tangible regional economic and environmental aspects to the current
debate on the development of biofuels in the U.S. Some are treating the topic in
a race-to-the-moon manner with a promise of technological determinism that will,
ultimately, lead to substantial social payoffs and an ultimate rationality to the pro-
cess. In the meantime, however, public decision makers are charged with maximiz-
ing social gains, minimizing the undesirable consequences of public action, and
assuring the nation through sound policy research that the economic benefits to be
achieved from the nation’s biofuels initiatives do indeed outweigh the economic,
social, and environmental costs of implementing them and are, on net, better than
the alternatives. To date, there is precious little evidence that is so.
3 A Review of the Economic Rewards and Risks of Ethanol Production 77
References
Brasher, P. (July 15, 2007). The end of the biofuels money train? The Des Moines
Register. Des Moines, Iowa. Retrieved from />article?AID=/20070715/BUSINESS01/707150330/-1/biofuels
Brown, R.C. (March 2007). Options for biofuels. Potential to produce liquid fuels
from cellulosic feedstock. Alternative crops and alternative policies for bioen-
ergy web program. Iowa State University Cooperative Extension. Retrieved from
/>Bureau of Economic Analysis (BEA) (1997). Regional multipliers: A users guide for the Regional
Input Output Modeling System (RIMS II). U.S. Department of Commerce. Retrieved from
/>Bureau of Economic Analysis (BEA) (2007). State income and employment summary,
Table SA04. U.S. economic accounts. U.S. Department of Commerce. Retrieved from
/>Clinton, H.R. (July 21, 2006). Remarks of Senator Hillary Rodham Clinton calling for a rural
renaissance to restore the promise and prosperity of main streets and rural communities. Pre-
pared speech delivered in Lockport, NY. Retrieved from state-
ments/details.cfm?id=260431&&
Daschle, T. (March 2006). Follow the farmers. American Prospect. Retrieved from
/>the farmers
EERE (Energy Efficiency and Renewable Energy) (March 2007). Useful information about
alternative fuels and their feedstocks. U.S. Department of Energy. Retrieved from
/>info.pdf
Energy Information Administration. (August 2007). Short term energy outlook, Table 5A. U.S.
Department of Energy. Retrieved from />FAO (Food and Agriculture Organization) (April 23, 2007). Bioenergy could drive rural devel-
opment. FAO of the United Nations. Retrieved from />2007/1000540/index.html
FAPRI 2007 (January 2007). U.S. and world agricultural outlook. Food and Agricultural Policy
Research Institute. Iowa State University and the University of Missouri – Columbia. Re-
trieved from the Center for Agriculture and Rural Development, Iowa State University Web
site />Gallagher, P. (2005). Pricing relationships in processors’ input market areas: Testing theories for
corn prices near ethanol plants. Canadian Journal of Agricultural Economics. 53, pp. 117–139.
Ginder, R. (July 2007). Potential infrastructure constraints on current corn-based and fu-
ture biomass based U.S. ethanol production. Department of Economics Working Paper
#7018, Iowa State University. Retrieved from />paper
12836 07018.pdf
Hart, C. (Summer 2007). Shifting corn basis patterns. Iowa Ag Review, 13:3, pp. 8–10
Koplow, D. (April 2007). Biofuels at what cost? Government support for ethanol and biodiesel in
the United States. Global Studies Initiative of the International Institute for Sustainable Devel-
opment. Retrieved from />subsidies us.pdf
Lavigne, P. (April 29, 2007). Biofuel industry branches out, outside investors flow in. Des Moines
Register. Des Moines, IA
McNew, K. and Griffith, D. (2005). Measuring the impact of ethanol plants on local grain prices.
Review of Agricultural Economics 27:2, pp. 164–180
Miranowski, J. (November 2006). Economic drivers of biofuels expansion. Cooperative Ex-
tension report, Iowa State University. Retrieved from />MIranowskiPresent.indd.pdf
Morris, D. (January 2007). Energizing rural America: Local ownership of renewable energy pro-
duction is the key. Institute for Local Reliance. Retrieved from ricanprogress.
org/issues/2007/01/pdf/rural
energy.pdf
78 D. Swenson
NASS (National Agriculture Statistical Service) (2007). Crop progress and condition
reports. U.S. Department of Agriculture. Retrieved from />Charts
and Maps/index.asp
NCBA (National Cattlemen’s Beef Association) (June 2007). Cattle producers urge equal
opportunity energy policy. NCBA News. National Cattlemen’s Beef Association. Cen-
tennial, CO. Retrieved from />BasedEthanolMandate31432.aspx
Novack N. (March 2002). The rise of ethanol in rural America. The Main Street Economist.Center
for the Study of Rural America, Federal Reserve Bank of Kansas City.
Swenson, D. (June 2006). Input outrageous: The economic impacts of modern biofuels produc-
tion. (Paper presented at the Mid-Continent Regional Sciences Association and the Bien-
nial IMPLAN Users Conference, Indianapolis, IN). Retrieved from tate.
edu/research/webpapers/paper
12644.pdf
Swenson, D. (Summer 2007a). Biofueling economic growth in Iowa. Small Farmer’s Journal. 32:2,
33–34.
Swenson, D. (April 2007b). Understanding biofuels economic impact claims. Department of
Economics Staff Report, Iowa State University. Retrieved from />research/webpapers/paper
12790.pdf
Swenson, D. and Eathington, L. (September 2006). Determining the regional economic values
of ethanol production in Iowa considering different levels of local investment. Department of
Economics Staff Report, Iowa State University. Retrieved from />bewg/Documents/eth
full0706.pdf
Tiffany, D. and Eidman, V.R. (August 2003). Factors Associated with success of fuel ethanol pro-
ducers. Staff Paper PO37. Department of Applied Economics. University of Minnesota
Tokgoz, S., Elobeid A., Fabiosa, J.F., Hayes, D.J., Babcock, B.A., Yu, T.S, Dong, F., Hart, C.E.,
Beghin, J.C. (May 2007). Emerging biofuels: Outlook of effects on U.S. grain, oilseed, and
livestock markets. Center for Agriculture and Rural Development, Iowa State University. Re-
trieved from />Ugarte, D., English, B., Jensen, K., Hellwinkel, C., Menard, J., Wilson, B. (2006). Economic
and agricultural impacts of ethanol and biodiesel expansion. Agricultural Economics Study
Report, University of Tennessee. Retrieved from />Ethanolagimpacts.pdf
Urbanchuck, J. (January 2005). Contribution of the ethanol industry to the economy of the United
States. Renewable Fuels Association. Retrieved from />documents/576/economic
contribution 2006.pdf
Urbanchuck, J. (February 2007). Contribution of the biofuels industry to the economy of
Iowa. Iowa Renewable Fuels Association. Retrieved from />%20Iowa%20Biofuels%20Economic%20Impact.pdf
USDA. (February 2007). Agricultural Projections to 2016. U.S. Department of Agriculture, Office
of the Chief Economist. OCE-2007-1. Retrieved from www.ers.usda.gov/publications/oce071/
USDA. (June 2007). U.S. farmers plant largest corn crop in 63 years. U.S. Department of Agricul-
ture Newsroom. Retrieved from />29 2007.asp
S. 1253 (June 15, 2005). Rural renaissance II act of 2005. Senate of the United States, 109th
Congress. Retrieved from />Westcott, P. (May 2007). Ethanol expansion in the U.S.: How will the agriculture sec-
tor adjust? Economic Research Service, U.S. Department of Agriculture. Retrieved from
/>WSTB (Water and Science Technology Board) (2004). Review of the U.S. Army Corps
of Engineers restructured upper Mississippi River-Illinois waterway feasibility study. Na-
tional Academy of Sciences. Washington, D.S. Retrieved from />php?record
id=10873#orgs
Chapter 4
Subsidies to Ethanol in the United States
Doug Koplow and Ronald Steenblik
Abstract Ethanol, or ethyl alcohol used for motor fuel, has long been used as a
transport fuel. In recent years, however, it has been promoted as a means to pursue a
multitude of public policy goals: reduce petroleum imports; improve vehicle emis-
sions and reduce emissions of greenhouse gases; and stimulate rural development.
Annual production of ethanol for fuel in the United States has trebled since 1999 and
is expected to reach almost 7 billion gallons in 2007. This growth in production has
been accompanied by billions of dollars of investment in transport and distribution
infrastructure. Market factors, such as rising prices for petroleum products and state
bans on methyl tertiary butyl ether (MTBE), a blending agent for which ethanol is
one of the few readily available substitutes, drove some of this increase. But the main
driving factor has been government support, provided at every point in the supply
chain and from the federal to the local level. This chapter reviews the major policy
developments affecting the fuel-ethanol industry of the United States since the late
1970s, quantifies their value to the industry, and evaluates the efficacy of ethanol
subsidization in achieving greenhouse gas reduction goals. We conclude that not
only is total support for ethanol already substantial — $5.8–7.0 billion in 2006 —
and set to rise quickly, even under existing policy settings, but its cost effectiveness
is low, especially as a means to reduce greenhouse gas emissions.
Keywords Agriculture · biofuel · corn · energy · ethanol · policy · renewable
energy · subsidies · support ·United States
D. Koplow
Earth Track, Inc., 2067 Massachusetts Avenue, 4th Floor, Cambridge, MA 02140
e-mail:
R. Steenblik
At the time of article submission, Director of Research for the Global Subsidies Initiative of the
International Institute for Sustainable Development, Maison Internationalle de l’Environment 2, 9,
chemin de Balexert, 1219 Ch
ˆ
atelaine Gen
`
eve, Switzerland
D. Pimentel (ed.), Biofuels, Solar and Wind as Renewable Energy Systems,
C
Springer Science+Business Media B.V. 2008
79
80 D. Koplow, R. Steenblik
Acronyms & abbreviations
AFV: alternative fuel vehicle
bgpy: billion U.S. gallons per year
mgpy: million U.S. gallons per year
CAFE: corporate average fuel economy
CBERA: Caribbean Basin Economic Recovery Act
CO
2
: carbon dioxide
CRS: Congressional Research Service
E10: a blended fuel comprised of 10% ethanol and 90% gasoline
E85: a blended fuel comprised of 85% ethanol and 15% gasoline
EIA: U.S. Energy Information Administration
EPA: U.S. Environmental Protection Agency
EPACT05: Energy Policy Act of 2005
FFV: flexible-fuel vehicle
GHG: greenhouse gas
GJ: gigajoule (10
9
joules)
GSI: Global Subsidies Initiative
IRS: Internal Revenue Service
JCT: Joint Committee on Taxation (of the U.S. Congress)
MPS: market price support
MTBE: methyl tertiary-butyl ether
NAFTA: North American Free Trade Agreement
OECD: Organisation for Economic Co-operation and Development
OTA: Office of Technology Assessment
RFA: Renewable Fuels Association
RFS: Renewable Fuels Standard
USDA: U.S. Department of Agriculture
VEETC: Volumetric Ethanol Excise Tax Credit
4.1 Introduction
The modern U.S. ethanol industry was born subsidized. The Energy Tax Act of
1978 introduced the first major federal subsidy for ethanol, a 4 cents-per-gallon
reduction in the federal excise tax on gasohol, or E10 (a blend of 10% ethanol and
90% gasoline). In that same year, the first commercial ethanol production capacity
came online. Between 1980 and 1990, production capacity more than quintupled,
ending the decade at around 900 million gallons per year (mgpy). Despite a slower
period of growth from the late 1980s through the mid-1990s, production capacity
has grown in recent years at a very fast pace over most of the last decade. According
to the Renewable Fuels Association (RFA) the main ethanol trade group, production
capacity increased from 1.7 billion gallons per year (bgpy) in 1999 to 7.3 bgpy
at the end of 2007 (RFA, 2007a). An additional 6.2 bgpy of capacity were under
4 Subsidies to Ethanol in the United States 81
construction, the vast majority of which will rely on corn (RFA, 2007b).
1
Mean-
while, the supply side of the ethanol market is evolving towards ever larger plants,
with the largest having annual capacities approaching 300 mgpy (Planet Ark, 2006).
This trend will have important effects both on feedstock supply and on the market
power of different portions of the supply chain.
Conversion into ethanol serves as an increasingly important outlet for the indus-
try’s main feedstock, corn. Estimates of the share of U.S. corn production used for
ethanol vary, but most place it above 20% in 2007, and likely to rise above 30%
within the next few years.
2
Despite rapid growth in demand and diversion of corn
into fuel, ethanol consumption for 2006 (5.4 bgpy) supplied less than 4% of the fuel
used by gasoline-powered vehicles in that year (Fig. 4.1).
3
Fig. 4.1 Fuel-ethanol production capacity
1
and output
2
in the United States, 1981 through 2007
1
Data for 2007 are authors’ estimates. Capacity data prior to 1999 are not available.
2
Capacity represents an estimated mid-year value, obtained by taking the geometric mean of the
values reported at the beginning of the year shown and the value at beginning of the following year.
Sources: • 1981–2005: Energy Information Administration, Annual Energy Review 2006, Report
No. DOE/EIA-0384(2006), Table 10.3, “Ethanol and Biodiesel Overview, 1981–2006”, Retrieved
December 7, 2007 from; • 2006: Renewable Fuels
Association; “Industry Statistics”, Retrieved December 7, 2007, from indus-
try/statistics/.
1
Sugar from cane or beets, which is an important feedstock in ethanol production in regions such
as Brazil and the European Union, has so far played a very small role within the United States.
This is largely due to import quotas that make sugar too expensive as a feedstock.
2
See FAPRI, (2007, February), p. 11; USDA (2007, February), p. 39.
3
Ethanol consumption data from RFA (2007c); US gasoline consumption data from EIA (2007b).
0.0
1.0
2.0
3.0
4.0
5.0
6.0
7.0
8.0
1981
1982
1983
1984
1985
1986
1987
1988
1989
1990
1991
1992
1993
1994
1995
1996
1997
1998
1999
2000
2001
2002
2003
2004
2005
2006
2007e
Billions of gallons per year
Capacity*
Production
82 D. Koplow, R. Steenblik
Industry promotion of expanded purchase mandates and continued protection
from imports demonstrate that producers are counting on the government to help
keep production viable. Both policies were being considered by Congress in the au-
tumn of 2007. Even more aggressive policy interventions have also been proposed,
such as setting a floor price for oil in order to protect the domestic ethanol industry
from low oil prices that would render ethanol uncompetitive (see, e.g., Lugar and
Khosla, 2006). Clearly, in order to understand the industry, one has to understand
the roll of government incentives.
This analysis draws heavily on two in-depth studies conducted for the Global
Subsidies Initiative (GSI) of the International Institute for Sustainable Development
(Koplow, 2006; 2007) which in turn form part of a multi-country effort by the GSI
to more thoroughly characterize and quantify subsidies to biofuels production, dis-
tribution and consumption.
4
This chapter first describes the evolution of government support for ethanol, fo-
cusing on the major federal programs. Thereafter follows a more detailed discussion
of federal and state support policies, arranged by their point of initial economic
incidence. Virtually every production stage of ethanol is subsidized somewhere in
the country; in many locations, producers can tap into multiple subsidies at once.
Liquid biofuels have been subsidized largely on the premise that they are domes-
tic substitutes for imported oil; that they reduce greenhouse gas (GHG) emissions;
and that they encourage rural development. Critics of subsidization have argued that
the production process of these fuels is itself fossil-fuel-intensive, obviating many
of the benefits of growing the energy resource; and that there are less expensive
options for both GHG mitigation and rural development. Although the most recent
work (Farrell et al., 2006a; Hill et al., 2006; U.S. EPA, 2007a) suggests some net
fossil fuel displacement when biofuels replace petroleum products, the gains remain
moderate, especially for corn-based ethanol. Others strongly contest these conclu-
sions (e.g., Patzek, 2004; Pimentel and Patzek, 2005). Importantly, as additional
analysis on modeling life-cycle impacts expands the parameters of assessment to
include nitrous oxide emissions from fertilization and associated land-use changes
from increased biofuel production, the net benefits of using ethanol produced from
dedicated starch crops are looking less positive.
The second part of this chapter provides a variety of quantitative metrics on sub-
sidy magnitude to illustrate how much support is being provided, not only per unit
of biofuel produced, but also in terms of greenhouse gas (GHG) reductions. These
values are intended to help in evaluating whether other options to diversify transport
fuels or mitigate climate change might be more cost-effective.
4.2 Evolution of Federal Policies Supporting Liquid Biofuels
Subsidization of ethanol production at the federal level began with the Energy Tax
Act of 1978. That Act granted a 4 cents-per-gallon reduction in the federal motor
fuels excise tax for gasohol, a blend of 10% ethanol and 90% gasoline, also called
4
A complete list of the GSI’s studies can be found at .
4 Subsidies to Ethanol in the United States 83
E10. This rate translates to 40 cents per gallon of pure ethanol at the time, and is
equivalent to about $1.00 per gallon in 2007 dollars. The excise tax subsidy rate
was adjusted frequently over the ensuing 25 years, until it was replaced by the
Volumetric Ethanol Excise Tax Credit (VEETC) in 2004. VEETC is financed by
general revenues, rather than through reduced collections for highway funding as
occurred with the original exemption.
The US Congress introduced additional measures to support the ethanol indus-
try in 1980. The Energy Security Act of 1980 initiated federally insured loans for
ethanol producers, and from 1980–86 alcohol production facilities could access tax-
exempt industrial development bonds (Gielecki et al., 2001). Also in 1980, Congress
levied a supplemental import tariff of 50 cents per gallon on foreign-produced
ethanol (RFA, 2005), which was increased to 60 cents in 1984 (Gielecki et al., 2001)
and now stands at 54 cents.
Several states also started to subsidize ethanol around this time. Minnesota intro-
duced a 40 cents per gallon ethanol blenders’ credit in 1980 (phased out in 1997),
as did North Dakota (Sullivan, 2006). A tally of state measures carried out by the
Congressional Research Service two decades ago (CRS, 1986) identified incentives
in place in 29 states. By 1986, state excise-tax exemptions alone were costing state
treasuries over $450 million per year (in 2007 dollars) in foregone tax receipts.
In 1988, federal legislation began addressing the consumption side of the alterna-
tive fuels market. The Alternative Motor Fuels Act passed that year provided credits
to automakers in meeting their Corporate Average Fuel Economy (CAFE) standards
when they produced cars capable of being fueled by alternative fuels (Duffield and
Collins, 2006).
5
Earning these credits did not require that the vehicles actually run
on the alternative fuels, and because so few vehicles have (somewhat less than
one percent of their mileage, according to a 2002 Report to Congress), the rule
has been estimated to have increased domestic oil demand by 80,000 barrels a day
(MacKenzie et al., 2005).
Environmental concerns have also helped improve the market position of biofu-
els. The Clean Air Act Amendments of 1990 mandated changes to the composition
of gasoline in an effort to address two specific air-pollution problems. Reformu-
lated gasoline was designed to help reduce ozone-forming hydrocarbons, as well as
certain air toxins in motor-vehicle emissions, and was prescribed for areas of the
country suffering the most-severe ozone problems. Oxygenated fuels were intended
for use in the winter, in certain metropolitan and high-pollution areas, in order to re-
duce emissions of carbon monoxide. An oxygen-increasing additive, or oxygenate,
was required to be added to these types of gasoline reformulations. However, the
Amendments did not specify any particular oxygenate (of which there are several)
for achieving these goals (Liban, 1997). Mandates to use ethanol for at least 30%
of the oxygenates needed to meet these requirements were promulgated by the U.S.
Environmental Protection Agency (EPA) in 1994 with the strong support of the
5
The Energy Policy Act of 1992 (EPACT92) formally established E85 as an alternative trans-
portation fuel. In addition, it established alternative-fueled-vehicle mandates for government and
state motor fleets, policies that have indirectly encouraged demand for ethanol fuels over time
(EIA, 2005a; Schnepf, 2007).