Biofuels, Solar and Wind as Renewable Energy Systems_Benefits and Risks Episode 2 Part 3 pot
Bạn đang xem bản rút gọn của tài liệu. Xem và tải ngay bản đầy đủ của tài liệu tại đây (713.5 KB, 25 trang )
288 E. Kessler
highest levels of government, it is often proclaimed that our problems will be solved
by research, even when the speakers have little knowledge of either science or its
natural limitations.
33
Much legislation provided by the political system in the United States is an ex-
change for financial contributions to campaigns. Will our system (and others, too)
remain inadequate to deal with the global warming and energy decline phenom-
ena? If it does remain inadequate, it will not be because the U.S. system is vastly
different than it used to be – although there has been concentration of control of
media by narrow interests, this control over news delivery has been somewhat off-
set by democratizing effects of the Internet. Historically, our political system has
frequently supported powerful groups that sacrifice the good of a large sector for
personal short-term benefits. This author thinks that the last times that populace and
government rose to needed heights was when the critical nature of conditions related
to WW II became more than obvious. And subsequent to WW II there was the good
Marshall Plan.
In the United States and elsewhere, many research programs are well funded.
As noted in a short article (Kessler, 1991), the political establishment is pleased to
provide the wherewithal, in part because the hope for favorable outcomes is a basis
for postponement of actions that are politically difficult to implement even though
they could be immediately effective. And, of course, research must be encouraged;
a plethora of research outcomes in every field of study are the principal basis for
our industrial and postindustrial worlds, and further highly favorable results seem
inevitable.
For example, a recent helpful outcome in Japan has produced light emitting
diodes (LEDs) that are about 50% efficient in their production of light from electri-
cal energy, and the cost of LED production is being reduced rapidly. LEDs may be
on track to replace both incandescent lights with efficiency about 5% and fluores-
cents, 25%. The U.S. Dept. of Energy has estimated that about 22% of electricity
production is devoted to lighting, so the new products may lead to both reduced CO
2
emissions and better lighting around the world, including in communities remote
from utility power (Ouellette, 2007).
Important developed differences between now and decades ago are more in the
nature of our times than in qualities of our political system. General demand has
risen and continues to rise with increasing world population, and some basic re-
sources that are essential to maintenance of infrastructure and provision of essen-
tials are not as plentiful as formerly and are more expensive to obtain. The immense
power of tools created by spectacular advances in science and technology means that
malfeasance in the application of those tools leads to increasingly harmful conse-
quences. Thus, private automobiles have provided unprecedented and very welcome
mobility to many, but they are still being promoted even though they are principal
contributors to carbon dioxide emissions and decline of liquid fuels. While products
33
Of course, some problems are solved by research, but many of the political pronouncements
about expectations from scientific research reflect more faith than science.
11 Our Food and Fuel Future 289
of advanced science and resultant technologies are essential to most of our daily
lives, many more people in the United States than in Europe seem to reject findings
and implications of science when those findings conflict with historical matters of
faith or call for specific short-term sacrifice for dimly-perceived benefits in the long
term.
Science and technology are seen as the major source of means for tapping the
wealth of Earth. To what extent may further advances lead to means for marked
reduction of our impacts? Such favorable developments will depend much more on
scientific guidance to research directions than on political guidance!
Geometrical orientations of Earth to Sun are projected to rule out global cooling
and recurrence of glaciations for another 30 thousand years, and this means that
global warming will continue inexorably unless emissions of greenhouse gases are
greatly diminished or there is an unexpected diminution of Solar radiation or ex-
tensive volcanism on Earth. Therefore, it may well be that within a few decades,
humans on Earth will have to accommodate powerful forces that will make early
adjustments seem easy by comparison. New problems may well include migrations
of millions of people forced to leave submerging habitats, shortages of water in
areas now dependent on glacial runoff, hotter summers, fluctuations of food supply
following intensified droughts and floods, and increased social unrest. There are
solutions to global warming problems, but none is easy, and most political systems
are inhibiting. Will we humans meet this immense challenge to our established ways
and cultures? Delay compounds difficulty and cost of solutions.
11.6 Conclusions
The United States has not yet a single program effective toward reduction of its
dependence on foreign sources for liquid fuels or toward mitigation of the loom-
ing disaster represented by global warming. If existing programs were effective,
we would expect that imports of petroleum products would be declining, but such
imports are continuing to increase. And the existing biofuels programs are already
damaging the agricultural economy. In large part, the programs in place are a con-
sequence of a political system whose legislation is too-much based on contributions
from the already rich and powerful, and insufficiently responsive to conditions and
findings from advanced and still burgeoning science and technology. Overall, the
situation is a consequence of the human condition, little changed during thousands
of years.
34
Such programs as improved insulation of existing houses, new construction of
“green” buildings, and facilitation of transportation alternatives such as bicycling,
are steps in right directions and have won grass-roots support, but all are far too
34
Characterized in part in Sophocles, “No thing in use by man, for power of ill, can equal money.
This lays cities low, this drives men forth from quiet dwelling-place, this warps and changes minds
of worthiest stamp, to deeds of baseness, teaching men all shifts of cunning, and to know the guilt
ofeveryimpiousdeed Bybaseprofitwon,youwillseemoredestroyedthanprospering ”
290 E. Kessler
small. The major programs, ethanol from corn and sugar cane and biodiesel from
palm oil, soybeans, and canola are deceptive responses. They provide short-term
profit to special interests and they do provide fuels, but even the aggregate amount
of fuels produced in these programs is a trivial proportion of present consumption
and, the production processes yield, at best, no net reduction of carbon dioxide emis-
sions. The alternative fuels programs damage the agricultural economy by causing
increases in the price of corn and other human foods and livestock feeds, losses of
already diminished habitat including tropical rainforests and wildlife, and losses of
topsoil and increased stress on water supplies.
As noted above, unless carbon dioxide emissions are quickly reduced, global
warming will be a very serious matter for future generations and will force large ad-
justments in ecosystems worldwide. Concern rises because in the United States and
in rapidly developing countries such as China and India, policies remain strongly
oriented toward economic and even physical growth with increasing emissions of
carbon dioxide.
What should be done in the United States, for example, beyond such programs
as tightening CAF
´
E
35
standards, weatherizing homes and utilizing energy-saving
construction in new work, installing solar heating, and expanding use of time-of-day
pricing of electricity, all of which are or would be good though inadequate? A proper
practical course is difficult to identify, and an effective course may be impossible to
identify. In other words, it may be too late to avoid serious damages from global
warming and to preserve social order in face of fuel declines. But, we must keep
trying, and it is clear enough that in order to confront consequences of global warm-
ing and decline of liquid fuels, societies in developed (and developing) countries
must practically be turned on their heads! And if they do not turn themselves soon,
they will be turned later by large forces beyond human control.
As a first step, the notion of continuous economic growth must be abandoned,
36
and global population, which has increased threefold in your author’s lifetime, must
be much reduced. Whatever else is done, if population growth proceeds, all other
saving actions will be nullified and even overwhelmed owing to increased demand.
Abplanap’s succinct statement (1999) applies, necessary changes being made, to
physical growth of many entities in the presence (or absence) of technological
advances: “ Anykindofagricultural‘greenrevolution’whichisnotaccompanied
by effective population control merely resets the limiting parameters at higher levels
and enables countries with a large proportion of starving citizens to increase the
absolute numbers of starving people”.
Is population reduction feasible? Population is sustained with an average birth
number near 2.1 per female inhabitant. If this average were reduced to 2.0 the impact
on individuals would be very minor but the eventual impact on world population
would be major. If world population were to decline just one percent per year,
35
Corporate Average Fuel Economy, i.e., average automotive mileage as mandated by federal
legislation.
36
And replaced by increased learning, cultural growth, equity and justice. A tall order!
11 Our Food and Fuel Future 291
numbers would be reduced by half in 70 years and again by half in another 70.
In 2007, this must be seen as only a utopian dream, since the large proportion of
young people in the present world population guarantees substantial growth of the
global population in the near term.
37
Further, strong diverse forces, even the U.S.
government at this writing, offer little or no support for birth control,
38
and Cham-
bers of Commerce all across America promote growth among the highest of their
priorities. Of course, population matters are very different in different economies,
demographies, and cultures, and associated problems, including treatment and edu-
cation of females, are not explored here.
39
Second, it would be helpful in the United States to have a massive shift in funding
from highway building to construction of a national rail system for both passenger
travel and improved freight transport. Such a system, emulating that already in place
and still under rapid development in Europe and somewhat too in Asia, would be
inherently more energy efficient than automobiles and truck travel on highways, and
even further emission reductions would be achieved to the extent that trains become
more fueled with electricity from overhead wires or from liquefied natural gas in
place of diesel fuel.
Such a transportation alternative in the U.S. might be paid for in part by an in-
creased federal tax on gasoline and diesel fuels. If rail were more emphasized, U.S.
highways would be less burdened with cars and trucks, highway maintenance costs
would decline, and emissions of carbon dioxide and health-threatening gases from
the automotive sector in this leader country would decline. And decline of truck
traffic would quicken if trucks were taxed in relation to the maintenance costs they
impose – road damage is proportional to the fifth power of axle weight.
40
Groups
of citizen-activists are working in these directions, but during 2007 in the United
States, there is little official interest in such programs – indeed, such programs lack
substantial support from the federal level in the United States and are opposed by
highway and automotive lobbies. In 2007 there is still strong political support toward
expansion of the highway system.
Third, further enhancement of already burgeoning communication technologies
may proceed to a level that somewhat reduces energy-consumptive travel.
The three items above could be resource-conserving approaches in a relatively
short term. But for true sustainability in terms of geological age, we should, barring
success with nuclear fusion as a source of electrical energy, begin to explore devel-
opment of a very broad solar economy, because only solar energy is projected to
endure much as at present for billions of years. This means that solar power plants
would be built with help from fossil or nuclear fuels to support an economy with
37
Barring more serious war or pestilence, of course.
38
China has learned the hard way, and brutality properly opposed is a sometime component of
birth control efforts in China, but the United States government declines to acknowledge the seri-
ousness of population numbers even when those numbers strain the food supply.
39
Nor have we discussed abatement of terrorism and war and spread of justice internationally.
40
In Oklahoma, the tax on diesel fuel as this document is prepared is three cents/gallon less than
on gasoline.
292 E. Kessler
fewer human numbers indefinitely, and the solar power would be used to maintain
and enhance the power system itself. This vision of a farther future is mentioned
by Patzek on his website and a possible solar path has been detailed by Zweibel,
et al. (2008).
So, in summary, What is our food and fuel future? It is highly problematic, and a
decent future for humans is much dependent on rationalization of decision-making
at all levels to findings and implications of science and technology! The rapid pace
of change in this 21st century also calls for a much more rapid response of proper
decision making to major findings of science and technology.
Will humanity on Earth be a “flash in the pan”? Consider a 30-volume ency-
clopedia, each volume with one thousand pages, each page with an average one
thousand words. Let these thirty volumes present a linear history of Life on Earth
since multi-celled organisms became prevalent perhaps one billion years ago, with
the start of accumulation of the fossil fuels that we humans use today. How much
space is devoted to the sixty-five years since World War II, during which we humans
have extracted about half of Earth’s readily extractable liquid fossil fuels and much
coal, and caused an astonishing increase in atmospheric content of carbon dioxide?
Is the answer disturbing? Only two words on the last page of the last volume! How
long will we endure and how much space might describe our future post-industrial
society?
Acknowledgments Thanks to Marjorie Bedell Greer and Richard Hilbert for suggestions based
on their readings of an early typescript, to Hilbert and to Charles Wright for sociological insights
and to Tom Elmore for imparting some of his encyclopedic knowledge of the railroad history
of Oklahoma. David Sheegog contributed to the discussion of ethanol, and Steve Shore helped
with the table in Section 11.4. Before semi-retirement, Dr. Greer was a professor of anatomy at
the Oklahoma University Health Sciences Center in Oklahoma City, Dr. Hilbert was Chair of the
Sociology Dept. at the University of Oklahoma in Norman, and he continues to lecture, and Charles
Wright is an attorney and sociologist. Tom Elmore is Executive Director of the North American
Transportation Institute, Moore, Oklahoma, David Sheegog is a psychologist and rancher, and
Steve Shore is a professor of chemistry at Oklahoma City Community College. Thanks also to
David Pimentel for several important suggestions.
References
Abplanap, P. L. (1999). A letter to Technology Review, Sept–Oct.
American Wind Energy Association (2007). retrieved August 28,
2007.
Anthony, R. (2007). Safe at Sea, Spectrum, Massachusetts Institute of Technology, XVIII, X, 17.
Apricus.com (2007) See this webpage, , Retrieved Dec. 3, 2007.
Bullis, K. (2006). Abundant Power from Universal Geothermal Energy, http://www/ technologyre-
view.com/Energy/17236/, retrieved Oct. 11, 2007
Castro, F. R. (2007). The Internationalization of Genocide, Granma Internacional, April 3.
Center for Rural Affairs. (2007). Monthly Newsletters from P.O. Box 136, Lyons, Nebraska
68038–0136.
Clery, D. (2006). ITER’s $13 Billion Gamble, Science, 314, 5797, 238–242.
Congressional Research Service (2005). Alcohol Fuels Tax Incentives, CRS Order Code RL2979.
11 Our Food and Fuel Future 293
Crabtree, G. W., Dresselhaus, M., & Buchanan, M. V. (2004). The Hydrogen Economy. Physics
Today, 57, 12, 39ff.
Crabtree, G. W. & Lewis, N. S. (2007). Solar Energy Conversion. Physics Today, 60, 5, 37–42.
Duncan, M. & Webb, K. (1980). Energy and American Agriculture. From the Research Division
of the Federal Reserve Bank of Kansas City, U.S.A., Thomas E. Davis, Senior Vice President.
41pp.
Environmental Protection Agency. (2007). National Lake Fish Tissue Study, Retrieved 1 Sept. and
earlier from www.epa.gov/waterscience/fishstudy/. (Much detail has been available on the web
sites, and your author has been told that a formal summary report is in review and may be
available during 2008.)
E&P. (2007). Coalbed Methane, 80, 6, 41–55. (A series of presentations on new and developing
technologies). (E&P = Exploration and Production, from Hart Energy Publishing, 1616 S. Voss
Road, Houston, Texas, 77057.)
Ghazvinian, J. (2007). Untapped – The Scramble for Africa’s Oil. (New York, Harcourt) 320pp.
Hansen, J., Sato, M., Kharecha, P., Russell, G., Lea, D. W., & Siddall, M. (2007). Climate Change
and Trace Gases. Philosophical Transactions of the Royal Society A, 1925–1954.
H
¨
aring, M.O., Ladner, F., Schanz, U., & Spillmann, T. (2007). Deep Heat Mining Basel, Pre-
liminary Results. Retrieved August 5, 2007 from website: down-
loads/dhm
egc300507.pdf
Hart Energy Publishing. (2006). Unleashing the Potential of Heavy Oil. A supplement to E & P
Oil and Gas Investor (Principally a description of facilities and investments in the tar sands of
Alberta, Canada.) 1616 S. Voss, Ste 1000, Houston, Texas 77057.
Hart Energy Publishing. (2007). Unleashing the Potential of Heavy Oil. A supplement to E & P
Annual Reference Guide (A discussion of new technologies.) 1616 S. Voss, Ste 1000, Houston,
Texas 77057.
Hinze, W. J., Marsh, B. D., Weiner, R. E., & Coleman, N. M. (2008). Evaluating Igneous Activity
at Yucca Mountain. EOS, 89, 4, 29–30.
Intergovernmental Panel on Climate Change. (2007). Numerous reports available on the Internet,
/>Kahn, J. & Yardley J. (2007). As China Roars, Pollution Reaches Deadly Extremes, The New York
Times, August 26.
Kessler, E. (1991). Carbon Burning, the Greenhouse Effect, and Public Policy, Bulletin of the
American Meteorological Society, 72, 4, 513–514.
Kessler, E. (2000). Wind power over central Oklahoma, Report prepared for the Bergey Wind
Power Company, Norman, Oklahoma. 2000, x + 25 pp. + 46 figures. January.
Kessler, E. & Eyster, R. (1987). Variability of wind power near Oklahoma City and implications
for siting of wind turbines. Final Report on DOE Interagency Agreement No. DE-A1-6-81RL
10336. Pacific Northwest Laboratory, Richland, Washington. September, 74 pp. + appendices.
[This report was reprinted by the Oklahoma Climatological Survey, Norman, Oklahoma, in
1994 in a condensed format with small editorial adjustments and some additional notes.]
Komar, P.D. (2007). Higher Waves Along U.S. East Coast Linked to Hurricanes. EOS, 88, 30, 301.
Lagercrantz, J. (2006). Ethanol Production from Sugar Cane in Brazil. Retrieved August 10, 2007,
from />376&FILE
ID=20060511084611.pdf.
Mao, W. L., C. A. Koh, & E. D. Sloan. (2007). Clathrate hydrate under pressure, Physics Today,
60, 10, 42–47.
Marland, G., T.A. Boden, & R.J. Andres. (2005). Global, Regional, and National Fossil Fuel CO2
Emissions, Carbon Dioxide Information Analysis Center, Oak Ridge National Laboratory, U.S.
Department of Energy, Oak Ridge, Tenn., U.S.A.
Mayes, J. (2007). Warmest 12 months in British Isles instrumental records, Weather, 62, 4, 86.
McCain, J. (2003). Statement of U.S. Senator John McCain on the Energy Bill. (November 21st).
National Academy of Sciences. (2007). Water Implications of Biofuels Production in the United
States. October, 86pp. Summaries and the complete report are available on the Internet:
/>294 E. Kessler
NOAA (U.S. National Oceanic and Atmospheric Administration). (2007). .
noaa.gov/map/images/rnl/sfctmpmer
01b.rnl.html
Oklahoma Mesonet (2007). />Oklahoma Wind Power Initiative (2007). />Ouellette, J. (2007) White LEDs poised for global impact. Physics Today, 60, 12, 25–26.
Pimentel, D., Patzek, T. W. & Gerald, C. (2006). Ethanol Production: Energy, Economic, and
Environmental Losses. Reviews of Environmental Contamination & Toxicology, 189, 25–41.
Pennisi, E. (2007). Replace Genome gives Microbe new identity. Science, 316, 5833, 1827.
Roach, W. T. (1998). Can Geothermal Heat Perturb Climate? Weather, 53, 1, 11–19.
Schneider, D. (2007a). Coal Futures. American Scientist, 95, 4, 314–315.
Schneider, D. (2007b). Who’s Resuscitating the Electric Car? American Scientist, 95, 4, 403–404.
Shady Point. (2007). Retrieved October 17, 2007: o/
project
specific.php?project id=22
Shapouri, H., Duffield, J. A. & Wang, M. (2002). The Energy Balance of Corn Ethanol: An Update.
United States Department of Agriculture (USDA), Agricultural Economic Report Number 813.
Simmons, M. R. (2005). Twilight in the Desert. (New York, Wiley) 428pp.
Special Section: Sustainability and Energy (2007). Science, 315, 5813, 781–813.
Srivastava, R. K., Hutson, N., Martin, B., Princiotta, F., & Staudt. J. (2006). Control of Mercury
Emissions from Coal-fired Electric Boilers. Environmental Science and Technology, March 1,
1385–1391.
Trade Commission of Spain (2007). Solar Energy in Spain. Technology Review, 110, 5, S1–S10.
Tyner, G., Sr. (2002). Net Energy from Nuclear Power. Retrieved April 3, 2007 from Min-
nesotans for Sustainability website: />tyner g net energy
from nuclear power.htm
Tyner, G., Sr. (2002). Net Energy from Wind Power. Retrieved April 3, 2007 from Minnesotans for
Sustainability website: />tyner g net energy.htm
Vago, S. (1981). Law and Society (Englewood Cliffs, New Jersey, Prentice Hall) xi + 372pp. (See
esp. pp. 132–135)
Wallace, Linda, L. (2007). Switchgrass is no energy panacea. Essay in The Norman Transcript, on
Page 4, October 11, and personal conversation. Prof. Wallace is with the Dept. of Botany and
Microbiology at the University of Oklahoma, Norman.
Weiskel, T. C. (1990). The Need for Miracles in the Age of Science. Harvard Divinity Bulletin,
XX, 2.5ff.
Zweibel, K., Mason, J., & Fthenakis, V. (2008). A Solar Grand Plan. American Scientist, 298, 1,
64–73.
Chapter 12
A Framework for Energy Alternatives: Net
Energy, Liebig’s Law and Multi-criteria
Analysis
Nathan John Hagens and Kenneth Mulder
Abstract Standard economic analysis does not accurately account for the physical
depletion of a resource due to its reliance on fiat currency as a metric. Net energy
analysis, particularly Energy Return on Energy Investment, can measure the bio-
physical properties of a resources progression over time. There has been sporadic
and disparate use of net energy statistics over the past several decades. Some anal-
yses are inclusive in treatment of inputs and outputs while others are very narrow,
leading to difficulty of accurate comparisons in policy discussions. This chapter
attempts to place these analyses in a common framework that includes both energy
and non-energy inputs, environmental externalities, and non-energy co-products.
We also assess how Liebig’s Law of the minimum may require energy analysts to
utilize multi-criteria analysis techniques when energy may not be the sole limiting
variable.
Keywords Net energy · EROI · EROEI · liebig’s law · ethanol · biophysical
economics · oil · natural gas
12.1 Introduction
Human energy use, ostensibly the most important driver underpinning modern so-
ciety, may soon undergo a major transition of both kind and scale. Though numer-
ous energy technologies are touted as alternative supplies to fossil fuels, scientists
and policymakers continue to lack a meaningful and systematic framework able to
holistically compare disparate energy harvesting technologies. Net energy analysis
attempts to base decisions largely on physical principles, thus looking a step ahead
N.J. Hagens
Gund Institute for Ecological Economics, University of Vermont, 617 Main St., Burlington, VT
05405, USA
e-mail:
K. Mulder
Green Mountain College, Poultney VT, USA
D. Pimentel (ed.), Biofuels, Solar and Wind as Renewable Energy Systems,
C
Springer Science+Business Media B.V. 2008
295
296 N.J. Hagens, K. Mulder
of political and/or market based signals distorted by fiat monetary data. The im-
portance of net energy has been overlooked, primarily as a result of confusing and
conflicting results in energy literature. In this chapter, we (a) provide an introduction
to the history, scale and scope of human energy use (b) reiterate the role of net
energy analysis in a world of finite resources, (c) establish a two dimensional net
energy framework synthesizing existing literature and (d) illustrate (via the example
of corn ethanol) why multi-criteria analysis is important when energy is not the only
limiting variable.
12.2 Net Energy Analysis
Energy, along with water and air, completes the trifecta of life’s most basic needs.
Organisms on the planet have a long history of successfully obtaining and using
energy, mostly represented as food. Indeed, some have suggested that the har-
ness of maximum power by both organisms and ecosystems from their environ-
ments is so ubiquitous it should be considered the Fourth Law of Thermodynamics
(Odum 1995). Cheetahs, to use one example, that repeatedly expend more energy
chasing a gazelle than they receive from eating it will not incrementally survive to
produce offspring. Each iteration of their hunting is a behavior optimized to gain
the most energy (calories in) for the least physical effort (calories out), thus freeing
up more energy for growth, maintenance, mating and raising offspring. Over evolu-
tionary time, natural selection has optimized the most efficient methods for energy
capture, transformation, and consumption. (Lotka 1922) This concept in optimal
foraging analysis extrapolates to the human sphere via net energy analysis, which
seeks to compare the amount of energy delivered to society by a technology to the
total energy required to transform that energy to a socially useful form. Biophysical
minded analysts prefer net energy analysis to standard economic analysis when as-
sessing energy options because it incorporates a progression of the physical scarcity
of an energy resource, and therefore is more immune to the signals given by market
imperfections. Most importantly, because goods and services are produced from the
conversion of energy into utility, surplus net energy is a measure of the potential to
perform useful work for social/economic systems.
12.3 An Introduction to EROI – Energy Return on Investment
Knowing the importance of energy in our lives, how do we compare different en-
ergy options? Unfortunately, the word ‘renewable’ does not automatically connote
‘equality’ or ‘viability’ when considering alternatives to fossil fuels. In assessing
possible replacements for fossil fuels, each alternative presents special trade-offs
between energy quantity, energy quality, and other inputs and impacts such as land,
water, labor, and environmental health (Pimentel et al. 2002, Hill et al. 2006). When
faced with these choices, energy policymakers in business and government will
12 A Framework for Energy Alternatives 297
require a comprehensive and consistent framework for accurately comparing all
aspects of an alternative fuel.
Many criteria have historically been used to assess energy production tech-
nologies based on both absolute and relative yields and various costs (Hanegraaf
et al. 1998). Many assess economic flows (e.g. Bender 1999, Kaylen 2005) while
others focus on energy (e.g. Ulgiati 2001, Kallivroussis et al. 2002, Cleveland 2005,
Farrell et al. 2006) or emissions (e.g. EPA 2002). With the recent acceptance of
global climate change as a problem, energy analyses favoring low greenhouse gas
emissions are becoming more frequent (Kim and Dale 2005, Chui et al. 2006).
Though not yet widely accepted by market metrics, some other analyses have
attempted to include environmental and social inputs as well as energy costs.
(e.g. Giampietro et al. 1997, Hanegraaf et al. 1998, Pimental and Patzek 2005,
Reijnders 2006).
The objective of an energy technology is to procure energy. A common mea-
sure combining the strength/quality of the resource with its procurement costs is
the ratio of energy produced to energy consumed for a specific technology/source.
This concept has many labels in energy literature including the energy profit ratio
(Hall et al. 1986), net energy (Odum 1973), energy gain (Tainter 2003), and energy
payback (Keoleian 1998). In this chapter, we focus on Energy Return on Investment
(EROI) (Hall et al. 1986, Cleveland 1992, Gingerich and Hendrickson 1993) EROI
is a ratio and is equal to ‘net energy +1’. Total energy surplus is EROI times the
size of the energy investment, minus the investment. We will use the terms energy
gain, net energy and EROI interchangeably, throughout this chapter.
12.4 Humans and Energy Gain
Ancestral humans first major energy transformation came from the harnessing of
fire, which provided significant changes to daily tribal life by providing light,
warmth and eventually the ability to work metals, bake ceramics, and produce tools.
(Cleveland 2007). More recently, the energy gain of agriculture further transformed
human culture. Though the per unit energy gain of widespread agriculture was actu-
ally lower than many hunting and gathering practices, a large amount of previously
unused land was brought under cultivation, thus freeing up substantially larger en-
ergy surplus for society as a whole. (Smil 1991) This is a first example of how an
energy return combines with scale to determine an overall energy gain for society.
Much more recently, the development of the steam engine catapulted mankind into
the fossil fuel era by leveraging the embodied energy in coal deposits. The high
energy gain of coal rippled its way through the economy akin to a deposit in a
fractional banking system, and the industrial revolution had its first power source.
In the 19th century, modern humans learned to unlock the hydrocarbon bonds in the
higher quality fossil fuels of crude oil and natural gas, freeing up orders of magni-
tude more energy than our evolutionary forbears even dreamed about. The changing
size of this subsidy, how to measure it and meaningfully compare it to potential
298 N.J. Hagens, K. Mulder
Fig. 12.1 Composition of US energy by (Cleveland 2007)
energy substitutes that will be required to power future society is the subject of this
chapter (Fig. 12.1).
12.5 Current Energy Gain
The current scale of our energy gain is unprecedented. When coal, oil and natu-
ral gas are included, the average American uses 57 barrel of oil equivalents per
year (BP 2005). Each barrel of oil contains 6.1178632 ×10ˆ9 Joules of energy. An
average man would need to work about 2.5 years to generate this amount of heat
work
1
. Multiply it by 57, and the average American uses a fossil fuel subsidy equal
to over 150 annual energy slaves. But the quality of oil is also fantastic – liquid at
room temperature and highly dense – oil possesses energy quality that human labor
cannot.
An important nuance underlying the concept of net energy analysis, is that fossil
fuel production is itself cannibalistic, as oil production uses a great deal of natural
gas (and some oil) to procure. Coal production, wind turbine creation, solar photo-
voltaic panels, etc. all require liquid transportation fuels to generate their products
1
An ‘average’ worker utilizes 300 calories per hour. At 8 hours per day, 5 days per week and 50
weeks per year this is 600,000 calories per year. (6.1178632 ×10ˆ9 Joule) per barrel / (600,000
Calories ×4,184 joules required work energy per year) = 2.44 years/barrel.
12 A Framework for Energy Alternatives 299
in a modern economy. In fact, over 90% of world transportation is accomplished
using liquid fuels. (Skrebowski 2006).
The scale of remaining recoverable crude oil is a topic under much debate, with
many analysts saying we are already past peak production (Deffeyes), and others
(IEA, Cambridge Energy Research Associates) saying we will reach a broad plateau
by 2030–2040. A large number of analysts believe a peak in oil production will
occur sometime in the next decade. However, few if any of these analysts look at
how much of future oil and gas production nets down to the societal use phase after
the energy costs have been accounted for. Nor is there a distinction made in ‘crude
oil’ statistics between actual crude oil, ethanol, coal-to-liquids, etc. all of which not
only have disparate energy costs, but different BTU contents as well.
The Hubbert curve of resource extraction is roughly Gaussian in shape, and
the energy surplus (or lack thereof) drops down dramatically after its peak (see
Hall et al., 1986 for an example on Louisiana). If oil is peaking soon, asking how
much is still in the ground is not the most important question. How much can be
brought to market at one time? How much energy is left after energy companies use
what they require internally to procure the harder to find, deeper, more sulfurous,
more environmentally and socially sensitive drilling locations, etc.? These questions
ultimately address how much of our remaining fossil resources will be available for
non-energy, non-government society.
12.6 An Energy Theory of Value
There is a rich history over many decades of the concept of an energy theory of
value, dating back to Howard Scott and the Technocrats who stated that ‘A dollar
may be worth – in buying power – so much today and more or less tomorrow,
but a unit of heat is the same in 1900, 1929,1933 or 2000’ (Berndt 1983). In the
1970s, Senator Mark Hatfield argued that ‘Energy is the currency around which
we should be basing our economic forecasts, not money supply.’ His efforts re-
sulted in the passing of (now defunct) Public Law 93.577 which stipulated that all
prospective energy supply technologies considered for commercial application must
be assessed and evaluated in terms of their ‘potential for production of net energy’.
(Spreng 1988) And in a still broader sense, ecological analysts have long stated that
money does not properly account for externalities – ecologist Howard Odum stated
‘Money is inadequate as a measure of value, since much of the valuable work upon
which the biosphere depends is done by ecological systems, atmospheric systems,
and geologic systems.’
12.7 Why is Net Energy Important?
This ‘work’ Professor Odum alluded to requires an energy surplus. (Odum 1994) In
a world where energy is likely to become scarcer, net energy analysis is more for-
ward looking than conventional economic analysis, and as such can be an important
300 N.J. Hagens, K. Mulder
tool for policymakers. Net energy is important because we need energy to accom-
plish work. The surplus energy of a system, or society, is what allows it to continue
growth, maintenance, repair and leisure. Energy technologies can be stock or flow
based. Stocks are depletable and non-renewable on human time scales. Flow-based
resources are renewable, provided the infrastructure that supports them is renew-
able. There is only so much low entropy energy present in fossil fuel stocks and
solar/tidal flows that can be accessed at a meaningfully positive energy return. If
society has collectively become dependent on a certain aggregate energy gain sys-
tem and attempts to replace it with a lower energy gain portfolio, while keeping
all other inputs equal, then a larger % of societies resources (labor, capital, land,
water, etc) would have to be devoted to energy procurement, leaving less available
for hospitals, infrastructure, science, etc.
So in one sense, the Energy Return on Investment is a story of demand, and how
a civilization uses their BTU endowments. A doubling in efficiency of use, or a
doubling of conservation efforts, are equivalent to a doubling of an energy surplus.
But if efficiency and conservation do not occur, we are left trying to maintain a
high gain system from new energy supply as original stocks of resources deplete.
Historian Joseph Tainter has shown, with both examples from the animal kingdom
and historical human societies (Rome), that high energy gain systems undergo social
upheaval and ultimately collapse if they cannot maintain the energy gain that their
infrastructure is built upon (Tainter 2003). The more energy required to harvest,
refine and distribute energy to society, (assuming we’re at maximum scale), the less
will be left over for non-energy sectors. This is especially important in a society that
has built its infrastructure around high-energy-return inputs (Smil 1991). Our mod-
ern situation, the energy density required for our shopping centers, hospitals, high
rises, etc. is orders of magnitude higher than that of biomass and other renewables.
(Smil 2006).
12.8 Net Energy and Energy Quality
In a human system, the desirability of a resource derives both from its absolute en-
ergy gain as well as from its utility to a unique sociocultural system. (Tainter 2003)
Thermal energy quantity is important from a thermodynamic standpoint. However,
a human society does not use or value energy based on its heat component alone.
Prehistoric man would have viewed a horse as a source of meat, not as an animate
converter of cropland or as a riding steed. Similarly, an ancient Yibal tribesman
in Saudi Arabia would have little use for the high energy density oil bitumen just
under the sands surface, but enormous use for the energy conversion capacity of
a healthy horse. Today’s shopping centers and hospitals could not be powered by
meat calories or horsepower, but require the dense energy concentrated in fossil
fuels. Thus, energy quality is a definition dependent on the context of a society.
When Watt was developing his steam engine, the heat value and liquid form of
petroleum were of little use, because the new technologies of that day required wood
12 A Framework for Energy Alternatives 301
or coal. And, unlike other mammals, humans have evolved to utilize exosomatic
energy, and build and expand society around specific inanimate converters, earlier
the steam engine and more recently the internal combustion engine. In this fashion,
energy ‘quality’, as defined by an energy sources ability to perform economic or
other work valued by society, can and does depart from a straight thermal assessment
of the energy. Coal does not make a refrigerator work, and natural gas does not have
the density to run a computer printer; these fuels must first be transformed into
higher quality energy, at a thermal loss.
When assessing the quality of an alternative energy, the following factors need
to be considered: energy power and density, timing, energy quality, environmental
and social impacts of energy procurement and use, geographic and spatial scales,
volatility, and the potential scale of the resource (energy surplus). We will now
briefly discuss this first set of objective energy quality criteria. The majority of the
chapter will deal with the penultimate societal energy metric; the scale of the energy
surplus, and its EROI.
Energy density refers to the quantity of energy contained per unit mass or vol-
ume. The lower energy density of biomass (12–15 MJ/kg) compared to crude oil
(42 MJ/kg) means that replacing the latter with the former will require a larger
infrastructure (labor, capital, materials, energy) to produce an equivalent quantity
of energy. (Cleveland 2007) The energy carrying molecule hydrogen, has very low
energy per unit volume, creating many technical hurdles to a ‘hydrogen economy’,
even were cheap abundant hydrogen fuel stocks available.
Due to the enormous amount of geologic energy invested in their formation,
fossil fuel deposits are an extraordinarily concentrated source of high-quality en-
ergy, commonly extracted with power densities of 100 to 1000 Watts/m
2
for coal
or hydrocarbon fields. (Cleveland 2007). This implies that very small land areas are
currently used to supply enormous energy flows. In contrast, biomass energy pro-
duction has densities well below 1 Watt/m
2
, while densities of electricity produced
by water and wind are commonly below 10 Watt/m
2
. In effect, as power dense fossil
resources deplete, less power dense energy must be secured from more of the earth’s
surface to match the gross amount available from the concentrated high-gain sources
(Smil 2006).
Bioenergy made from annual crops will also undergo unexpected volatility from
periodic droughts or floods, whereas oil production can provide gasoline and its
energy services continuously (or at least until a well runs dry). On a shorter time
scale, the intermittency (or fraction of time that an energy source is usable to soci-
ety), is low for wind and solar technologies as neither the sun nor the wind give us
energy twenty four hours a day. This is potentially important with modern electricity
generation systems that need to combine power generated from multiple sources and
locations to supply electricity ‘24/7.’ A derivative concept of intermittency is the
dispersion over time of a source. In economics and finance, investors care greatly
about the ‘shape’ of portfolio returns. A portfolio returning 10% consistently is
much preferred to an investment that averages 15% but has periodic negative years.
In effect, investors preferences are measured by a ‘risk adjusted return’ which is the
mean return divided by the standard deviation. Energy too, has a risk adjusted return,
302 N.J. Hagens, K. Mulder
and constantly flowing and storable fossil fuels have built a society that depends
on smooth flows of energy services. Going back to ecosystem services to procure
energy may have higher standard deviations of energy availability.
All natural resources show distinct geographical gradients. In the case of oil and
natural gas more than 60% of known resources are in the Middle East. Just as with
stored ancient sunlight, renewable energy from current sunlight (solar, wind, etc.)
is geographically diffuse. This implies that significant investments (of dollars and
energy) into new infrastructure will be required to concentrate, store and distribute
energy over distance in order to procure useful amounts of energy services to human
population centers.
Historical human energy transitions occurred when the human population was
small, and had technology that was much less powerful than today. Environmen-
tal impacts associated with energy occurred locally but did not exhibit the cur-
rent global impact. But the future of energy and the environment are linked,
as there are numerous ecological constraints. Our future energy systems must
be designed and deployed with environmental constraints that were absent from
the minds of the inventors of the steam engine and internal combustion engines
(Cleveland 2007).
12.9 Energy Return on Investment – Towards a Consistent
Framework
Though all of the above are important factors in assessing renewable energy tech-
nologies, perhaps the most critical metric is the actual size of energy surplus freed
up for society. Once an energy output becomes truly scarce – large sums of dollars
won’t improve its scarcity, and all the dollars in the world wont change (quickly) the
demand system and energy infrastructure dependent on its energy gain. High energy
gain can arise from using a resource that is of high intrinsic quality but untapped, or
from technological development that allows an increase in the net energy of a pre-
viously used resource. The energy gain of mining deep coal, for example, increased
greatly after Watt’s engine was widely used (Wilkinson 1973). Conversely, energy
gain can decline from exploiting a resource that can yield only small returns on
effort under any technology, or from having depleted the most accessible reserves
of a once abundant resource (Tainter 2003).
Energy Return on Investment (EROI) is an oft-confused controversial but impor-
tant cousin to energy gain. EROI is basically a combined measure of how high of
quality/density the original energy source is with the energy cost that the composite
of harvesting technologies uses to deliver the energy to the consumptive stage. EROI
is strictly a measure of energy and its ‘harvesting’ costs in energy terms, not the
efficiency of its use or it’s transformation to another energy vehicle. For example,
once coal is procured out of the ground at a particular energy return, the decision,
and subsequent efficiency loss to turn it into electricity or Fischer-Tropsch diesel, are
both part of the consumption choices of society after the primary fuel is obtained.
12 A Framework for Energy Alternatives 303
The efficacy of EROI analysis is limited by one of its basic assumptions—that
all forms of energy are fungible with a statistic determined by their thermal content
(Cleveland 1992). This ignores the fact that the quality of an energy source can be
the key determinant of its usefulness to society. A BTU of electricity is of higher
value to society than a BTU of coal, a fact reflected by the price differential between
these two energy sources as well as our willingness to convert coal into electricity
at a significant energy loss. Some would argue that a technology with a low EROI
should be given stronger consideration if the energy outputs have a higher quality
than the energy inputs—an argument raised by Farrell et al. (2006) in support of
corn ethanol which has the potential to convert coal and corn (low quality) into a
liquid fuel (high quality). Cleveland (1992) has proposed a variant of EROI method-
ology that incorporates energy quality. Quality-adjusted economic analysis can even
support sub-unity EROI energy production depending on context.
The EROI concept has been specifically used in only a small percentage of na-
tional energy analyses, but is implicit in any study that uses a form of net energy as
a criterion. Recently it was used as a synthesizing concept for multiple comparisons
of biofuels (Farrell et al. 2006, Hammerschlag 2006). It has been used to exam-
ine nuclear energy (Tyner et al. 1988, Kidd 2004), ethanol (Chambers et al. 1979,
Pimentel 2003, Hu et al. 2004, Farrell et al. 2006, Hammerschlag 2006), other bio-
fuels (Baines and Peet 1983, Giampietro et al. 1997, Kallivroussis et al. 2002),
wood energy (Baltic and Betters 1983, Potter and Betters 1988, Gingerich and
Hendrickson 1993), and other alternative energies (Crawford and Treloar 2004,
Berglund and Borjesson 2006, Chui et al. 2006). Ongoing analysis continues on
the EROI of various fossil fuels (Cleveland 1992, 2005, Hall, 2008).
At first blush, the calculation of EROI as the ratio of energy outputs to inputs
seems straightforward. However, the concept has never expanded into common us-
age (Spreng 1988). Even with a recent resurgence of interest in this topic due to
escalating oil prices, there is still not a widely accepted methodology for calcu-
lating either the numerator (the energy produced) or the denominator (the energy
consumed) in the EROI equation. While attempting to use this important criteria
to compare energy technologies, different researchers are using different methods
to arrive at widely disparate notional EROI numbers, thereby diluting the policy
value of this energy statistic. The ongoing heated debate over the viability of grain
ethanol is a relevant example. A recent publication (Farrell et al. 2006) suggests that
previous analyses of the EROI of grain ethanol are errant because of outdated data
and faulty methodology. The analysis attempted to standardize previous studies and
introduce modifications of the EROI methodology including measuring energy pro-
duced per unit of petroleum energy invested. However, because a standardized well-
defined EROI formula does not exist, nor is there wide acceptance on the reasons
why net energy analysis is important, the Farrell et al chapter has not ameliorated
the polarization of the debate but rather heightened it (Hagens et al., 2006). At the
very least, this lack of precision and consensus has negative implications for the
utility of EROI analysis, in particular as a tool for decision makers. At the worst, it
leaves the methodology open to manipulation by partisans in the debate over a given
technology.
304 N.J. Hagens, K. Mulder
Furthermore, emphasis is being placed on whether or how much the energy re-
turn of a proposed technology exceeds unity, without addressing the shortfall in
energy return of the segment of energy services it is trying to replace. Corn ethanol
advocates and proponents spend a huge amount of resources and time honing and
refining the corn-ethanol energy balance – whether it’s slightly negative or slightly
positive seems to be of great policy significance. At 1.5:1, which is at the high end
of the latest range, corn ethanol’s energy return remains an order of magnitude be-
low the fossil energy it purports to replace (Cleveland 2001). Unless society makes
large scale changes on the consumption/efficiency side, it will need to address the
variance between its current energy surplus and what can be expected with the com-
bination of lower quality fossil stocks and less energy dense renewable infrastructure
in the future. Due to differences in demand, and the geographic dispersion of high
energy gain renewables, there may be a variety of answers to this question at the
local/regional level and at the national/global level. Since fossil fuels power a global
society, global energy gain, a function of EROI times scale for all energy sources,
will be of central importance in the coming decades. In the following pages, we
review the various usages of EROI in the literature and place them into a consistent
schematic framework. This allows comparison of the different methodologies in
use by clarifying both their assumptions and their quantitative components. We then
synthesize the different methodologies into a two-dimensional classification scheme
with terminology for each version of EROI that will hopefully yield consistent and
comparable results between studies going forward.
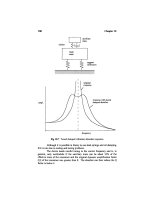
Figure 12.2 is a theoretical aggregate of EROI and scale. D = direct energy
costs, C = indirect energy costs, and B = externality costs (converted to en-
ergy). The area under the outer curve represents the total gross energy production
X=A+B+C+D.Aistheleftover‘netenergy’. Since the most efficient areas
of productions are usually developed first (e.g. best cropland, best wind sites, etc.
(Ricardo 1819) the annual energy gain tends to decline while energy costs tend to
rise with scale of development. Externalities also tend to increase.
At time T1 in Fig. 12.2, there is no surplus energy (A or B) leftover after direct
and indirect energy costs (C and D) have been accounted for, meaning this ‘source’
X, is now an energy sink. If we also translate environmental externalities into energy
terms (B), we then are faced with an energy sink shortly after time T2. In effect, if
we include all costs, direct, indirect, and non-energy parsed into energy, the green
shaded area A is the amount of net resource available under the entire graph. The
graphic also illustrates that the peak energy gain in terms of net benefits to society
is reached more quickly than the peak in gross energy.
It is important to note that unless the energy output and input are identical types,
energy extraction can still continue at an energy loss – but these joules needs to
come from elsewhere in productive society. One can envision a summation of all
energy technologies used globally. If we aggregate all the ‘A’s’ (Or A+B’s if we
ignore environmental externalities) of all planetary energy sources, we have a sum
total of energy gain for society which is able to do useful work and create human
utility (beyond the sun warming us and the wind drying our laundry, and other fixed
natural flows not considered in the global 500 quadrillion BTUs of annual energy
12 A Framework for Energy Alternatives 305
Fig. 12.2 Net energy and EROI as a resource matures over time
use). The surplus energy of a system, or society, is what allows it to continue growth,
maintenance, repair and leisure. If our energy sources required equal amounts of
energy input in order to obtain an energy output, we would have no surplus energy
left for other work (Gilliland 1975). If we had a very small energy surplus, we would
only be able to consume at a low level.
EROI has an eventual trade-off with scale – at low scale, EROI can be very
high, as the best first principles apply. At higher and higher scale, EROI eventually
declines as more resources (energy and other) are needed to harvest the more diffi-
cult parts of the original resource. Indeed, analysis of the EROI of US oil and gas
exploration shows that we had over 100:1 in the 1930s, when the large oil fields
were discovered and put into production. By 1970 the Energy Return on Investment
had declined to 30:1 and down to a range of 10–17:1 by 2000. (Cleveland 2001,
Hall 2003). Anecdotally, from 2005 to 2006, the finding and production costs of the
marginal barrel of oil in the US went from $15 to $35 per barrel. (Herold 2007),
and offshore in the Gulf of Mexico increased from $50 to over $69 per barrel
(EIA 2007). Though these are financial increases as opposed to energy, it suggests
the high return oil has been found, and increasing amount of dollars (and energy)
will be needed to extract the remainder.
12.10 A Framework for Analyzing EROI
Imagine the physical flows of an energy producing technology (T) e.g. a corn
ethanol plant. Energy (ED
in
) and other various inputs ({I
k
}) are taken into the plant
and combined or consumed to produce energy output (ED
out
) as well as possibly
other co-products ({O
j
}) i.e. T(ED
in
, {I
k
})={ED
out
,O
j
}. In its narrowest (and least
informative) form, EROI (minus 1) is similar to the economic concept of financial
306 N.J. Hagens, K. Mulder
Return on Investment but uses energy as the currency while treating non-energy
inputs as negligible. This simple definition yields EROI = ED
out
/ED
in
.EROIis
rarely used in this simple form (examples being Southwide Energy Committee
1980, Gingerich and Hendrickson 1993), but EROI statistics are frequently pub-
lished regarding different technologies that ignore the energy costs associated with
infrastructure and non-energy inputs (American Wind Energy Association 2006).
12.11 Non-Energy Inputs
EROI rarely conforms to the above simplistic formulation. Depending on the def-
inition of T, the energy inputs, ED
in
generally do not account for additional and
significant energy requirements important to the production process. This energy is
embodied in the non-energy direct inputs (Odum 1983), for example the agricultural
energy required to grow oilseeds for biodiesel (Hill et al. 2006). Precise calculation
of the energy embodied in non-energy inputs is nearly impossible – (e.g. do we
include the calories consumed by the farmer for breakfast before he goes to harvest
corn? How much energy is the oil field managers expertise worth? etc.). This may
be resolved either through an input-output matrix framework or by semi-arbitrarily
drawing a boundary beyond which additional, (and presumably negligible), energy
inputs are ignored (Spreng 1988). The latter is the accepted approach for Life Cycle
Analyses (LCAs – International Standard Organization 1997). A typical EROI for-
mulation applies an appropriate methodology to evaluate the embodied energy costs
for the non-energy inputs, which are termed the indirect energy inputs. For a given
production process, this should yield a specific set of coefficients, {γ
k
}, that give
the per-unit indirect energy costs of {I
k
} (e.g. MJ per tonne soybean). This gives the
following version of EROI:
EROI = ED
out
/(ED
in
+⌺γ
k
I
k
). (12.1)
Some analyses arbitrarily include the indirect energy costs for certain inputs
while excluding the energy cost of others, something that clearly creates difficulty
of comparison between studies (Pimentel and Patzek 2005, Farrell et al. 2006). The
embodied energy costs of labor in particular are difficult to define but can be a
significant component of the energy cost. (Costanza 1980, Hill et al. 2006).
Though energy return analysis obviously treats energy as a critical limiting vari-
able, there are potentially numerous other limiting inputs to a production process.
In addition to the direct and indirect energy requirements of an energy technology,
important inputs such as land, time, and water, are difficult (some would argue im-
possible) to accurately reduce into energy equivalent measures. In this chapter we
refer to these as non-energy requirements so as to distinguish them from non-energy
inputs (which can be parsed into energy terms). Non-energy requirements can have
embodied components as well (Wichelns 2001). For example, the biodiesel con-
version process requires labor and water. Similarly, the oilseeds used to produce
biodiesel require inputs such as land, labor, and water in addition to direct and
12 A Framework for Energy Alternatives 307
indirect energy requirements (Pimentel et al. 1994, Pimentel 2003). The standard
assumption underlying past EROI analyses is that all non-energy requirements are
held constant and negligible. In a globally connected world of potentially numer-
ous limiting inputs, energy systems analysis will benefit from a relaxing of this
assumption.
The direct and indirect non-energy requirements can be handled two different
ways. The first method is to identify key, potentially limiting resources and treat
them completely separate from energy inputs. This would create a new indicator
of efficiency for each resource tracked e.g. EROLI(Land) measured in MJ/ha, or
EROW I(Water) measured in MJ/gallon. In particular, for non-energy requirement
X,EROXI is given by:
EROXI = ED
out
/(⌺
X,k
I
k
) (12.2)
where π
X,k
gives the direct and indirect per-unit requirements of X into I
k
.
While this method increases the complexity, it also has advantages. First, it pro-
vides a metric of energy harvesting efficiency that could be included in a broader
energy systems analysis. In combination with other technologies that require differ-
ent array of resource inputs, this type of metric can be informative on the scaling
capacity of a renewable energy portfolio. Second, this type of multicriteria approach
allows for contextual assessment of a technology. Different geographic and political
will be limited in their growth by different resources (Rees 1996), a Liebig’s law
of the minimum for economic growth (Hardin 1999). Some resources like water
may be equally if not more limiting than energy (Barlow 2002). An ideal energy
technology would optimize on scarce resource X (high EROXI) thus deemphasizing
the return necessary on abundant resource Y (lower EROYI).
Another way to deal with non-energy primary inputs is to convert them into
energy equivalents via some set of coefficients ({
X
}) for all non-energy require-
ments X. A justification for this is that in order for any energy procurement
process to be truly sustainable, it must be able to regenerate all resources con-
sumed (Patzek 2004). An approach adopted by Patzek (2004) and Patzek and Pi-
mentel (2005) is to assign energy costs based on a resource’s exergy (Ayres and
Martinas 1995, Ayres et al. 1998), approximately defined as the ability of a system
to perform work and equated with its distance from thermal equilibrium. This can
also be viewed as the amount of energy necessary to reconstitute a given level of
thermodynamic order.
The above set of coefficients yields the following measure for EROI:
EROI =
ED
out
ED
in
+
k
γ
k
I
k
+
X
k
ψ
X
π
X,k
I
k
. (12.3)
Assuming consensus around the validity of the energy equivalents, this measure
of EROI provides for complete commensurability by reducing all inputs to a single
currency.
308 N.J. Hagens, K. Mulder
12.12 Non-Energy Outputs
Just as consideration of non-energy inputs yields a fuller, and more complex EROI
statistic, so too can non-energy outputs be incorporated to provide a more com-
plete indicator of the desirability of a process. Firstly, many technologies yield
co-products in addition to a primary energy product. Most studies assume that a
credit should be given for these co-products which increases the EROI by reducing
the numerator for the process. Mathematically, each co-product O
j
is assigned a
per-unit energy equivalency coefficient (
j
) indicative of its value relative to the
energy product.
The most straightforward method is to assign co-products an explicit energy
value based on their thermal energy content (Pimental and Patzek 2005) or their
exergy (Patzek and Pimentel 2005). However, co-products are seldom used for their
energy content (bagasse in sugar cane ethanol being an exception). If energy is
the limiting variable to be optimized, a full energy credit for dry distiller grains
or milk, may be aggressive, and the EROI of a technology giving full allocation
to co-products will decline as the co-products scale beyond their practical use (e.g
millions of tons of DDGs). Energy values can also be assigned according to the en-
ergy that would be required to produce the most energy-efficient replacement (Hill
et al. 2006). Economic value and mass are two non-energy metrics that are used
to establish relative value, both of which are frequently used in life cycle analyses
(International Standard Organization 1997, deBoer 2003).
Once the energy equivalency coefficients have been established, the EROI for-
mulation is modified to the following:
EROI =
ED
out
+
ν
j
O
j
ED
in
+
γ
k
I
k
. (12.4)
For example, when procuring biodiesel from soybeans, the soybean meal is a
valuable co-product often used as a source of protein for livestock. An energy credit
can be assigned to this co-product based on its actual thermal content (Pimentel
and Patzek 2005), its market value (e.g. Mortimer et al. 2003), or its mass (e.g.
Sheehan et al. 1998). The fact that calculated EROI can vary by a factor of 2 or
more depending on allocation method gives insight that EROI, though much more
so than dollars, is not a purely physical concept.
12.13 Non-Market Impacts
We have considered inputs and outputs that are currently recognized by the mar-
ket system. However, many energy production processes create outputs that have
social, ecological, and economic consequences external to the market. As we are
all part of a planetary ecosystem, to properly include energy externalities should
provide us with more accurate information of the desirability of an energy procuring
12 A Framework for Energy Alternatives 309
technology (Hill et al. 2006). Negative externalities can include loss of topsoil
erosion, water pollution, loss of animal habitat, and loss of food production capacity
(Hanegraaf et al. 1998, Pimentel et al. 2002). Externalities can also be positive
such as the creation of jobs and the maintenance of rural communities (Bender
1999).
As with non-energy requirements, these externalities can be incorporated into our
framework in one of two ways—as separate indicators in a multicriteria framework
or through conversion into energy equivalents. Thus, if topsoil is lost or nitrous
oxide is emitted as part of the life cycle of the technology, we can measure EROI
(Topsoil)orEROI(Nox). Studies that include such externalities have been published
by the US Department of Energy (1989a, 1989b), Giampietro et al. (1997). Such
measures are useful for assessing the scalability of a process within a given con-
text by indicating what resources (e.g. waste sinks) might become limiting under
increased production.
Negative externalities also can be assigned energy equivalency coefficients equal
to the energy required to prevent or remediate their impacts (Cleveland and
Costanza 1984, Pimental and Patzek 2005, Farrell et al. 2006). If we assume a set of
externalities {E
i
} with energy equivalency coefficients {
i
}, then we must add into
the denominator of the EROI calculation the term
i
E
i
. Not many studies have
attempted this approach, however and pursuing this strategy has the drawback of
parsing important non-reducible criteria into one metric.
12.14 A Summary of Methodologies
Table 12.1 lists all of the different formulations of EROI (or net energy analysis)
presented above based on the formulation of the denominator. For each, we’ve
cited one or more studies that have employed that specific variation. While all the
works surveyed fall within the same methodological framework, as outlined above,
Table 12.1 Exisiting EROI Formulations in the Literature
Cost
category
Direct + Indirect + Allocation
Cost = ED
in
Cost = (ED
in
+
␥
k
I
k
) Numerator =
ED
out
+
j
O
j
Energy Wood Biomass
a
Wood to Electric
b
Soy/Sunflower Biodiesel
c
Solar Cells
d
Corn Ethanol
e
Soy Biodiesel
f
Cost = X Cost =
X,k
I
k
Numerator =
ED
out
+
j
O
j
Primary
Input(X)
Hydroelectric,
X=Land
b
Various
Technologies,
X=Water
g
Corn Ethanol,
X = Various Inputs
c,h
Rapeseed Biodiesel,
X = Various Inputs
g
Soy Biodiesel,
X = Various Inputs
f
Rapeseed Biodiesel,
X=Water
i
310 N.J. Hagens, K. Mulder
Table 12.1 (continued)
Cost category Direct + Indirect + Allocation
Cost = E Cost =
E,k
I
k
Numerator =
ED
out
+
j
O
j
Externality (E) Wind, E =
Emissions
j
Various
Technologies,
E=Soil
Loss
g
Various Technologies,
E = Emissions
k
Wind, E = Emissions
l
Biodiesel, E = Emissions
f
Ethanol, E = GHG
m
Energy
Equivalents
(1) Conversion of externalities into energy: Cost = ED
in
+
␥
k
I
k
+
i
E
e,h
i
(2) Conversion of primary inputs into energy: Cost
=ED
in
+
␥
k
I
k
+
X
X,k
I
c,h
k
Citations:
a
(Gingerich and Hendrickson 1993)
b
(Pimentel et al. 1994)
c
(Pimentel and Patzek 2005)
d
(Pearce and Lau 2002)
e
(Farrell et al. 2006)
f
(Sheehan et al. 1998)
g
(Hanegraaf et al. 1998)
h
(Patzek 2004)
i
(DeNocker et al. 1998)
j
(American Wind Energy Association 2006)
k
(European Commission 1997)
l
(Schleisner 2000)
m
(Mortimer et al. 2003)
(Table and accompanying text adapted from Mulder et al. 2008)
assumptions and terminology vary significantly among studies resulting in conflict-
ing results that make them difficult to compare.
12.15 A Unifying EROI Framework
If net energy analysis is to produce results that are clear, and comparable across
studies, and be of practical use to researchers and policy-makers, it will be nec-
essary for the methodology to become uniform and well-specified. Such standards
exist in the area of life cycle analyses (International Standard Organization 1997).
However, unlike LCA, it is probably not possible or even desirable that EROI be
restricted to a single meaning or methodology. The different levels of energy and
environmental analysis outlined above are relevant to different problems, contexts,
and research objectives. The problem heretofore has arisen when the same term is
used for methodologies with different assumptions and different goals.
We propose a two-dimensional framework for EROI analyses (with accompa-
nying terminology) that clarifies the major assumptions in an analysis. In the first
dimension, we identify three distinct levels of analysis that can be distilled from the
above examples. These levels differ in terms of what they include in their analysis.
12 A Framework for Energy Alternatives 311
The first level deals with only the direct inputs (energy and non-energy) and direct
energy outputs. We term this Narrow Boundary EROI as, while it can offer more
precise EROI calculations, it is also the most superficial, restricting the analysis
to simple inputs and thus missing many critical energy costs (as well as ignoring
co-products). The next level, Intermediate Boundary EROI, involves incorporating
indirect energy and non-energy inputs as well as crediting for co-products. This is
the methodology used by Life Cycle Analysis to estimate the EROI of an energy
technology. Intermediate Boundary EROI requires two assumptions that must be
made clear: (1) What allocation method is used for the co-products (thermal content,
price, mass, exergy etc.); and (2) What boundaries are used for determining indirect
inputs. Finally, Wide Boundary EROI incorporates additional costs (and possibly
benefits) for the externalities of the energy technology. Admittedly, this is the most
imprecise but also the most relevant of the EROI measures in that it presents the
fullest measure of the net energy available to society.
Total
EROI
Basic
EROI
Multicriteria
EROI
Wide
Boundary
in
out
ED
ED
∑
k
kkX
out
I
ED
,
⎟
⎠
⎞
⎜
⎝
⎛
+
∑
k
kk
in
out
IED
ED
∑
k
kkE
out
I
ED
,
⎟
⎟
⎟
⎟
⎟
⎟
⎠
⎞
⎜
⎜
⎜
⎜
⎜
⎜
⎝
⎛
+
+
+
∑
∑
∑
i
ii
k
kkXk
k
kk
in
out
E
I
IED
ED
,
∑
+
k
kk
in
out
IED
ED
⎟
⎟
⎟
⎠
⎞
⎜
⎜
⎜
⎝
⎛
+
+
∑
∑
k
kkXk
k
kk
in
out
I
IED
ED
,
k
out
I
ED
in
out
∑
kkX
out
I
,
⎟
⎠
⎞
⎜
⎝
⎛
+
∑
k
kk
in
out
I
γ
∑
k
kkE
out
I
,
πα
πα
⎟
⎟
⎟
⎟
⎟
⎟
⎠
⎞
⎜
⎜
⎜
⎜
⎜
⎜
⎝
⎛
+
+
+
∑
∑
∑
i
ii
k
kkXk
k
kk
in
out
E
I
I
ν
π
γ
α
,
∑
+
k
kk
in
out
I
ψ
ψ
ψ
π
⎟
⎟
⎟
⎠
⎞
⎜
⎜
⎜
⎝
⎛
+
+
k
kkXk
k
kk
in
out
I
I
,
γ
α
α
k
out
Intermediate
Boundary
Narrow
Boundary
Fig. 12.3 Methodological framework for net energy analysis. The side axis determines what to
include (direct inputs, indirect inputs, and/or externalities). The top axis dictates how to include
non-energy requirements (ignore, convert to energy equivalents, or treat as separate inputs.) Note
that since basic EROI ignores non-energy inputs, it does not have a wide boundary form that
accounts for externalities. (Table and accompanying text adapted from Mulder et al. 2008)
312 N.J. Hagens, K. Mulder
Once it has been determined what can (and should) be included in the analysis, the
second dimensioninourframework dictateshowto includetheseinputs. We delineate
three choices for handling of the non-energy requirements and externalities. They
can be ignored, yielding Basic EROI, or converted to energy equivalents, yielding
‘Total EROI’, or handled as separate components yielding ‘Multi-criteria EROI’.
Our framework is presented in Fig. 12.3. Note that while the grid is 3×3, it
yields only 8 meaningful formulations. The different levels of analyses are nested
hierarchically. The computation of a wider boundary EROI for an energy production
process should easily yield all other forms of EROI found below it. That is to say,
the necessary data will have been compiled and it is merely a decision of which
components to include in the calculation. Similarly, a Total EROI calculation will
use the same data set as a Multi-criteria EROI with the addition of energy equiva-
lency coefficients. This means that more comprehensive studies should yield results
at least partially comparable with less comprehensive studies as seen in a meta-study
of ethanol by Farrell et al. (2006).
12.16 Liebig’s Law, Multi-Criteria Analysis, and Energy
from Biofuels
Though it is becoming apparent that energy will be a limiting variable for society
going forward, it is easy to envision other equally limiting variables as the plane-
tary population increases its demand on ecosystems. Water, land, and carbon sinks
are only three examples of inputs and impacts of renewable energy production that
could limit the potential of a technology (Giampietro et al. 1997, Hagens et al. 2006,
Hill et al. 2006). These should be included explicitly in a net energy analysis or else
their cost in terms of energy should be estimated.
Liebig’s Law of the minimum states that the production of a good or resource
is limited by its least available input. In layman’s terms something is only as good
as its weakest link. This form of ecological stoichiometry will loom large in the
procurement of energy alternatives to fossil fuels. Water, land, soil, greenhouse
gas emissions, and specific fossil inputs themselves will potentially limit scaling
of alternative energy.
Though EROI is generally measured as the ratio of the gross energy return to the
amount of energy invested, it has been argued this can give a false indicator of the
desirability of a process due to the increasing cost of non-energy requirements as
EROI approaches 1. Following Giampietro et al. (1997), let = EROI/(EROI – 1)
be the ratio of gross to net energy produced. equals the amount of energy pro-
duction required to yield 1 MJ of net energy. From an energy perspective, all costs
have been covered. However, for non-energy requirements the perspective and the
implications, change.
Let EROXI be the energy return for 1 unit of non-energy requirement X. Then
1/EROXI is the number of units of X required for 1 MJ gross energy production.
From the above, it is easily seen that /EROXI units of X are required, or more gen-
erally, the net energy yielded per unit of X is equal to EROXI/. Since increases
non-linearly (approaching infinity) as EROI approaches 1, a relatively small change