Wrox Professional Crystal Reports for Visual Studio NET Second Edition phần 2 doc
Bạn đang xem bản rút gọn của tài liệu. Xem và tải ngay bản đầy đủ của tài liệu tại đây (2.05 MB, 38 trang )
01 557300 Ch01.qxd 3/24/04 9:37 AM Page 16
Chapter 1
For more information on deploying your Crystal Reports .NET application, go to Chapter 10,
“Distributing Your Application.”
ADO .NET
With the introduction of ADO .NET, data access has become much easier, and Crystal Reports .NET can
take advantage of ADO and the ADO .NET dataset. Instead of having to work out how to access various
data sources, Crystal Reports .NET can simply access the ADO .NET dataset as the source for any report
you may create.
XML Report Web Services
For sharing reports and creating tiered applications, XML Report Web Services are invaluable. Within
the Visual Studio IDE, you can create a Web Service from a report file with two clicks. From that point,
Report Web Services can be exposed to users inside and outside of your organization and can be con-
sumed using one of the new viewers included with the product. To optimize the report pages coming
over the wire, XML is used to send the report a page at a time to either the Windows or Web Report
Viewer, which makes reports viewed from Web Services quick and responsive.
Installing Crystal Reports .NET
Crystal Reports .NET ships as a component of Visual Studio .NET and can be installed from the common
Visual Studio .NET setup utility. If you are installing Visual Studio .NET for the first time, you may need
to complete the Windows Component Update shown in Figure 1-10 before you can begin. The setup
utility will look at your current configuration and determine whether you need to update any files or
applications. If required, setup will guide you through the update process.
After you have completed the component update, you can install Visual Studio .NET. The option to
install Crystal Reports for Visual Studio .NET can be found under the Enterprise Development Tools
options when selecting installation components. By default, when you select the Crystal Reports option,
all of the related components will be installed as well, as shown in Figure 1-11:
16
01 557300 Ch01.qxd 3/24/04 9:37 AM Page 17
Crystal Reports .NET Overview
Figure 1-10
Figure 1-11
17
01 557300 Ch01.qxd 3/24/04 9:37 AM Page 18
Chapter 1
Once it is installed, the Crystal Reports icon will appear on the Visual Studio .NET splash screen, and
from the Add New Item menu, you should see the option to add a new Crystal Report, as shown in
Figure 1-12.
Figure 1-12
With the installation complete, we can jump right into looking at the samples that are installed with the
product and learning about Crystal Reports .NET.
Learning from Sample Applications
Crystal Reports for Visual Studio .NET ships with a number of sample applications to help you get
started. The majority of sample applications are simple, but each demonstrates some aspect of report
integration, features, or functionality and provides a good learning resource if you are just starting out
with Crystal Reports .NET or are new to this version.
Installing Sample Applications
The Crystal Reports .NET sample applications are installed by default and can be found in the Crystal
Reports directory where you have installed Visual Studio .NET. These samples are in self-extracting
files that you will need to run before you can open the samples within Visual Studio .NET. These
18
01 557300 Ch01.qxd 3/24/04 9:37 AM Page 19
Crystal Reports .NET Overview
samples, shown in Figure 1-13, are located at X:\Program Files\Microsoft Visual Studio.NET
2003\Crystal Reports\Samples\Code
(where X: is the drive where you have installed Visual
Studio .NET).
There are two sets of sample applications available, both of which are bundled in self-extracting files —
WebForms.exe and Winforms.exe. The first, which will extract to a folder marked WebForms, is
written using ASP .NET and demonstrates the use of the Crystal Reports Web Forms Viewer. To view
these samples, you will need to use IIS Internet Services Manager to create a virtual directory called
CRSamples that points to the directory where you extracted the sample files. From that point, you
should be able to access these samples from
http://localhost/CRSamples.
Figure 1-13
19
01 557300 Ch01.qxd 3/24/04 9:37 AM Page 20
Chapter 1
The following samples are included in this set:
Sample Description
Simple Page The Simple Page sample application demonstrates using the Web
Forms Viewer with one of the sample reports (World Sales). This
sample demonstrates drilling down into the details of the report and
some of the other features of the report viewer, including the report
group tree, the viewer toolbar, and the page control options.
Custom Navigation This sample demonstrates the amount of customization that can
occur within the Web Forms Viewer. The viewer has a set toolbar by
default, but developers who wish to control the look and feel of the
entire page can control the toolbar or even create their own with min-
imal coding.
Interactivity This shows how events can be fired when different areas of a report
are clicked, which will change the text of the textbox in the upper
right-hand corner. It also gives some insight into the events sup-
ported by the Web Forms Viewer.
There is also a More Samples link that will take you back to the Crystal Decisions Web site.
The second set of sample applications, for Windows Forms, is extracted from a self-extracting file and
can be found in the WinForms folder. These samples demonstrate the use of Crystal Reports .NET with
Windows applications and include separate projects for Visual Basic and Visual C#. Both of these pro-
jects demonstrate a simple Preview implementation of the Windows Forms Viewer and allow you to
select a report to view. Once you have selected a report file (there are a couple located in the
Reports
directory of the Samples folder), the report is bound to the viewer; the Print Engine runs the report and
uses the viewer to display the results.
Sample Reports
In addition to sample applications, there are also sample report files available for you to use in your
testing and development. There are two different sets of reports available in the Reports directory of the
Samples folder: Feature Examples demonstrate different features and functionality within Crystal
Reports .NET (Charting, Embedded Hyperlinks, Sorting, and so on), and General Business reports are
typical of reports that may be created and used in business (Income Statement and World Sales Report,
for example).
All of these reports have been created using the sample Access database that ships with Crystal Reports
.NET and are indispensable to use when debugging. If you are having difficulty integrating your report
and can’t determine whether it is your code, the viewer, or the report designer itself that is not working,
you can substitute your report with one of the sample reports and at least eliminate one option!
20
01 557300 Ch01.qxd 3/24/04 9:37 AM Page 21
Crystal Reports .NET Overview
Sample Data
A sample database has been included with Crystal Reports .NET, and the sample reports listed previ-
ously are based on this database. The Xtreme Mountain Bike Company database (
xtreme.mdb) shown
in Figure 1-14 is an Access database that contains tables for Customers, Orders, Products, Suppliers, and
Employees. It does not require a copy of Access to be installed or loaded on to your machine to be used.
Tutorials
Crystal Decisions has its own Web site dedicated to developing reporting applications with Visual Studio
.NET, and it includes a number of tutorials or walkthroughs that can be used to get up to speed quickly
with the product. The Web site is located at
www.businessobjects.com/products/dev_zone/. You
will need to register before you can download the tutorials or other materials.
Figure 1-14
21
01 557300 Ch01.qxd 3/24/04 9:37 AM Page 22
Chapter 1
There are a number of tutorials available:
❑ Reporting off ADO .NET Datasets
❑ Viewing a Report in a Web Application
❑ Designing and Viewing a Report in a Windows Application
❑ Exposing Reports as Web Services
❑ Interactivity and Reports in Web Applications
Most of these tutorials can be completed using the sample database and reports that ship with the prod-
uct, or you can go through the tutorial using your own reports and data source.
You will also find a number of sample reports, applications, tutorials and walkthroughs on the Crystal
Developers Journal Web site, available at
www.crystaldevelopersjournal.com (shown in Figure 1-15).
In addition to their own articles and content, the site serves as a clearing house with links to other Crystal-
related content on the Web.
Figure 1-15
22
01 557300 Ch01.qxd 3/24/04 9:37 AM Page 23
Crystal Reports .NET Overview
You can also find more information (and post a question if need be) on Microsoft’s public newsgroups.
The majority of Crystal-related questions, regardless of version or language, get posted to microsoft.
public.vb.crystal, but there are always a few questions posted in the general dotnet newsgroup
microsoft.public.dotnet.general.
You will need a newsgroup reader, such as Outlook Express, to access these newsgroups. You can also
visit Microsoft’s HTML version of the newsgroups on their Web site.
Finally, Crystal Decisions maintains its own Web-based forums at
http://community.
businessobjects.com
, where you can post questions and get some answers. Crystal Decisions does
not monitor these forums, but generally the advice is good, and you can always find someone who is
willing to help. While you are on the site, make sure you register your copy of Crystal Reports .NET for
free access to technical support and updates (and the requisite marketing e-mail or two).
Summary
Crystal Reports for Visual Studio .NET 2003 builds on the reporting technology found in Visual Studio
.NET 2003 and is a powerful addition to the .NET toolset, designed to take advantage of the new .NET
development framework. Using the Crystal Reports Designer, you can quickly create or modify reports
without having to leave the Visual Studio IDE. When it is time to integrate your report into either a
Windows or Web application, Crystal Reports includes a number of viewers that you can quickly inte-
grate into your application. With a scalable back-end processing architecture, Crystal Reports for Visual
Studio .NET should be the only tool you need to integrate reporting into your enterprise applications.
In the next chapter, we’ll move beyond the product overview to actually start creating reports and inte-
grating them into our own development.
23
01 557300 Ch01.qxd 3/24/04 9:37 AM Page 24
02 557300 Ch02.qxd 3/24/04 9:24 AM Page 25
Getting Started with
Crystal Reports .NET
Now that you have a better understanding of Crystal Reports .NET’s features and functionality,
we can start to look at the tool itself and how it is used.
In this chapter, we will be looking at the Crystal Reports Designer within Visual Studio .NET and
learning how to create and import reports for use in Windows or Web applications. This will
include:
❑ Planning your report design
❑ Creating a report using an expert
❑ Working with the report design environment
❑ Report design basics
By the end of the chapter, you will have the skills to develop your own basic reports and navigate
through both the user interface and the reports you have created. If you have used Crystal Reports
before, some of the material in this chapter will be familiar. Crystal Reports .NET builds on the fea-
tures and concepts found in previous versions of Crystal Reports, but there are some things that
are unique to this version, which will be identified throughout this book.
Keep in mind that this chapter is not designed to be the exhaustive reference on report design; it is
just to get you started. Chapter 3, “Designing Reports,” is dedicated to all of the advanced report
design concepts that you will need to create complex reports.
02 557300 Ch02.qxd 3/24/04 9:24 AM Page 26
Chapter 2
The Sample Files
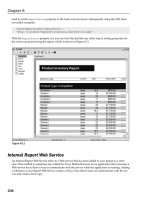
In the C:\Crystal.NET2003\Chapter02\ folder you will find all of the sample reports, like the one
shown in Figure 2-1 and other reports that illustrate similar concepts, as well as the application we build
in this chapter:
❑
CustomerListing — a report that we will create with the Report Expert
❑
ViewerDemo — a small application that you can use to preview some more advanced sample
reports
The sample reports utilize the Xtreme sample database that ships with Crystal Reports .NET. By default,
this is located in at
C:\Program Files\Microsoft Visual Studio .NET 2003\Crystal Reports\
Samples\Database\Xtreme.mdb
and will have an ODBC DSN that points to this location so Crystal
Reports .NET can see the database. If for some reason, you don’t have this DSN, you will need to create
one using the ODBC Data Source Administrator found in the Control Panel under Administrative Tools
(sometimes also called Data Sources in other operating systems) as shown in Figure 2-2.
Figure 2-1
26
02 557300 Ch02.qxd 3/24/04 9:24 AM Page 27
Getting Started with Crystal Reports .NET
Figure 2-2
Select the System DSN tab and click the Add button. This displays a list of drivers for which you want to
set up a data source. We are using a Microsoft Access database, so select Microsoft Access Driver (.mdb)
and then use the next window to locate the database and give it a name (Xtreme Sample Database 2003),
finally selecting OK to finish.
Planning Your Report Design
Before we actually get into the technical report design, we need to spend a little time planning our report
to alleviate some of the problems we might face later when we actually sit down and develop the report.
Often developers will create reports that they think the user will want, using all of the latest features,
bells, and whistles, only to find that the end user would be happy with a simpler report that was easier
to read and understand.
Another problem is that a developer will often sit down and crack open the Report Designer without
really knowing what the end product will look like or considering how the end user will use what has
been created. What is called for is a bit of planning before we jump right into the technical aspect of
designing reports. By planning our report before we get started, we can deliver a report that meets the
users’ needs and expectations.
If you already have a report design methodology and it works for you, please have a read over this sec-
tion anyway; you may find a different way of doing things or be able to incorporate some small part of it
into what you already do. In any case, there are a number of reports associated with this section avail-
able in the downloadable code for this chapter. Feel free to modify these reports for your own use.
27
02 557300 Ch02.qxd 3/24/04 9:24 AM Page 28
Chapter 2
In a very basic report design methodology, there are four steps to planning a new report:
❑ Gather report requirements
❑ Perform technical review
❑ Develop report prototype
❑ Design report
In most applications, reports are usually tied to a specific function or area of an application. For exam-
ple, if you have created an application that is used for entering telephone sales orders from customers,
chances are there will be a suite of reports tied to that function, showing sales summaries, order totals,
and so on. The best way to determine what these reports should look like is to actually ask the people
who will be using them on a daily basis.
If you are working in a large organization, you will probably have a business analyst who will interview
the users, gather their requirements, and then communicate these requirements back to you. If you are in
a smaller organization or, if like the rest of us, you are forced to take on a number of roles, you may
gather these requirements yourself.
In either case, end-user interviews are the key to targeting a report’s content. Organize the interviews
with the actual end users (not their supervisors, personal assistants, or others), and ask them to bring
along examples of reports they currently use or would like to use. This is your chance to find out what
information they need to better perform their job. Be careful when interviewing, as users will sometimes
come up with an arm-length wish list for reports they would like to see.
In the interview, the user should be able to tell you how the report is used and what decisions are made
based on this information. If they can’t tell you either of these things, either you are interviewing the
wrong person or they really don’t need the information they have asked for.
Once you have interviewed the end users, you should have a pretty good idea of what reports are
required and how they will be used. From this point, there are many different ways of documenting the
user’s requirements (such as user requirements statements or use cases), but the most straightforward
method is to create a formal Report Requirements document.
A Report Requirements document will outline what information needs to appear in the report, how the
report is used (is it interactive or run in a batch?), and the general look and feel of the report. You may
also create a mock-up of the report or a rough sketch of what it will look like. With your report require-
ments in hand, the next step in our method is to perform a technical review of the report’s definition.
A good place to start with a technical review is to determine the data source for this report. Most likely the
data source will be a relational database, but the data could also reside in spreadsheets, text files, OLAP
(Online Analytical Processing) data structures, and even nonrelational data sources (like Exchange or
Outlook folders). Once you have found the data source, you will need to dig a little deeper to determine
the exact tables and views that can provide the data required. You may need to develop additional views
or stored procedures to consolidate the data prior to developing a report (for speed and ease of use and
reuse), and these will need to be documented, as well. Again, all of this information is added to your
Report Requirements document.
28
02 557300 Ch02.qxd 3/24/04 9:24 AM Page 29
Getting Started with Crystal Reports .NET
For the next step of the technical review, you will need to investigate whether the design of the report is
feasible. The user may request twenty columns when the page will fit only seven landscape, or they may
have based the design on an existing report or spreadsheet created by hand. Once you are more experi-
enced working with Crystal Reports, you will begin to understand how the tool works and the kind of
output that can be achieved. In the meantime, browse through some of the sample reports that ship with
the product to get a feel for the types of reports Crystal can produce.
Once you have completed the technical review, you understand where the data for the report resides,
and you are comfortable that Crystal Reports .NET can deliver the required format, it is time to create a
report prototype from your notes and preliminary sketches. This prototype can be created using Word,
Excel, Visio, and other programs, but it should closely match the report’s final layout and design. Again,
another important check is to make sure that the layout and design you want can be created with the
features and functionality that Crystal Reports .NET has available.
A good way to determine whether Crystal Reports .NET can deliver a particular format for data is to
find a sample report that shows the data presented in the method you want to use. You also could create
a small proof-of-concept report with sample data to test the design.
The prototype, combined with a formal Report Requirements document, will clearly communicate what
the report should look like when it is finished. It also helps gain user acceptance for the design, as they
can see what the finished product will look like even before you have opened the Report Designer. If
you are working in a large team, this documentation will communicate the requirements to other report
developers so you don’t actually have to brief them on every single report that needs to be developed.
If you are working as a business analyst, application developer, and report developer all-in-one, it can
also help you keep on track with the user’s requirements and make gaining user acceptance that much
easier. Once signed-off by the client, the Report Requirements is a contract, so should it turn out that the
report designed isn’t what the client wanted, you can point to this document and their signature on it!
Finally, with the documentation and prototype in hand, it is time to sit down, open the Report Designer,
and design your report.
Creating a Crystal Report
In the next few pages, we are going to walk through the steps to create a customer listing report in an
existing Windows application using the Standard Expert. You can open the solution and project that is
available in the code download for this example (located by default at
C:\Crystal.NET2003\
Chapter02\chapter2.sln
) or create your own.
When creating a report from scratch within Crystal Reports .NET, you have a number of experts that can
be used to guide you through the report development process. In this section, we will look at how to use
one of these experts to get started. Once you have finished working through the expert, you will have a
report you can further develop using the integrated designer. Over time, as the interface becomes famil-
iar, you may choose to start with a blank report and build it up piece-by-piece, but most developers use
the expert at least to get them started.
29
02 557300 Ch02.qxd 3/24/04 9:24 AM Page 30
Chapter 2
To begin, create a new Visual Basic .NET project by opening Visual Studio .NET 2003 and selecting New
Project. Select Windows Application from the dialog, call the project
CustomerListing, and put it in
the folder
C:\Crystal.NET2003\Chapter02.
Adding a Report to Your Application
Adding a new report to your application is as simple as selecting Project → Add New Item and selecting
Crystal Report from the list of available templates. Enter
customerlisting.rpt into the name field
and then click Open to insert the new report into your application. A separate tab will now appear for
the report and allow you to use the integrated Report Designer to create your report, but before you can
do this you will see the Crystal Report Gallery window, shown in Figure 2-3.
Figure 2-3
If you haven’t registered Crystal Reports .NET, you will receive a nag screen asking you to register the
product. This registration is specific to Crystal Reports and is required to be able to distribute your
applications to other users. You can use the Registration Wizard that appears to register via the Internet,
e-mail, fax, or mail and will receive a registration key that will eliminate the nag screen and allow you to
distribute your application.
The first decision you will need to make about your report is to select how it will be created. In this
instance, we are actually going to use one of the report experts to walk us through the report design,
but there are other options as well, as shown in the following table.
30
02 557300 Ch02.qxd 3/24/04 9:24 AM Page 31
Getting Started with Crystal Reports .NET
Method Description
Using the Report Expert There are a number of different report experts available to walk
you step-by-step through creating a report. This is the most
popular method even for experienced report developers, as it
provides a starting point for further report development.
As a Blank Report This option is for experienced developers who are familiar
with the Report Designer and want to build a report up piece
by piece. This is often a good way to produce a report that is
leaner and has fewer overheads built into it. When this is
selected, the experts aren’t available.
From an Existing Report If you have an existing report that will serve as the basis for the
report you wish to create, you can use this method to import
your existing report. Again, when this is selected the experts
aren’t available.
Using a Report Expert
If you decide to use a report expert, there are seven different experts to choose from. All of the experts
share some steps in common; in all of them you will be prompted for the data source for your report, for
example, as well as for what fields will appear.
As we go through this chapter, we will be looking at all of the major steps involved in creating a report
using the experts, but for now here is an overview of the different types of experts available:
❑ Standard — The Standard Expert is used most often and is the most generic. You can use the
Standard Expert to create a column-based reportthat includes features such as grouping, sort-
ing, and summaries. This expert has the ability to add charts, apply a number of predefined
styles, filter records, and it also includes advanced analysis features like TopN, BottomN (for
example, the top 10 or bottom 10 reports).
❑ Form Letter — By combining text objects and database fields, Crystal Reports .NET can be used
to create form letters and statements. This expert guides you through creating a report and
placing database fields and text within that report.
❑ Form — To support reports that are designed for a specific paper form, Crystal Reports .NET
can use a scanned form or graphic as a guide for your report. Using the Form Expert, you will
be able to underlay an image behind your report to correctly place fields on the form. From that
point, you can either leave the image in place and print the form and fields on blank paper or
delete the image and print the report directly onto your forms.
❑ Cross-Tab — Cross-tabs within Crystal Reports .NET look similar to a spreadsheet, with columns
and rows of summarized data. Using the Cross-Tab Expert, you can create a report that will fea-
ture a cross-tab object in the report header.
❑ Subreport — Subreports are reports that are inserted into a main report. Subreports can be unre-
lated to the main report or you can pass parameters between the main report and subreports to
determine the content to display.
31
02 557300 Ch02.qxd 3/24/04 9:24 AM Page 32
Chapter 2
❑ Mail Label — Crystal Reports .NET supports multi-column reports, and this functionality
makes mailing labels possible. It includes a number of mailing labels predefined for common
label stock from Avery and other suppliers (but only in Letter sizes), or you can create your own
custom label size using this expert.
❑ Drill Down — The concept behind drill-down is that you display a summary in your report and
users can drill-down into the summary to see the details that make it up.
For this chapter we will look at the Standard Expert, so click OK with Standard selected in the listbox in
the Crystal Report Gallery window.
Selecting Your Data Source
The first step in any of the experts is to select your data source. There are seven different types of data
sources we can use as the basis of our report, as shown in Figure 2-4.
Figure 2-4
Which of these data sources you select as the basis of your report will depend on your own particular
needs and the data sources available to you.
Data Source Description
Project Data Crystal Reports .NET can leverage the ADO .NET Framework and
report directly from datasets that appear in your application. For
more information on how Crystal Reports .NET can be used with
ADO .NET data, please see Chapter 7, “Working with .NET Data.”
32
02 557300 Ch02.qxd 3/24/04 9:24 AM Page 33
Getting Started with Crystal Reports .NET
Data Source Description
OLE DB (ADO)
ODBC (RDO)
ODBC-compliant driver (which is just about every other data
Database Files This folder includes a number of file-type database formats, includ-
.XSD extension) is used to determine the details of the dataset, such as fields or
using this data source.
This folder is for data sources that can be accessed through OLE DB,
including SQL Server, Oracle, and Microsoft Jet 3.51/4.00–accessible
data sources (Access, Excel, Paradox, Dbase, and so on).
This folder is for data sources that can be accessed through an
source). In addition to reporting from tables, views, stored proce-
dures, and so on, Crystal Reports .NET will also allow you to enter
an SQL command to serve as the basis for your report.
ing Access, Excel, XML, and Crystal Field Definition files (TTX), used
with previous versions of Crystal Reports and bound reporting.
More Data Sources These include reporting directly from XML files, Access/Excel
through DAO, and Crystal Field Definition Files (TTX).
When reporting from an ADO .NET data source, the underlying XML file (with the
lengths. Because this XML contains only the definition of the data and not the data
itself, you won’t be able to browse data from within the Report Designer when
To select the table we are going to use in our customer listing report, double-click the node for ODBC
(RDO), which will open the dialog shown in Figure 2-5.
Figure 2-5
33
02 557300 Ch02.qxd 3/24/04 9:24 AM Page 34
Chapter 2
Select the Xtreme Sample Database 2003 and click Finish. This data source should now appear in the
Data tab of the Standard Report Expert, shown in Figure 2-6.
Figure 2-6
Click the plus icon next to Tables, locate the Customer table, and double-click it to insert this table into
your report.
Multiple Tables
If you select multiple tables to appear in your report, a new tab will appear for Links, allowing you to
specify how these tables or views are joined together. By default, Crystal Reports .NET will attempt to
make these links for you, based on the primary keys, field lengths, and names. You can clear the links
that have been provided by clicking the Clear Links button on the right-hand side of the Links dialog
(or by highlighting each link and clicking the delete button), and you can redraw them by dragging one
field on top of another.
By default, Crystal Reports .NET will join these tables with an Equal join, but you can change the join
type by right-clicking on top of the link and selecting Link Options. If you have added a second table,
delete it now because we will use only a single table in this example; to do this click the Data tab, select
the second table you added from the Tables in Report column, and finally click the Delete Table button.
Choosing the Fields For Your Report
Now that you have selected the data source for your report, the next step in the Standard Expert is to
select the fields that will appear in your report. To move on to this step, you can either click the Fields
tab at the top of the expert or use the Next button at the bottom of the dialog.
34
02 557300 Ch02.qxd 3/24/04 9:24 AM Page 35
Getting Started with Crystal Reports .NET
To select a field, highlight the field and then use the arrows to move it from the left-hand list to the right,
as shown in Figure 2-7. The fields will be listed using the notation TableName.FieldName, and if you are
unsure of a field’s contents or type, you can use the Browse Data button to browse the contents of the
field. There is also a Find Field button for finding a particular field in long field lists, or you can click
anywhere within the table and just start typing the name of the field; Crystal Reports will jump directly
to the field.
Figure 2-7
When you look at your report’s design a little later, the fields you have selected here will be inserted
into the report’s detail section and a separate line will be printed for each record in the dataset. You can
change the order these fields are inserted by using the up and down arrows at the top right corner of the
dialog. They are inserted from left to right on your report, starting from the top of the list of fields that
appear here.
For this report, we are inserting:
❑ Customer.Customer Name
❑ Customer.Contact Last Name
❑ Customer.Contact Title
❑ Customer.E-mail
❑ Customer.Phone
With each field, a corresponding field heading will be added to your report and placed in the page
header. You can use the textbox marked Column Heading to change the default heading (usually the
field name), or you can edit the headings later in the Report Designer.
35
02 557300 Ch02.qxd 3/24/04 9:24 AM Page 36
Chapter 2
Having selected the data source for your report and these five fields, you could click the Finish button to
begin working with your report in the Report Designer, but we are going to push on and have a look at
grouping and sorting the data.
Grouping and Sorting
After you have selected the fields that will appear on your report, you can choose which fields will be
used for sorting and grouping. Click the Group tab and use the same concept as before — moving the
field from the left-hand list to the right to select it for grouping.
This dialog can be confusing, as developers will select a group field and then preview their report, only
to find that the data are sorted, but no group has been inserted. In order to create groups of records, you
must specify a field in the dialog shown in Figure 2-8 and in the next dialog we discuss (the Total tab)
and then select some summary to appear for each group.
Figure 2-8
The fields we are selecting for the grouping in our report are:
❑ Customer.Country
❑ Customer.Region
❑ Customer.City
You can change the order of the fields you have selected by using the up and down arrows in the upper
right corner of the dialog and then selecting a sort order from the drop-down list below.
36
02 557300 Ch02.qxd 3/24/04 9:24 AM Page 37
Getting Started with Crystal Reports .NET
There are four options available for sort order including:
Sort Order Description
Ascending For ordering the data from A–Z, 1–9, and so on.
Descending For ordering the data from Z–A, 9–1, and so on.
Original If your dataset is already sorted, this option will leave the data in its
original sort order.
Specified Used for creating your own custom groups and setting some criteria.
Any records that meet the criteria would belong to the specified group.
If you select in a specified order, a second drop-down list and other items appear in the window, as
shown in Figure 2-9.
Figure 2-9
This is called specified grouping. It allows you to create named groups and specify some criteria for the
group. For example, if you were working with a database that contained a Country field, you could cre-
ate a new group by clicking on the New Named Group button, giving it the name of
Asia Pacific, and
then specifying the countries that are considered to be in the Asia Pacific group (Australia, New
Zealand, and the Philippines, among others).
When setting up named groups, you are limited to the standard Crystal record-selection operators
(equal to, not equal to, is one of, and so on.) and can only reference the field you are grouping.
You also have the option of dealing with the other records that fall outside of your grouping criteria by
clicking on the Others box in the Standard Expert window. This will open the dialog shown in Figure 2-10
and will allow you to select what to do with the other, unused records.
Figure 2-10
37
02 557300 Ch02.qxd 3/24/04 9:24 AM Page 38
Chapter 2
Although specified grouping is very useful for reordering records, it can be monotonous if you have to
use it continually to create the same specified groups in multiple reports. The best practice for specified
grouping is to use it only when necessary. If you find you are creating the same groups over and over
again, you may want to consider putting this logic into a stored procedure or creating another lookup
table in your database that will determine how your grouping is broken up.
For this example, we are not going to use specified grouping, so with your group set as Customer.Country,
Customer.Region, and Customer.City in ascending order, the next step is to insert the summaries you want
to see within your report.
Working with Simple Summaries
Click the Total tab in the Standard Expert window to add summary information to the report. Summary
fields are calculated fields within a Crystal report that do not require a formula to be written.
Encapsulating the most popular requests for calculations, like sums and averages, summary fields can
be used to rapidly develop reports without a lot of repetitive coding.
To insert a summary field, you will need to select a database field (in this case, Customer.Last Year’s
Sales) and then choose a summary type from the drop-down list shown in Figure 2-11. We have chosen
sum and have also checked the Add Grand Totals box at the bottom of the dialog.
Figure 2-11
There are over 20 summary operators available for use, but unfortunately the documentation that ships
with Crystal Reports .NET does not include a list of them or how they can be used, so a list of the most
popular has been included here. Keep in mind that the summary fields available depend on the type of
field you have selected; you can’t calculate the average of a string field, for example.
38
02 557300 Ch02.qxd 3/24/04 9:24 AM Page 39
Getting Started with Crystal Reports .NET
Summary Function Description
Sum Calculates a sum of all items.
Average Calculates the standard unweighted average for all items.
Maximum Returns the maximum value.
Minimum Returns the minimum value.
Count Calculates the total number of all items.
Sample Variance Calculates the statistical sample variance of a specific sam-
ple of items.
Sample Standard Deviation Calculates the statistical standard deviation of a specific
sample of items.
Population Variance Calculates the statistical variance of the entire population of
items.
Population Standard Deviation Calculates the statistical standard deviation of the entire
population of items.
Distinct Count Calculates the number of distinct items. For instance, if two
different instances of “David” appeared in the list, they
would be counted only once.
Correlation Calculates a measure of the relation between two or more
items
Covariance Calculates a measure of the variance between two or more
items.
Weighted Average Calculates an average, weighted by the number of times an
item appears.
Median Calculates the statistical median of all items.
Nth Percentile Calculates the Nth percentile, where N is predefined number.
Nth Largest Returns the Nth largest item, where N is predefined number.
Nth Smallest Returns the Nth smallest item, where N is predefined number.
Mode Calculates the statistical mode of all items.
Nth Most Frequent Returns the Nth most frequent item, where N is a prede-
fined number.
The corresponding functions to these summary fields are also available in the formula language, so you
can also use them in complex formulas with branching and control structures if required. Keep in mind
that their use as a summary field will be limited only to a few options or parameters passed to each.
39
02 557300 Ch02.qxd 3/24/04 9:24 AM Page 40
Chapter 2
Using Analysis Features
In addition to simple summaries (which we have just looked at) and formulas (which are coming up in
Chapter 8, “Formulas and Logic”), we also have the ability to add a number of analysis features to our
report to help highlight information that may be important or otherwise missed. On the TopN tab of the
report expert, we have five options for adding a bit of analysis to our report.
Analysis Type Description
TopN Orders your report groups according to a summary field, where you
enter a number (N) and are presented with the TopN groups in order
from the largest to smallest (for instance, you could create a top 10
report based on last year’s sales, to show your best customers). You
can also use the options presented to discard the other records or
place them in their own group.
BottomN Will order your report groups according to a summary field, where
you enter a number (N) and are presented with the BottomN groups
(for instance, you could create a bottom 10 report, based on last
year’s sales, to show your worst customers). Similar to TopN, you
can use the options presented to group or discard the other records.
Sort All Will order your report groups according to a summary field, either
ascending or descending or by a top or bottom percentage, depend-
ing on the options you set.
Top Percentage Will order your report groups according to a summary field, where
you enter a percentage (N) and are presented with the Top Percent-
age of groups (for instance, you could create a Top 10 Percent report,
based on last year’s sales, to show the customers in the top 10 per-
centile). Similar to TopN, you can use the options presented to group
or discard the other records.
Bottom Percentage Will order your report groups according to a summary field, where
you enter a percentage (N) and are presented with the Bottom Per-
centage of groups (for instance, you could create a Bottom 10 Percent
report, based on last year’s sales, to show the customers in the lowest
10 percentile). Similar to BottomN, you can use the options presented
to group or discard the other records.
Keep in mind that all of these analysis options will be applied throughout your report and will apply to
any graphs or charts you might insert in the next step of the report expert.
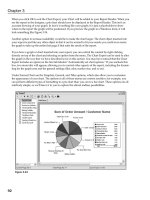
Charting and Graphing
For charting and graphing functionality, Crystal Reports .NET relies on a graphing engine created by 3-
D graphics. In the report experts as well as the designer itself, you can add a number of different graph
types to your report through the Chart tab, shown in Figure 2-12.
40