oil extraction and analysis phần 6 potx
Bạn đang xem bản rút gọn của tài liệu. Xem và tải ngay bản đầy đủ của tài liệu tại đây (1.18 MB, 18 trang )
Chapter 6
Oil Content Analysis: Myths and Reality
V.J. Barthet and J.K. Daun
Canadian Grain Commission, Grain Research Laboratory, Winnipeg, Manitoba R3C 3G8,
Canada
Abstract
The FOSFA (Federation of Oils, Seeds and Fats Associations Limited) extraction
method (harmonized as AOCS Am 2-93 or ISO 659) is considered to be the refer-
ence method to measure the oil content of oilseeds. The method is based on the
extraction of neutral lipids with hexane or petroleum ether, and the extracted com-
ponents are estimated gravimetrically and defined as crude fat or oil content. The
method requires a triplicate grind/extraction, making it lengthy and very detailed
for the analyst. Compared with other official methods (AOAC 996.06), the
FOSFA extraction method gave the highest oil recoveries in all oilseeds tested.
Accelerating the extraction through the use of new instrumentation, which com-
bines solvent extraction with a physical disruption such as pressure or microwave
heating, has not been able to give oil recovery equal to the FOSFA extraction.
Although the FOSFA method remains the reference method, both ISO and AOCS
have identified a need to develop new rapid methods for oil extraction that yield
oil equivalent to that from the FOSFA method and that can be used for determina-
tion of other factors such as methyl esters or free fatty acids. This study examined
the lipid components extracted by each stage of the FOSFA method: First
Extraction (FOSFA1), Second Extraction (FOSFA2), and Third Extraction
(FOSFA3). In a typical analysis, FOSFA1 accounted for ~86%, FOSFA2 for
~13.5%, and FOSFA3 for as much as 0.5% of the total oil extracted. Although
mainly triacylglycerols (TAG) were found, the extracts contained small amounts
of other lipid components including nonesterified fatty acids, partial glycerides,
fat-soluble vitamins, long-chain alcohols or aldehydes, and sterol or cholesterol
esters. More nonpolar material was extracted in the first early stage of the extrac-
tion, whereas the later stages contained more polar material. The oil in FOSFA1
and FOSFA2 contained close to 98% TAG based on methyl ester determination.
The analyses of the phosphorus content by graphite furnace atomic absorption
spectrophotometry showed that almost no phosphorus (below limit of detection)
was found in FOSFA1 and FOSFA2 oils but small amounts of phosphorus were
present in FOSFA3 oils. This indicates that only ~0.5% of phospholipids were pre-
sent in the FOSFA3 oils, suggesting that only very small amounts (<0.005%) of
phospholipids are extracted by the total method when the three extracts are com-
Copyright © 2004 AOCS Press
bined. Moreover, during the extractions of canola by the FOSFA method, the pro-
portion of triacylglycerol (TAG) with n-7 fatty acids increased with each step of
the process. These fatty acids are associated with the seed coat in canola seeds, and
the increase suggests that these structural lipids are the last lipids to be extracted.
Introduction
The term oil refers to a mixture of lipids that is liquid at room temperature and usu-
ally of plant origin. According to Gunstone and Herslöf (1), oil content is the ana-
lytical quantity of oil obtained from plant sources (seed or endosperm). It is
defined by both the source material and the extraction procedure. Different oil con-
tents may be obtained from the same seed sample if the extractions use organic sol-
vents of different polarity and/or different conditions of pressure and temperature.
For example, if other conditions are the same, using ethyl ether as the extraction
solvent will likely give a higher oil content than using petroleum ether because the
more polar ethyl ether extracts more polar lipids.
1
For an oil processor, there is a
direct relation between seed oil content and economic value. For soft oilseeds such
as canola, the relative value of oil to meal may be as large as 8:1. If canola oil is
sold at $500/tonne, the difference in value obtained between a tonne of seed at
40% oil and a tonne of seed at 41% oil is ~$5.
For a nutritional scientist, oil content is related to energy intake and is part of
the description of the nutritive value of the product. For a food scientist, oil content
is linked to important functional and organoleptic qualities of the food. For a
crusher, the oil content gives an estimate of the yield of a given batch; therefore,
the oil content is an economic characteristic of the oilseed trade. To satisfy all par-
ties involved in the oilseed trade, it is important to have an analytical method that
gives the real oil content of the seeds. Moreover, it is important to have this (these)
methods standardized.
For some researchers, however, it might be acceptable to give up a little bit of
accuracy and precision in favor of a very rapid method. For example, plant breeders
continually seek rapid methods for estimating oil content. In the 1930s, researchers at
the Canadian Grain Commission (2) developed a method using the refractive index of
a hexane extract of flax seed. Others used the relationship between seed density and
oil content (3) or the amount of oil expressed onto paper by a hydraulic press (4). For
rapeseed, the first really useful rapid method for oil content determination was the
method developed by Troëng (5), which was used at Svalöv to analyze as many as
60,000 samples/y (6). The method was adopted in Canada as the “Swedish” method.
A study carried out by the Associate Committee on Grain Quality in 1962 and 1963
1
It is important that the reader be aware of the difference between petroleum ether (also known as com-
mercial hexane, or by commercial names such as Skellysolve
TM
) and diethl ether. Petroleum ether is a
mixture of alkanes ranging from C
5
to C
8
and including branched chains defined by a boiling point
range (usually between 40 and 60°C). Diethyl ether is a true ether and is considered more polar in
nature than petroleum ether.
Copyright © 2004 AOCS Press
showed that the “Swedish” method recovered at least 1% more oil than the single
grind method used at the Grain Research Laboratory (Table 6.1).
These rapid extraction methods were replaced later by methods employing
spectroscopic techniques such as nuclear magnetic resonance and near infrared
spectroscopy. There is continued interest, however, in rapid extraction methods
that will give an oil and meal that can be used for further experimentation. A rapid
extractor, based on the Svalöv method, for small samples of seed was developed
by Agriculture Canada in the 1980s (7). More recent techniques such as supercriti-
cal fluid extraction (SFE) and accelerated solvent extraction have been proposed
for the measure of oil content. It is necessary for results from these new methods to
be compared with results from the reference method for oil content so that the pro-
posed new methods may be validated.The FOSFA (Federation of Oils, Seeds and
Fats Associations Limited) extraction method, harmonized as AOCS Am 2-93 and
ISO 659, is considered the reference method with which to measure oil content in
oilseeds by the international oilseed trade.
This chapter examines the techniques and apparatus associated with the refer-
ence method for oil content extraction. It also provides information on the compo-
sition of the oil extracted by the reference method and thus provides a benchmark
for studies using alternative methodologies. Some comparisons with other method-
ologies are provided, particularly the AOAC method commonly used for food
labeling and the AOCS SFE method. The relation between results from the refer-
ence method and the efficiency of commercial extraction is also discussed.
Soft and Hard Oilseeds. Oilseeds may be divided into groups that include soft
oilseeds, such as sunflower, safflower, canola, rapeseed, flax, and sesame, and hard
oilseeds, such as soybean and cottonseed. Certain oilseeds are more difficult to
extract than others (8). Soybeans, for example, are an example of an oilseed from
which it is relatively easy to extract the oil. Within the soft oilseeds, it is easier to
TABLE 6.1
Comparison of Ball-Milling and Simple Extraction Procedures for the Determination
of Oil Content in Rapeseed. Study by the Associate Committee on Grain Quality
a
1962 1963
Method (%)
Swedish
b
Mean 43.45 39.84
SD 0.74 0.30
Single grind/extraction
c
Mean 42.30 38.70
Difference 1.15 1.14
a
Reported in minutes of the 47th and 48th meetings of the Canadian Associate Committee on Grain Quality,
Appendices C14 and C11, respectively.
b
Six laboratories in 1962, five in 1963.
c
Results from the Grain Research Laboratory. Samples were ground on a flax mill (AOCS Af 3-54) and extracted for
8 h with petroleum ether on a Goldfisch extractor
.
Copyright © 2004 AOCS Press
remove the oil from relatively large seeds such as sunflower and safflower than
from smaller seeds such as rapeseed, sesame seeds, or flaxseeds. Particle size dis-
tribution has an important effect on the efficiency of the oil extraction and its rate.
Regrinding to reduce the particle size is a key process in the FOSFA extraction.
Small soft oilseeds may also be difficult to extract because the particle size has to
be smaller than their cell size so that the oil present in their cell structure is
released. The authors studied SFE to measure oil content and observed an impor-
tant matrix effect in soft oilseeds (9).
Apparatus for Extraction Methods of Oil Content Analysis
Several extractors are used to perform fat or oil extractions. The use of some
extractors is recommended by some official methods, whereas others are strictly
proscribed. The most common and unavoidable systems used for oil extraction in
an analytical laboratory are described in this chapter.
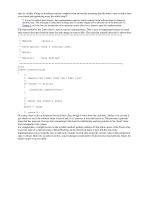
Butt Tube. In the Butt tube system, the sample is ground and a weighed portion is
placed into a porous thimble or folded into filter paper. The thimble or filter paper is
then placed into the Butt tube and the solvent is placed in the flask. The apparatus is
assembled as shown in Figure 6.1 and the solvent is boiled; vapors rise to the con-
denser where they condense and drip down through the sample back into the boiling
solvent below. The extraction process is continuous and can be completed within a
few hours, although exhaustive methods call for regrinding of the sample after the ini-
Fig. 6.1. Left: Butt tube extractor.
Right: Twisselman modification.
Water-cooled
condenser
Tapered cork
stopper
Extraction tube
Sample thimble
sets here
Tapered cork
stopper
50- or 100-mL
Soxhlet flask
Copyright © 2004 AOCS Press
tial oil has been removed and again near the end of the extraction. Once the extraction
is finished, the solvent is removed from the extracted oil by distillation followed by
vacuum drying. The extracted oil is weighed. The Goldfisch Fat Extractor (Labconco)
has long been recognized as a commercial version of the Butt tube system. An
improvement on the Butt tube is the Twisselman extractor, which adds a stopcock
between the sample container and the condenser. When the stopcock is closed, it is
possible to reclaim the solvent from the extracted material. The Twisselman extractor
is recommended in the German standard method (DGF B-I.5) (88).
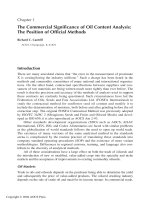
Soxhlet Extractor. In a Soxhlet extractor (Fig. 6.2), the solvent is heated in a boil-
er; the pure vapor rises up through a by-pass and into the top part of the Soxhlet
container where the sample to extract is contained. In the condenser, the vapors are
condensed and drip into the sample-containing thimble. When the level of liquid
reaches the same level as the top of the siphon, the liquid containing the extracted
material is siphoned back into the boiler. Soxhlet extraction is not a continuous
procedure, but a batch system with repeated extractions. Usually a minimum of
30–50 cycles is considered necessary to complete the extraction.
The use of a Soxhlet extractor is not recommended by the FOSFA method for
oil content analysis. The temperature of the solvent in the solvent vessel rises dur-
ing the extraction due to the presence of higher concentrations of oil in the solvent.
Eventually, the pure solvent siphoning into the hot extract may vaporize very
rapidly (“bump”), flooding the condenser and leading to a loss of oil and poor
recoveries.
Fig. 6.2. Soxhlet apparatus.
Condenser
By-pass tube
Sample chamber
Siphon
Receiving flask
Copyright © 2004 AOCS Press
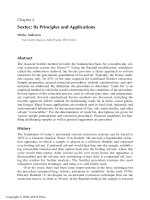
Immersion Extractors. Immersion extractors (Fig. 6.3) include the Soxtec
TM
sys-
tem manufactured by Foss-Tecatur and, more recently, a system manufactured by
Velp Scientificat. The original apparatus was designed by E. Randall and further
developed by Foss-Tecator. The method is a two-step procedure based on the best
parts of the Soxhlet and Twisselman methods. At the beginning of the extraction,
the ground sample is placed in a thimble and lowered into the boiling solvent
where the extractable material passes rapidly into the solvent. During the second
phase of the extraction, the sample is raised from the solvent and the condensed
vapors of the boiling solvent drip through the thimble containing the sample. In
this rinse position of the apparatus, there is a continuous supply of fresh solvent,
allowing the continuous increase of the concentration of extracted material in the
solvent recovered in the cup. Once the extraction is completed, the valve on the
drip tube may be closed so that the solvent can be recovered from the extract.
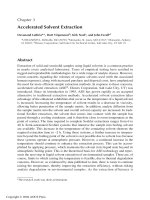
Wet Ball Mills (Tröeng Extractor, Dangoumeau
TM
Tubes). Ball mills are also
known as centrifugal or planetary mills (Fig. 6.4). For oilseeds, two ball mills are
currently in use. The ball mill proposed by Tröeng (5), and known in Canada as
“Swedish Tubes,” has been used in the ISO Method 10519 for determination of
chlorophyll and in the AOCS Method Am 2-93 (1997) for determination of oil
content (FOSFA) method. Unfortunately there do not appear to be any current
commercial suppliers for either mill, although the Tröeng apparatus can be manu-
factured by an efficient metal working shop. The use of a wet milling technique for
grinding soft oilseeds reduces particle size to <100 µm, resulting in efficient
extraction of the oil.
In the original Tröeng method, which was designed primarily for plant breed-
ing purposes, up to 3 g of whole seeds of small soft oilseeds were ground directly
in an accurately dispensed volume of petroleum ether. After 45 min, the tubes were
Fig. 6.3. Stages of operation
of the immersion extractor.
Immersion Rinsing Solvent recovery
Copyright © 2004 AOCS Press
set in an upright position and left for several hours until the fine flour had settled to
the bottom. An accurate aliquot was then placed in a weighed beaker and the sol-
vent removed by evaporation followed by vacuum drying. The beaker was
weighed and the oil content was calculated gravimetrically, taking into account the
contribution of the oil to the volume of the aliquot taken. A trained analyst could
achieve good accuracy and precision using this method. The method was adapted
to be used in extraction procedures as described above.
Effect of Particle Size. Grinding the sample is one of the most important steps in
oil content analysis. An excellent description of oilseed grinders is provided in the
second chapter of the classic book on oil analysis by Mehlenbacher (10). It is nec-
essary to reduce the particle size to as small as possible so as to disrupt the oil-
bearing cells and to allow the extraction solvent the opportunity to percolate
through the sample and contact all of the lipid material. An initial particle size of
≤2 mm for small seeds and 4 mm for large seeds has been recommended (8). For
most efficient extraction, the particle size should be reduced during the procedure
by microgrinding. A sufficiently small particle size is difficult to achieve with a
single grinding step. Coupling a blade or impact mill as the first step, followed by
wet ball milling with the Tröeng apparatus (Table 6.2) efficiently reduced the par-
ticle size of canola seeds to the required level. After the third grind, >70% of the
particles were <75 µm. In comparison, dry ball milling produced only 25%, grind-
ing with diatomaceous earth only 33%, and two grindings with a blade-type coffee
mill produced only 44% of particles with particle size <75 µm.
The ISO and IASC methods require the use of 80- to 100-mesh silver sand as
an adjunct to grinding, whereas the AOCS method for sunflower seed recommends
grinding in the presence of diatomaceous earth. One of the objectives of using sand
or diatomaceous earth is to scavenge oil that might be expressed in the grinding
operation. The use of wet ball mills reduces the loss of oil on the grinding appara-
tus because the apparatus is rinsed with the extraction solvent.
Fig. 6.4. Ball mills used for wet grinding
of oilseeds. Top, according to Tröeng
(Tröeng 1955 #16020); bottom,
Dangoumeau
TM
Ball Mill (ProLabo).
Copyright © 2004 AOCS Press
TABLE 6.2
Effect of the Grinding Procedure on the Particle Size of Canola (%)
FOSFA or AOCS Am 2-93 (with ball mill)
Coffee mill (first grind) Wet ball mill (second grind) Wet ball mill (third grind)
Particle size (µm) B. rapa B. napus Canola B. rapa B. napus Canola B. rapa B. napus Canola
>500 22.1 13.1 15.0 1.4 1.0 0.8 0.3 0.3 0.1
355–500 31.4 24.0 26.9 6.8 9.3 2.3 4.0 0.8 0.5
212–355 17.7 27.1 26.4 12.2 14.0 7.8 7.2 2.6
150–212 5.9 10.0 9.5 10.3 10.7 8.5 5.5 4.8 2.7
75–150 5.9 11.0 11.0 23.2 17.9 22.3 12.9 11.7 8.8
37–75 5.4 6.6 7.1 20.0 16.9 20.7 20.1 16.6 21.7
<37 12.5 8.3 4.2 26.0 30.3 37.7 50.0 63.4 63.5
Mikro-Samplmill
Repeated
Dry ball milling
with diatomaceous earth
coffee mill
Particle size (µm) First grind Second grind Third grind (AOCS Ai 3-75) First Second
>500 12.6 9.8 6.1 7.0 6.4 0.0
355–500 26.2 28.1 25.1 7.7 9.2 2.1
212–355 26.7 27.4 29.2 17.8 23.8 16.5
150–212 9.9 8.8 9.6 17.9 18.1 19.8
75–150 9.9 7.0 5.2 16.5 14.1 17.3
37–75 8.5 5.9 6.8 33.1 28.4 44.3
<37 6.2 12.9 18.0
Copyright © 2004 AOCS Press
Oil Recovery and Precision of Single vs. Multiple Extractions. Despite evi-
dence to show that multiple extractions are necessary to ensure that the oil recov-
ery from oilseeds is complete, methods have been developed that require only a
single grind and extraction step. An example of such a method was the AOCS
Method Ai 3-75 developed originally for sunflower seed but adopted for canola
and rapeseed in the early 1980s. This method required that the sample be ground in
the presence of diatomaceous earth, which was thought to provide not only a supe-
rior grind, but also to scavenge expressed oil from the grinding apparatus. As a part
of the Smalley Check Sample program, AOCS asked laboratories to test canola
samples by both the single grind method (Ai 3-75) and the (then) proposed FOSFA
multiple grind method. Results (Table 6.3) showed that the FOSFA method not
only gave a higher oil recovery than the single grind method but that the precision
of the FOSFA method was superior to the precision of the single grind method.
Official Methods
FOSFA Extraction Method (AOCS Am 2-93 and ISO 659)
The FOSFA extraction method is based on a three-stage grinding and extraction of
neutral lipids with hexane or petroleum ether. The extracted component is then
TABLE 6.3
Comparison of Oil Recovery and Precision for AOCS Ai 3-75 (1995) Single Grind
with Diatomaceous Earth and FOSFA [AOCS Am 2-93 (1997)] Triple Grind Methods
by Smalley Check Sample Participants (%)
Comparison of recoveries
AOCS FOSFA No. of
Smalley sample no. mean mean Difference Paired tP-value samples
1 42.41 42.85 0.44 –1.350 0.202 13
2 42.59 43.13 0.47 –1.500 0.159 13
3 41.72 42.33 0.63 –2.360 0.033 15
4 42.66 42.88 0.22 –0.680 0.500 13
5 42.70 43.06 0.36 –3.480 0.005 13
All 42.40 42.82 0.42 –3.520 0.001 67
Comparison of precision
No. of
Smalley sample no. AOCS SD
a
FOSFA SD
b
Ratio F-value P-value samples
1 1.48 0.93 1.59 2.55 0.118 13
2 1.29 0.34 3.79 12.42 0.002 13
3 0.98 0.43 2.28 4.96 0.005 15
4 0.98 1.09 0.90 1.61 0.400 13
5 0.59 0.59 1.00 1.00 0.990 13
All 1.11 0.77 1.44 2.10 0.002 67
a
A reproducibility SD of 0.78% was established for sunflower seed in AOCS Ai 3-74 (95).
b
A reproducibility standard deviation of 0.56% was established for rapeseed in AOCS Am 2-93 (1997).
Copyright © 2004 AOCS Press
estimated gravimetrically and defined as crude fat or oil content. The triplicate
extraction with grind and regrind makes the method time consuming and requires
great attention to detail on the part of the analyst. In comparison with other meth-
ods, the FOSFA extraction method gives the highest oil recoveries in all oilseeds
tested.
Recoveries of oil at each step of the FOSFA method (Table 6.4) give an indi-
cation of the rate of oil extraction and therefore an indication of the complexity or
ease of this extraction for various oilseeds. The ease with which oil can be recov-
ered from a particular oilseed can be estimated by the percentage of oil recovered
in the first extract. The combined first two extracts for all oilseeds recovered 99%
of the total oil. The third extract, except for yellow mustard, on average, recovered
<1% of the total oil.
The seeds from this study can be classed into three groups according to the
level of oil recovered in the first extract: (i) recoveries >90% in the first extract
(soybeans, the only hard oilseed in the study); (ii) recoveries ranging from 80 to
90% (solin, sunflower, flax, safflower, canola, and oriental mustard); all soft oil-
seeds; (iii) recoveries <80% [brown mustard (Brassica juncea) and yellow mustard
(Sinapis alba)], soft seeds that were also cited as difficult to extract in the SFE
study (9).
The hardness of the seed, soft oilseed vs. hard oilseed, plays an important role
in the effectiveness of the first extract and therefore in the difficulty of the oil
extraction. It was also suggested that the seed size plays a major role in oil extrac-
tion recoveries (8), but the present results show that seed size had only a small
effect on the oil recovery. Although there is a significant size difference between
sunflower or safflower and canola or flax, the difference in the oil recoveries of the
first extract was negligible. More importantly, there appears to be a matrix effect
on the oil extraction recovery. This matrix effect might be due to variables such as
hardness of the seed and oil body sizes or the oleosin and mucilage contents.
Some extracts from the study were converted to fatty acid methyl esters
(FAME) by base-catalyzed derivatization. In this transmethylation, the free fatty
acids (FFA) are not converted into FAME. Although this method leads to an
underestimation, it will be negligible in good quality oilseeds because the FFA are
<1%. The method is considered the best and the fastest method with which to
obtain FAME from oilseeds (11).
Along with several other oilseeds, Brassica napus contains a 18:1(n-7) isomer
along with the normal oleic acid 18:1(n-9) isomer. This fatty acid has been shown
to be the major 18:1 isomer in the fatty acid composition of the seed hull (12). The
separate hull and meat contents of the n-7 isomer were found to be independent of
the extraction stage (Table 6.5) but when the seed was extracted, the n-7 isomer
increased especially in the third extraction, suggesting that a significant portion of
the structural lipid of the hull was extracted during this last stage.
By including an internal standard (C
17
) in the GC analysis, it was possible to
demonstrate that the first two extracts contained between 100 and 93% acylglycerides
Copyright © 2004 AOCS Press
TABLE 6.4
Rate of Oil Removal from Different Oilseeds Using the FOSFA Method Expressed as a Percentage of the Total Oil Removed at Each
Stage. Summary of Studies Conducted in 1986–1987 and 2002
Oil 1st + 2nd
content
1st Extraction
a
(%) 2nd Extraction (%)
Extraction
3rd Extraction (%)
Mean Mean Max. Min. SD Mean Max. Min. SD Mean (%) Mean Max. Min. SD
Seed Tests (%)
Canola 114 43.6 85.1 100 67.8 7.8 14.2 30.8 0 7.5 99.3 0.8 1.6 0 0.4
Mustard
Brown 3 37.9 53.6 73.1 15.4 33.1 45.6 83.7 26.5 33.0 99.2 0.8 1 0.5 0.3
Oriental 5 41.4 81.7 83.1 80.1 1.3 17.6 19.2 16.3 1.2 99.3 0.6 0.8 0.5 0.1
Yellow 3 29.7 76.0 76.1 75.9 0.2 23.0 23.2 22.8 0.2 99.0 1.0 1.1 0.9 0.1
Flax 26 40.3 86.7 96.2 77.7 7.9 13.0 22.1 3.4 7.9 99.7 0.3 1 0 0.2
Solin 3 41.4 88.5 89.6 87.8 0.9 10.9 12.0 9.2 1.5 99.4 0.6 1.3 0.3 0.6
Sunflower 20 45.4 87.9 94.5 76.9 6.1 11.6 22.2 4.5 6.1 99.5 0.4 0.8 0.2 0.2
Safflower 10 33.9 85.7 99.1 59.5 15.6 14.1 40.3 0.9 15.7 99.8 0.2 0.8 0 0.3
Soybean 12 20.2 94.8 95.9 93.8 0.7 4.4 5.6 3.4 0.8 99.2 0.7 1.1 0.4 0.2
a
The lower values for the minimum first extraction (and consequent higher values for the second extraction) especially for canola samples may be due, in part, to varia-
tions in the extraction time
s.
Copyright © 2004 AOCS Press
(expressed as TAG), whereas the last extract (<1% of the total extract) contained
80% acylglycerides expressed as TAG (13).
HPLC analysis of lipid classes from the FOSFA extracts using a silica column
and a light scattering detector showed that all stages contained primarily nonpolar
lipids, mainly TAG, but depending on the seed quality, various amounts of diacyl-
glycerides (DAG), monoacylglycerides (MAG), and FFA. The relative contents
were 98.0, 1.1, 0.0, and 0.9% for TAG, MAG, DAG, and FFA, respectively, for
the first extract and 95.6, 1.8, 1.1, and 1.5%, respectively, for the pooled second
and third extracts. Small amounts of polar lipids such as phospholipids could also
be present, especially in the third extract. This is also suggested by the typical TLC
chromatograms of lipid classes from canola FOSFA extracts (Fig. 6.5). The materi-
al remaining at the origin showed some reactivity to phospholipid spray reagents.
No phospholipids were detected in the samples tested by HPLC.
AOAC 996.06 Method (Hydrolysis Extraction Methylation)
The AOAC Method 996.06 was developed in response to the U.S. 1990 Food
Labeling Act. The Act provides a specific definition for fat in food as the sum of
all fatty acids present in the analyzed food material expressed as the equivalent
TAG of all analytically measured fatty acids. The method consists of a hydrolysis
step with strong acid, which breaks down the matrices and allows the release of
lipids bound to proteins, sugars, and other molecules. The fat material is then extract-
ed by an organic solvent (diethyl ether). After removal of the organic solvent, the fat
TABLE 6.5
Relative Composition in 18:1(n-7) and 18:1(n-9) Acids from Canola Hull, Meat, and
Seed at Each Step of the FOSFA Extraction
Relative composition Relative composition
total fatty acid profile in 18:1
18:1(n-9) 18:1(n-7) 18:1(n-9) 18:1(n-7)
Sample (%)
Hull
Extraction 1 22.5 42.3 34.7 65.3
Extraction 2 22.0 42.3 34.3 65.7
Extraction 3 22.6 42.7 34.6 65.4
Meat
Extraction 1 59.2 2.6 95.8 4.2
Extraction 2 56.8 2.6 95.6 4.4
Extraction 3 45.4 2.5 94.8 5.2
Seed
Extraction 1 56.9 0.5 99.1 0.9
Extraction 2 54.4 2.2 96.1 3.9
Extraction 3 42.9 11.6 78.8 21.2
Copyright © 2004 AOCS Press
material is transesterified to form methyl esters using boron trifluoride (BF
3
)
.
. An
internal standard is added before the hydrolysis to correct for losses during the
analysis. In theory, this method should give the highest results for fat content
because all of the fatty acids from all lipids, neutral, polar, bound or free, are trans-
formed into FAME and then reported as TAG.
This method is especially designed to be applied to food. However, some
oilseeds, such as mustard and flax, are considered food material because they are
processed into food (mustard, flax muffin, flax bread, or flax cereals) and AOAC
996.06 can be applied to these seeds. Crude fat content results obtained by AOAC
996.06 were much lower than the results obtained by the FOSFA method (Fig.
6.6). In addition, a base-catalyzed transesterification was carried out on the FOSFA
extracts. The fat content was reported as in the AOAC 996.06 Method (as TAG).
Once again, these results were higher than the results obtained by the AOAC
996.06 Method (Fig. 6.6). It has been suggested that BF
3
, recommended for use in
the AOAC 996.06 Method, is not the best methylating agent (11). The reagent has
a limited shelf life and also forms many artifacts.
The use of the AOAC 996.06 Method to report the fat content of oilseeds used
directly in food could lead to much confusion for consumers. For example, the Flax
Council of Canada reports 41% fat in Canadian flaxseeds (www.flaxcouncil.ca/
Fig. 6.5. Thin-layer chromatogram of neutral lipids from first, second, and third extracts
using the FOSFA method on three different extractors. Solvent system: hexane/diethyl
ether/acetic acid (80/20/2). Reference samples: SE, sterol esters; ME, methyl esters; TAG,
triglycerides; FFA, free fatty acids; S, sterols.
SE
ME
TAG
FFA
S
1st 2nd 3rd 1st 2nd 3rd 1st 2nd 3rd
Butt tube Immersion Soxhlet Standards
Copyright © 2004 AOCS Press
flaxnut5.htm) on the basis of CGC Analysis of Crop Samples using FOSFA. On
the other hand, the U.S. Department of Agriculture reports a fat content of 34% for
flaxseed (www.nal.usda.gov/fnic/cgi-bin/list_nut.pl). It is readily apparent that this
method and other methods appropriate for food samples, such as fish or meat, are
not suitable for the oilseeds such as flax, mustard, or canola (13).
Supercritical Fluid Extraction (SFE)
Over the last decade, SFE has been investigated as a possible replacement for
hexane-based oil content determinations for oilseeds (14–19). “Liquid CO
2
” is the
most commonly used solvent for analytical SFE and mimics petroleum ether in
many of its characteristics. In addition, its polarity can be changed by the addition
of modifiers such as ethanol or methanol (20). CO
2
reverts to a gas at room tem-
perature and pressure and has low toxicity. Thus, SFE with CO
2
offers clear advan-
tages over organic solvents for oil extraction. Recently, we used (9) SFE with CO
2
to extract oil from soft oilseeds (flax, solin, canola, and mustard) using SFE-
method AOCS Am 3-96 and compared results with those obtained using the
FOSFA method (AOCS Am 2-93). Without the ethanol as a modifier, oil recover-
ies using SFE were 15–30% lower than oil contents obtained by the FOSFA
method for all the oilseeds tested (flax, canola. and mustard). To mimic more closely
the action that is occurring during the grinding/regrinding steps of the FOSFA extrac-
tion, the SFE method was modified to perform multiple compression/decompression
cycles to change the sample matrix, thus producing an effect similar to the use of an
Fig. 6.6. Comparison of the results obtained by AOAC 996.06, FOSFA, and analyses
of the FAME from FOSFA after base-catalyzed derivatization.
Oil content (%)
Oriental Brown Yellow 1 2 3 4 5 6 7 8 Solin 1 2 3 4
Mustard Canola Flax
FOSFA AOAC 996.06 GC analyses of the FAMES from FOSFA
50
45
40
35
30
25
20
Copyright © 2004 AOCS Press
expander in oilseed extraction. The best results were obtained with (i) five consec-
utive extractions of 20 min and (ii) two consecutive extractions of 30 min followed
by a third extraction of 30 min with 15% ethanol. Using these two modified meth-
ods, there was no significant difference between the results obtained by SFE and
FOSFA. The SFE oil recoveries were closer to FOSFA for flax, solin, and canola;
however, mustard oil recoveries were still lower than the recoveries using the
FOSFA method. By using the ethanol as a modifier, the polarity of the extraction
solvent increased and more polar material was extracted, thus producing a higher
oil recovery. However, further analysis showed that not all of the crude extract
obtained when ethanol was introduced was oil. The compression/decompression
cycle produced a crude extract containing only nonpolar lipids. With each com-
pression/decompression cycle during the SFE analysis, the sample matrix was
opened further to allow the CO
2
from the next extraction to reach more nonpolar
lipid. As in the FOSFA extraction, an important matrix effect was also observed
with mustard samples.
Originally, the AOCS Am 3-96 Method was tested mainly on soybeans. No
experiments comparing FOSFA extraction and SFE on other commodities were
reported before our own work. Given the lack of information available on this sub-
ject, many misconceptions exist with respect to the accuracy of these methods. In
the future, when extraction methods are being developed, it will be important to
test several types of seeds to determine whether the method can be applied to sev-
eral seed types and not just one commodity.
Comparison of Oil Content with Commercial Oil Extraction
One of the criticisms often aimed at the FOSFA method is that it “gives much
higher values than I recover in my crushing plant.” The analyst’s answer to this
comment is that the best approach is to have a method with a high degree of accu-
racy and precision against which you can measure your crush return. On the other
hand, it would be useful to determine how the FOSFA method compares with
extraction at a commercial crushing plant. In the common practice in Canada for
prepress solvent extraction methods, the gums are added back to the meal at the
end of desolventizing/toasting. This results in meals with ~3% neutral oil. To
obtain samples before the gums were added back, solid material leaving the extrac-
tion vessel (known as white flakes) was obtained from three different Canadian
crushing plants. Because the oil content was expected to be low, a two-stage
FOSFA extraction was performed on the white flakes. The extracted oil of the first
step was transesterified, and the FAME were analyzed by GC. A canola sample
was extracted at the same time to be used as a reference for comparison.
The residual oil of three commercial white flakes (Table 6.6) varied from 1.1
to 2.5% (dry weight) indicating that the extraction efficiency of the three crushing
plants varied slightly. As in previous experiments, the combined first two extrac-
tions for the seed recovered 99% oil whereas the third extraction recovered 1% of
the total oil (or ~0.5% absolute oil). The commercial extraction left from 1 to 2%
Copyright © 2004 AOCS Press
residual oil in the white flakes, suggesting that the commercial extraction has an
efficiency slightly lower than the combination of the first two FOSFA stages.
The oil obtained during the FOSFA extraction of the canola seed and the white
flakes was converted to FAME using base-catalyzed methylation in the presence of
an internal standard (tryheptadecanoin). GC analysis showed that ~95% of the
extract oil was made up of triacylglycerols. For the white flakes, the ratio of 18:1
(n-9) to 18:1(n-7) isomers was close to 1, suggesting that most of the residual
lipids extracted from the commercial white flakes were extracted from the hull and
not the meat. HPLC analysis of the lipids extracted from the white flakes showed
the extract to contain mainly TAG with small amounts of FFA and DAG. No phos-
pholipids were detected during the HPLC analysis.
Conclusion and Recommendations
The FOSFA method gave the highest oil recoveries compared with the AOAC
transesterification or the SFE extraction methods. A strong matrix effect was noted
for some oilseeds. The use of the AOAC method for determining total fat in
oilseeds such as flaxseed or mustard seed destined for food use should be discon-
tinued, and a method based on the FOSFA method should be used.
HPLC analyses of the FOSFA extracts showed that they contained close to
98% TAG, a result confirmed by GC analysis of the FAME from the FOSFA
extract. This evidence is counter to suggestions from its critics that FOSFA
extracts contain significant amounts of polar lipids because only trace amounts of
TABLE 6.6
Comparison of the FOSFA Extraction of Canola Seeds and FOSFA Extraction of
Commercial White Flakes
White flakes from commercial extraction
Canola seed Plant 1 Plant 2 Plant 3
Sample Oil recovery (%, dry basis)
1st extract 29.0
Commercial oil extraction
2nd extract 13.9 1.0 2.4 2.1
3rd extract 0.5 0.1 0.1 0.1
Total oil extracted 43.5 1.1 2.5 2.2
As triacylglycerides (%) in 2nd extract 91.2 96.6 93.9 96.2
Fatty acid composition (% of total fatty acids)
18:1(n-9) in 1st extract 56.9
18:1(n-7) in 1st extract 0.5
18:1(n-9) in 2nd extract 54.4 28.6 21.4 21.2
18:1(n-7) in 2nd extract 2.2 25.7 24.3 22.6
18:1(n-9) in 3rd extract 42.5
18:1(n-7) in 3rd extract 11.6
Copyright © 2004 AOCS Press
compounds other than nonpolar lipids were found; these were mainly tocols and
sterol esters because phospholipids were not detected by HPLC and only trace
amounts were found by TLC. The comparison of a canola extraction by FOSFA
and commercial extraction showed that commercial extraction gives amounts only
slightly lower than the combination of the first two FOSFA extracts.
Analytical methods should take into account the effect of seed type on the effi-
ciency of an extraction. Testing a new extraction method/technology on a single
commodity (e.g., soybeans or corn) does not guarantee that the method/technology
will be successfully applied to the other oilseeds.
Acknowledgments
Mr. Ken Howard provided assistance with the oil content analysis and with the thin layer
chromatography. Ms. Tricia Chornick provided assistance with the oil content analysis, the
HPLC analysis, and the gas chromatographic analysis. This is paper number C76 from the
Canadian Grain Commission, Grain Research Laboratory.
References
1. Gunstone, F.D., and Herslöf, B. (2000) Lipid Glossary 2, P.J. Barnes and Associates
and The Oily Press, Bridgewater, UK.
2. Geddes, W.F., and Lehberg, F.H. (1936) Flax Studies II. An Improved Refractometric
Method for Estimating the Oil Content of Flaxseed, Can. J. Res. 14: 45–61.
3. Zimmerman, D.C. (1962) The Relationship Between Seed Density and Oil Content in
Flax, J. Amer. Oil Chem. Soc. 39: 78–79.
4. Shewfelt, A.L., and Putt, E.D. (1958) A Rapid Method for Estimating the Oil Content
of Sunflower Seeds, Can. J. Plant Sci. 38: 419–423.
5. Troëng, S. (1955) Oil Determination of Oilseed. Gravimetric Routine Method, J. Am.
Oil Chem. Soc. 32: 124–126.
6. Appelqvist, L Å. (1967) Further Studies on a Multisequential Method for Determination of
Oil Content in Oilseeds, J. Am. Oil Chem. Soc. 44: 209–214.
7. Raney, J.P., Love, H.K., Rakow, G.F.W., and Downey, R.K. (1987) An Apparatus for
Rapid Preparation of Oil and Oil-Free Meal from Brassica Seed, Fat Sci. Technol. 89:
235–237.
8. Kershaw, S.J., and Hackett, F. (1987) Comparison of Three Standard Solvent Extraction
Procedures for the Determination of Oil Content in Commercial Oilseed Samples, J. Sci.
Food Agric. 40: 233–244.
9. Barthet, V.J., and Daun, J.K. (2002) An Evaluation of Supercritical Fluid Extraction as
Analytical Tool to Determine Fat in Flax, Solin, Canola and Mustard, J. Am. Oil Chem.
Soc. 79: 245–251.
10. Mehlenbacher, V.C. (1960) The Analysis of Fats and Oils, The Garrard Press, Publishers,
Champaign, IL.
11. Liu, K.S. (1994) Preparation of Fatty Acid Methyl Esters for Gas-Chromatographic
Analysis of Lipids in Biological Materials, J. Am. Oil Chem. Soc. 71: 1179–1187.
12. Hu, X., Daun, J.K., and Scarth, R. (1994) Lipids Containing C18:1(n-7) and C18:1(n-9)
Fatty Acids in Canola Seedcoat Surface and Internal Lipids, J. Am. Oil Chem. Soc. 71:
221–222.
Copyright © 2004 AOCS Press
13. Barthet, V.J., Chornick, T., and Daun, J.K. (2002) Comparison of Methods to Measure the
Oil Contents in Oilseeds, J. Oleo Sci. 51: 589–597.
14. Friedrich, J.P., List, G.R., and Heakin, A.J. (1982) Petroleum-Free Extraction of Oil from
Soybeans with Supercritical CO
2
, J. Am. Oil Chem. Soc. 59: 288–292.
15. Eggers, R. (1985) High Pressure Extraction of Oil Seed, J. Am. Oil Chem. Soc. 62:
1222–1230.
16. Taylor, S.L., King, J.W., and List, G.R. (1993) Determination of Oil Content in Oilseeds by
Analytical Supercritical Fluid Extraction, J. Am. Oil Chem. Soc. 70: 437–439.
17. Taylor, S.L., Eller, F.J., and King, J.W. (1997) A Comparison of Oil and Fat Content in
Oilseeds and Ground Beef Using Supercritical Fluid Extraction and Related Analytical
Techniques, Food Res. Int. 30: 365–370.
18. Dionisi, F., Hug, B., Aeschlimann, J.M., and Houllemar, A. (1999) Supercritical CO
2
Extraction for Total Fat Analysis of Food Products, J. Food Sci. 64: 612–615.
19. Devittori, C., Gumy, D., Kusy, A., Colarow, L., Bertoli, C., and Lambelet, P. (2000)
Supercritical Fluid Extraction of Oil from Millet Bran, J. Am. Oil Chem. Soc. 77: 573–579.
20. Luque de Castro, M.D., and Jiménez-Carmona, M.M. (2000) Where Is Supercritical Fluid
Extraction Going? Trends Anal. Chem. 19: 223–228.
Copyright © 2004 AOCS Press