oil extraction and analysis phần 12 pptx
Bạn đang xem bản rút gọn của tài liệu. Xem và tải ngay bản đầy đủ của tài liệu tại đây (8.19 MB, 33 trang )
Chapter 12
Near-Infrared Microspectroscopy, Fluorescence
Microspectroscopy, Infrared Chemical Imaging
and High-Resolution Nuclear Magnetic Resonance
Analysis of Soybean Seeds, Somatic Embryos and
Single Cells
I.C. Baianu
a,b,c
, D. Costescu
b,c
, T. You
a,b
, P.R. Lozano
a,b
, N.E. Hofmann
b
,
and S.S. Korban
d
a
Department of Food Science and Human Nutrition,
b
Agricultural Microspectroscopy NIR
and NMR Facility,
c
Department of Nuclear, Plasma and Radiological Engineering, and
d
Department of Natural Resources and Environmental Sciences, ACES College, University of
Illinois at Urbana-Champaign, IL 61801
Abstract
Novel methodologies are currently being evaluated for the chemical analysis of soy-
bean seeds, embryos, and single cells by Fourier transform infrared (FT-IR), Fourier
transform near-infrared (FT-NIR) microspectroscopy, fluorescence, and high resolu-
tion NMR (HR-NMR). The first FT-NIR chemical images of biological systems
approaching 1 µm resolution are presented here. Chemical images obtained by FT-
NIR and FT-IR microspectroscopy are presented for oil in soybean seeds and somatic
embryos under physiological conditions. FT-NIR spectra of oil and proteins were
obtained for volumes as small as 2 µm
3
. Related HR-NMR analyses of oil contents in
somatic embryos are also presented here with nanoliter precision. Such 400 MHz
1
H
NMR analyses allowed the selection of mutagenized embryos with higher oil content
(e.g., ~20%) compared with nonmutagenized control embryos. Moreover, develop-
mental changes in single soybean seeds and/or somatic embryos may be monitored by
FT-NIR with a precision approaching the picogram level. Indeed, detailed chemical
analyses of oils and phytochemicals are now becoming possible by FT-NIR chemical
imaging/microspectroscopy of single cells. The cost, speed, and analytical require-
ments of plant breeding and genetic selection programs are fully satisfied by FT-NIR
spectroscopy and microspectroscopy for soybeans and soybean embryos. FT-NIR
microspectroscopy and chemical imaging are also shown to be potentially important
in functional genomics and proteomics research through the rapid and accurate detec-
tion of high-content microarrays (HCMA). Multiphoton (MP), pulsed femtosecond
laser NIR fluorescence excitation techniques were shown to be capable of single mol-
ecule detection. Therefore, such powerful techniques allow highly sensitive and reli-
able quantitative analyses to be carried out both in vitro and in vivo. Thus, MP NIR
Copyright © 2004 AOCS Press
excitation for fluorescence correlation spectroscopy (FCS) allows not only single
molecule detection, but also molecular dynamics and high resolution, submicron
imaging of femtoliter volumes inside living cells and tissues. These novel, ultra-
sensitive, and rapid NIR/FCS analyses have numerous applications in important
research areas, such as agricultural biotechnology, food safety, pharmacology,
medical research, and clinical diagnosis of viral diseases and cancers.
Introduction
Infrared (IR) and near infrared (NIR) commercial spectrometers employ electro-
magnetic radiation in the range from ~150 to 4000 cm
–1
and from 4000 to ~14,000
cm
–1
, respectively. The utilization of such instruments is based on the proportion-
ality of IR- and NIR-specific absorption bands with the concentration of the molec-
ular components present, such as protein, oil, sugars, and/or moisture. The molecu-
lar bond’s stretching/vibrations, bending and/or rotations cause specific absorption
peaks or bands, centered at certain characteristic IR and NIR wavelengths. FT-
IR/NIR spectrometers obtain spectra using an interferometer and also utilize
Fourier transformation to convert the interferogram from the time domain to the
frequency domain. The use of interferometry in FT-IR and FT-NIR spectroscopy
increases the spectral resolution, the speed of acquisition, the reproducibility of the
spectra, and the signal-to-noise ratio compared with dispersive instruments that uti-
lize either prisms or diffraction gratings.
An FT-IR/NIR image is built up from hundreds, or even thousands of FT-
IR/NIR spectra and is usually presented on a monitor screen as a cross section that
represents spectral intensity as a pseudocolor for every microscopic point in the
focal plane of the sample. Special, 3D surface projection algorithms can also be
employed to provide more realistic representations of microscopic FT-IR/NIR
images. Each pixel of such a chemical image represents an individual spectrum
and the pseudocolor intensity codes regions with significantly different IR absorp-
tion intensities. In 2002, four commercial FT-IR/NIR instruments became avail-
able from Perkin-Elmer (Shelton, CT): an FT-NIR spectrometer (SpectrumOne-
NTS), an FT-NIR microspectrometer (NIR AutoImage), an FT-IR spectrometer
(SpectrumOne), and an FT-IR microspectrometer (Spotlight 300). The results of
the tests obtained using these four instruments are presented later in this chapter.
The employment of high-power, pulsed NIR lasers for visible fluorescence excita-
tion has resulted in a remarkable increase in the spatial resolution of microscopic
images of live cells, well beyond that available with the best commercial FT-NIR/IR
microspectrometers, and even allowing for the detection of single molecules. This hap-
pens because fluorescent molecules can absorb two NIR photons simultaneously
before emitting visible light, a process referred to as “two-photon excitation.” Using
two-photon NIR excitation (2PE) in a conventional microscope provides several
important advantages for studying biological samples. Because the excitation wave-
length is typically in the NIR region, these advantages include efficient background
Copyright © 2004 AOCS Press
rejection, very low light scattering, low photodamage of unfixed biological sam-
ples, and in vivo observation. Additionally, photobleaching is greatly reduced by
employing 2PE, and even more so in the case of three-photon NIR excitation
(3PE). The spatial region in which the 2PE process occurs is very small (on the
order of 1 fL, or 10
–15
L), and it decreases even further for 3PE. Multiphoton NIR
excitation allows submicron resolution to be obtained along the focusing (z) axis in
epifluorescence images of biological samples, without the need to employ any con-
focal pinholes. The 2PE and 3PE systems with ~150 fs (10
–13
s) NIR pulses have
several important advantages in addition to high resolution. First, they offer very
high sensitivity detection of nanomole to femtomole concentrations of appropriate-
ly selected fluorochromes. Second, these systems have very high selectivity and
the ability to detect interactions between pairs of distinctly fluorescing molecules
for intermolecular distances as short as 10 nm or less. 2PE and 3PE also allow one
to rapidly detect even single molecules through fluorescence correlation spec-
troscopy (FCS); FCS is usually combined with microscopic imaging. The princi-
ples of single photon FCS microscopy are discussed briefly below.
Principles
A complete understanding of the principles of chemical imaging as well as fluores-
cence microscopy that allow the quantitative analysis of biological samples is nec-
essary to interpret effectively and correctly the results obtained with these tech-
niques. The underlying principles of NIR and IR spectroscopy are discussed in
Chapter 11 of this book.
Principles of Chemical Imaging
Chemical, or hyperspectral, imaging is based on the concept of image hypercubes
that contain both spectral intensity and wavelength data for every 3-D image pixel;
these are created as a result of spectral acquisition at every point of the microscop-
ic chemical image. The intensity of a single pixel in such an image, plotted as a
function of the NIR or IR wavelength, is in fact the standard NIR/IR spectrum for
the selected pixel, and is usually represented as pseudocolor.
Principles of Fluorescence Correlation Spectroscopy/Imaging
The presentation adopted here for the FCS principle closely follows a brief
description recently developed by Eigen et al. (1). FCS involves a special case of
fluctuation correlation techniques in which a laser light excitation induces fluores-
cence within a very small (10
–15
L = 1 fL) volume of the sample solution whose
fluorescence is autocorrelated over time. The volume element is defined by the
laser beam excitation focused through a water- or oil-immersion microscope objec-
tive to an open, focal volume of ~10
–15
L. The sample solution under investigation
contains concentrations of fluorescent molecules in the range from 10
–9
to 10
–12
Copyright © 2004 AOCS Press
mol/L, and is limited only by detector sensitivity and available laser power. A non-
invasive determination of single-molecule dynamics can thus be made through
fluctuation analysis that yields either chemical reaction constants or diffusion coef-
ficients, depending on the system under consideration.
Fluorescent molecules in solution traversing the sample cell are excited for a
short time (on the order of 0.1–1 ms), as determined by their diffusion coefficients.
Slight changes in the diffusion coefficient can thus be measured by determining the
average decay time of the induced fluorescence light pulses. The outgoing fluores-
cence light is collected by the same objective, whereas laser light scattering is
blocked by a dichroic mirror, suitably selected band-pass filters, and by a confocal
pinhole in the image space (Fig. 12.1). The fluorescence light is then detected, and
the corresponding signal autocorrelation is digitized and recorded by a computer
with the help of a digital correlator card plugged into the computer board. Finally,
the experimental autocorrelation curve stored by the computer is fitted with a theo-
retical autocorrelation function that yields the diffusion times of the fluorescent
species present in the solution under investigation (Figs. 12.2 and 12.3).
There are four major fluorescence techniques that are currently employed for the
analysis and monitoring of molecular interactions and dynamics: fluorescence correla-
tion spectroscopy (FCS), fluorescence resonance energy transfer (FRET), fluorescence
lifetime imaging microscopy (FLIM), and fluorescence recovery after photobleaching
(FRAP). Both FCS and FRAP can determine diffusion coefficients or biochemical
reaction kinetics. FCS possesses several key advantages over FRAP; it is more sensi-
tive than FRAP and is able to detect dye concentrations on the order of 10
–6
to 10
–9
mol/L rather than 10
–6
to 10
–3
mol/L. Furthermore, FCS involves an equilibrium mea-
surement and is more sensitive than FRAP to fast diffusion.
FCCS: Cross-Correlation with Two Fluorescent Labels
A dual-color extension scheme of the standard confocal FCS setup enables one to
follow two or three different fluorescent species in parallel and opens up the possi-
bility for dual- or triple-color cross-correlation analysis. Because only doubly
Fig. 12.1. An experimental setup for a single-photon, confocal fluorescence correla-
tion spectroscopy, according to Eigen et al. (1).
Lens
Detector
Pinhole
Correlator
Parallel laserlight
Objective
Detection angle α
Lens
Sample
Dichroic Focus angle δ
Copyright © 2004 AOCS Press
labeled particles appear in the correlation curve in cross-correlation, the detection
selectivity can be improved dramatically (3). The idea behind the dual-color cross-
correlation scheme is to introduce separate fluorescence labels for the two reac-
tants, thus allowing simultaneous spectroscopic measurements of the two different
labels in two separate detection channels. Therefore, the amplitude of the cross-
correlation curve between the two channels depends only on the doubly labeled
product species, whose concentration increases during the reaction (Fig. 12.4).
A newly tested experimental scheme allowed the fluorescence cross-correla-
tion spectroscopy (FCCS) monitoring of reaction kinetics for fluorescently labeled
molecules in the nanomolar concentration range. With dual-color fluorescence
cross-correlation spectroscopy, the concentration and diffusion characteristics of
Fig. 12.3. Fluorescence intensity fluctuations caused by various dynamic processes
[adapted from Winkler et al. (2)].
Fig. 12.2. Autocorrelation function, and Tau plotted as a histogram and as a function
of time [adapted from Winkler et al. (2)].
FCS auto-correlates the relative Fluorescence Fluctuations:
G(τ) =
= 1 +
I(t) * I(t + τ)
<I>
<δI(t) * δI(t + τ)>
<I>
Fluorescence Intensity
Time (s)
G(Tau)
1/τ
D
τ
D
= 54
N
part
= 0.59
Tau
τ
Copyright © 2004 AOCS Press
two fluorescent species in solution, as well as their reaction products, can be fol-
lowed in parallel measurements. Such measurements were carried out using a confo-
cal, dual-beam FCS experimental setup, as illustrated in Figure 12.1. The detection
volume element was determined by a high numerical aperture, epi-illumination
microscope objective. To properly excite the two dyes, two laser beams must be
focused on the same spot, each defining an effective volume element for the corre-
sponding dye. Two spectrally separated avalanche diodes allowed wavelength-sensi-
tive detection of the emitted light. The determination of the binding fractions for both
labels is therefore considerably simplified, and changes in diffusion properties are no
longer necessary to discriminate between reactants and products.
Compared with autocorrelation measurement schemes in which only one reactant
species was labeled, the dual-color cross-correlation method provides an improved
estimate of the characteristic diffusion time constant of the product that prevails over
those of the smaller-sized reactants. By employing adequately designed instrumenta-
tion, the amplitude of the cross-correlation curve can be measured in direct proportion
to the product concentration. Thus, the concentration of the reaction product can be
determined directly from the cross-correlation amplitude (4).
As an example, the dye system could be designed to have a green species (G), a
red species (R), and an increasing fraction of green-and-red substance (GR) from the
Fig. 12.4. Illustration of the FCCS principle [adapted from Winkler et al. (2)].
G(Tau)
G(Tau)
Detector
Green
Detector
Red
Tau
+
+
τ
Tau
Tau
Autocorrelation
Autocorrelation
Cross-Correlation
Copyright © 2004 AOCS Press
reaction of both partners. Although pure G and R are recorded by only one detector,
GR is detected by both detectors. Cross-correlation of the detector signals thus pro-
vides the means to measure independently the fluorescent reaction product, GR.
Although the total fluorescence intensity remains constant under these conditions, the
measurements are performed with a concentration-dependent signal. Because G reacts
with R to form the product GR, the cross-correlation amplitude G
x
(0) is directly pro-
portional to the concentration of GR (because the denominator, the sum of both prod-
uct and reactant, remains constant over time). In contrast to the autocorrelation func-
tions, the temporal decay of G
x
is governed only by the diffusion properties of GR.
Experimental
The chemical image analysis of soybean embryos provides a powerful tool for in
vivo experimentation and genetic selection of improved single soybean seeds,
mutagenized somatic embryos, and single cells (5,6). In this study, intact soybean
seeds, soybean embryos, somatic embryos, and standard test samples were investi-
gated in the spectral range from 700 to 12,000 cm
–1
, with spectral resolutions up to
0.5 cm
–1
. Fluorescence correlation spectroscopy tests were conducted by employ-
ing two-photon NIR fluorescence excitation at 780 nm with a Ti: Sapphire laser
coupled to a recently designed FCS Alba
TM
microspectrometer system.
Plant Material Source
Soybean [Glycine max (L.) Merrill cv. Iroquois] seeds were collected from plants
grown in a greenhouse at the University of Illinois at Urbana-Champaign. Both
mature and immature seeds were used in this study. The former were harvested
from mature pods and used for FT-IR and FT-NIR microspectroscopy analyses.
The immature pods were harvested, surface-sterilized in a 1.09% sodium
hypochlorite solution (30% Clorox
TM
commercial bleach) containing a few drops
of Tween-20 followed by three rinses in sterile, deionized water. Immature cotyle-
dons (3–6 mm in length) were excised and the embryonic axis was removed.
Cotyledons were placed in a volume of 35 mL solidified initiation medium, in 15 ×
120 mm Petri dishes, with their long axes oriented upward. The medium consisted
of Murashige and Skoog (7) salts, B
5
vitamins (8), 3% sucrose, and 40 mg/L 2,4-
dichlorophenoxyacetic acid (2,4-D), solidified with 0.2% Gelrite
®
. The pH value
of the medium was adjusted to 7.0 with 1 N NaOH before autoclaving. Cultures
were incubated for 23 h under fluorescent light (40–60 µmol⋅ m
–2
⋅ s
–1
) at 25 ± 1°C.
An initiation period of 4–6 wk was used; somatic embryos were then transferred to a
fresh solid medium, containing 20 mg/L 2,4-D and an adjusted pH value of 5.7, to
promote proliferation for 4–8 wk. Subsequently, somatic embryos were placed in 35
mL of liquid medium containing MS salts, B
5
vitamins, 6% sucrose, 14 mmol/L glut-
amine, and 5 mg/L 2,4-D (pH value adjusted to 5.8). Biweekly subcultures were per-
formed to maintain the embryogenic culture in this liquid medium. Subsequently,
selected embryo cultures were treated with the chemical mutagen ethylmethane sul-
Copyright © 2004 AOCS Press
fonate (EMS) to induce mutants with modified oil and/or protein content following
the procedures described by Hofmann et al. (9). Briefly, an aliquot of 35 mL of liquid
medium containing 12 embryogenic clumps was inoculated with 1, 3, 10, or 30
mmol/L of EMS. Cultures were incubated with EMS for a period of 4 h with continu-
ous shaking on a rotary shaker (1200 rpm) at 28 ± 1°C. After incubation, embryogenic
clumps were rinsed three times with liquid medium and then individually placed into
12-well plates to evaluate the survival of somatic embryos. Cultures were progressive-
ly cultured biweekly. The surviving somatic embryos were maintained in D
2
O, blotted
on sterile filter paper, and weighed. Samples were transferred into 4 × 15 mm NMR
insert tubes (528PP Wilmand), each filled with 0.8 mL D
2
O. The insert tubes were
then placed into a 5-mm external diameter × 25-cm length tube, and used for FT-IR
and FT-NIR microspectroscopy analyses.
FT-IR and FT-NIR Microspectrometers
A microspectrometer is defined as a combination of a spectrometer and a microscope
that has both spectroscopic and imaging capabilities. Such an instrument is capable of
obtaining, for example, visible images of a sample using a CCD camera and chemical
images with an NIR detector. Chemical images are then employed for sophisticated
quantitative analyses (10). The results reported in this chapter for soybean seeds and
embryos were obtained with FT-IR and -NIR spectrometers made by Perkin-Elmer.
The FT-NIR (NTS model) spectrometer was equipped with an integrating sphere
accessory for diffuse reflectance. The FT-IR or -NIR spectrometers were attached to
microscopes for the IR region (Spotlight 300) or NIR region (NIR Autoimage), respec-
tively, as illustrated in Figures 12.5 and 12.6. Each spectrometer has an internal
desiccant compartment to remove from the air water vapor and carbon dioxide that
may interfere with the spectrum of a sample. Apart from the improved resolution
and acquisition time, these instrument models offer increased sensitivity and also
allow the transfer of spectra to different instruments of similar design. The two
Fig. 12.5. FT-IR microspectrometer (Spotlight 300) introduced by Perkin-Elmer in 2002.
Copyright © 2004 AOCS Press
microspectrometers are each equipped with two cassegrain imaging objectives and a
third cassegrain before the NIR detector to improve focus and sensitivity, as shown in
Figure 12.7.
High-Resolution NMR Method for Oil Determination
The technique applied to obtain the oil content in soybean embryos was simple,
one-pulse, high-resolution (HR) NMR (11). The HR-NMR technique is discussed
in Chapter 11. A Varian U-400 NMR instrument was employed for oil measure-
ments; the selected 90° pulse width was 19.4 µs, and the
1
H NMR signal absorp-
tion intensity was recorded with a 4-s recycling interval to avoid sample saturation.
Fluorescence Correlation Spectroscopy
This section presents submicron resolution imaging results that we obtained with
two-photon NIR excitation of FCS. The FCS data was obtained in the microscopy
suite of the Beckman Institute for Advanced Science and Technology at UIUC by
employing two-photon NIR fluorescence excitation at 780 nm with a 180 fs, Ti:
Sapphire pulsed laser, coupled to an FCS Alba
TM
spectrometer system (recently
designed and manufactured by ISS, Urbana, IL). The configuration of an Alba
TM
microscope is shown in Figure 12.8, and the optical detail path and the system
components are presented in Figure 12.9.
Multiphoton (MPE) NIR excitation of fluorophores, attached as labels to biopoly-
mers such as proteins and nucleic acids, or bound at specific biomembrane sites, is one
of the most attractive options in biological applications of laser scanning microscopy
(12). Many of the serious problems encountered in spectroscopic measurements of liv-
ing tissue, such as photodamage, light scattering, and autofluorescence, can be reduced
or even eliminated. FCS can therefore provide accurate in vivo and in vitro measure-
ments of diffusion rates, “mobility” parameters, molecular concentrations, chemical
Fig. 12.6. FT-NIR microspectrometer
(AutoImage) made by Perkin-Elmer in
2002.
Copyright © 2004 AOCS Press
Fig. 12.7. A simplified diagram of the reflection mode of operation for the AutoImage
FT-NIR microspectrometer, manufactured by Perkin-Elmer in 2002.
Fig. 12.8. The FCS Alba
TM
microspectrometer system manufactured by ISS (Urbana, IL).
The inverted, epifluorescence microscope shown in the figure in the Nikon TE-300 spe-
cial model, which has available both a back illumination port and a left-hand side port.
The PC employed for data acquisition, storage and processing is located behind the
instrument, as is the laser illumination source (not visible in the figure).
Detector
CCD camera
Detector cassograin
Detector mirror
Remote aperture
Base of microscope
M4
C2
C1
M3
Sample
Copyright © 2004 AOCS Press
kinetics, aggregation processes, labeled nucleic acid hybridization kinetics, and fluo-
rescence photophysics/photochemistry. Several photophysical properties of fluo-
rophores that are required for quantitative analysis of FCS in tissues have already been
reported (13). Molecular “mobilities” can be measured by FCS over a wide range of
characteristic time constants from ~10
–3
to 10
3
ms. At signal levels comparable to 1PE
confocal microscopy, 2PE reduces photobleaching in spatially restricted cellular com-
partments, thereby preserving the long-term signal-to-noise ratio during data acquisi-
tion (14). Furthermore, 3PE has been reported to eliminate DNA damage and photo-
bleaching problems that may still be present in some 2PE experiments. Although both
1PE and 2PE alternatives are suitable for intracellular FCS observations on thin bio-
logical specimens, 2PE can substantially improve FCS signal quality in turbid sam-
ples, such as plant cell suspensions or deep cell layers within tissues.
Results
FT-IR and FT-NIR Chemical Imaging Tests
A series of tests were conducted for both FT-NIR and FT-IR microspectrometers
to compare both their imaging speed and microscopic resolution (15,16). The
Fig. 12.9. Diagram of an FCS spectrometer coupled to an inverted epifluorescence
microscope [adapted from Eigen et al. (1)].
Focal spot of laser beam
Objective
Laser
Dichroic
mirror
Computer
with Correlator
Filter
Tube lens
Pinhole
Detector
Lens
Copyright © 2004 AOCS Press
results of such tests are presented in Figures 12.10 and 12.11, respectively, for the
Spotlight 300 model FT-IR, and in Figures 12.12 and 12.13, respectively, for the
FT-NIR AutoImage microspectrometer. It is important to note the absence of
spherical or chromatic aberrations in such images obtained with either the
Spotlight 300 (FT-IR) or the AutoImage FT-NIR microspectrometers. In addition,
one should also note that the spatial resolution increases dramatically to ~1 µm for
the shorter NIR wavelengths, even with relatively thick samples, such as a 1-cm
Zirconium single crystal (Fig. 12.12).
FT-IR and FT-NIR chemical images were acquired for mature soybeans (Fig.
12.14), and somatic or mature embryos, respectively, (Figs. 12.15, 12.16, and
12.7). Such microspectroscopic data can be employed to determine the distribution
of the major components (protein, fiber, oil, soluble carbohydrates, and water) of
soybean seeds and embryos at a spatial resolution approaching ~6 µm for the FT-
IR Spotlight 300 model, and at ~1 µm for the FT-NIR AutoImage data.
Oil Determination in Somatic Soybean Embryos by High-Resolution
1
H Nuclear Magnetic Resonance
High-resolution
1
H NMR measurements of oil were carried out with a U400 MHz
NMR spectrometer as described earlier. A complete, nanoliter (nL) range oil cali-
bration is reported here for soybean somatic embryos with a measurement preci-
sion of approximately ±0.1% oil (calculated as a percentage of oil from the total,
wet embryo weight). These are the first results reported of oil determination by
high-resolution NMR in soybean somatic embryogenic cultures. From a 105-sam-
ple lot investigated, 89 were considered valid for further growth and selection. A
summary is presented in Tables 12.1–12.4.
Fig. 12.10. FT-IR single wavenumber (761 cm
–1
) chemical images of 6-µm diameter
latex beads placed on an electron microscope grid. These FT-IR images were obtained
with the Spotlight 300 IR-microspectrometer using a total acquisition time of ~10 min,
and demonstrate both the high imaging speed and the microscopic resolution of this
novel-design instrument.
Copyright © 2004 AOCS Press
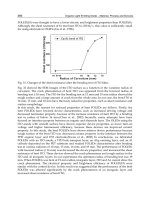
The corresponding quantity of oil in the embryos was calculated from a linear
fitting of the HR-NMR data in our standard plot of soybean oil shown in Figure
12.20 with the following equation: x = (y + 0.0092)/0.0029, where y was the nor-
malized value of the oil peak integral from the experimental NMR spectrum of
each sample (Fig. 12.21). The ratios of a chemical group proton signal other than
water protons, with respect to the water proton signal, and the wet mass of the
sample, were then compared with the oil standard plot to estimate the quantity of
oil present in soybean embryos. Tables 12.1–12.4 present the oil values obtained
from the high-resolution
1
H NMR spectra for somatic embryogenic soybean cul-
tures mutagenized with the specified concentration of ethylmethane sulfonate
(EMS). A TEM micrograph of mutagenized embryos is presented in Figure 12.22.
Fig. 12.12. Spatial resolution test: FT-NIR reflection mode image of a 1-cm, cubic zirconi-
um single crystal at a resolution of ~1 µm (plot of the band ratio: 7253–5485 cm
–1
).
Fig. 12.11. FT-IR image
resolution test: 3D surface
projection view of FT-IR
image of 10-µm diameter
spheres obtained with the
FT-IR Spotlight 300
microspectrometer.
Micrometers
Micrometers
Copyright © 2004 AOCS Press
Although the average oil values cannot be directly employed for selection pur-
poses, it remains significant that such values are in the high range for the somatic
embryos in the 10 mmol/L EMS group, as shown in Table 12.5. Therefore, the
group of somatic embryos treated with 10 mmol/L EMS contained more embryos
with oil contents in the higher range than the embryos in all the other groups.
Furthermore, the average oil content value of mutagenized soybean somatic
embryogenic cultures in the 10 mmol/L EMS group was significantly increased
relative to the control, nonmutagenized (EMS-untreated) embryos, by as much as
25% (Table 12.5). Three mutagenized somatic embryos in cultures selected from
the 105 samples measured had the highest oil contents of 27, 21, and 19 nL/mg.
Fig. 12.13. FT-NIR
microimaging of 25-µm
microarrays.
Fig. 12.14. FT-IR reflectance chemical images compared with the visible reflectance
image (middle picture) of a black-coated soybean obtained with a Perkin-Elmer Spotlight
300 chemical imaging/FPA microspectrometer. The soybean region labeled “Y” shows a
zone in which the black coat was removed, thus revealing the yellow soybean interior,
which has an IR absorption spectrum markedly different from that of the black coat region.
~ 5 µm IR
Resolution
3300
3200
3100
3000
2900
2800
2700
2600
2500
2400
2327.4
33873
Abs.
2.2164
2.1444
2.0755
2.0035
1.9283
1.8563
1.7874
1.7154
1.6403
1.5683
1.4994
Image
Overlay
Black
Coat
Yellow
Soy
Section
379.9 500 629.3
Micrometers
Micrometers
Copyright © 2004 AOCS Press
Limitations and Advantages of Spectroscopic
and Imaging Techniques
FT-NIR spectroscopy, in comparison with either FT-IR or (FT) HR-NMR, has sig-
nificantly lower spectral resolution. Although FT-NIR has lower sensitivity than
FT-IR, it is superior to HR-NMR in sensitivity, cost efficiency, and acquisition
speed. Fluorescence spectroscopy, on the one hand, has the highest sensitivity and
lowest resolution compared with all of the other spectroscopic techniques consid-
Fig. 12.15. FT-NIR chemical image of oil distribution in a mature soybean embryo section.
Fig. 12.16. Visible image of a soybean somatic embryo: sample at 9.6% moisture,
seen at 60× magnification.
Micrometers
Micrometers
Copyright © 2004 AOCS Press
TABLE 12.1
HR-NMR Results for the Control (0 mmol/L EMS) Soybean Embryo Group
Normalized oil Quantity Percentage
Number Embryo signal integral of oil in of oil in wet
EMS solution of mass in the 3 ppm–0 embryos embryos
concentration (mmol/L) Sample ID transients (mg) ppm region (nL/mg) (%)
0 6-29-0A2-10-5 500 9.80 0.0357 18 1.7
0 6-23-0A2-10-1 500 10.90 0.0269 14 1.3
0 7-11-0A2,0C2,8 500 10.79 0.0255 13 1.2
0 5-14-4HR-W0 500 7.82 0.0232 12 1.1
0 6-19-0A2-10-15 500 8.90 0.0196 11 1.0
0 4-3-0A6 500 20.52 0.0162 10 0.9
0 6-19-0B2-11-13 500 10.30 0.0153 9 0.8
0 6-19-0B1-10-15 500 11.20 0.0141 9 0.8
0 7-25-0A5,0B8,0C7 500 21.01 0.0119 8 0.7
06-26-0B5-12-4 500 14.80 0.0083 6 0.6
06-23-0B3-9-15 500 21.50 0.0072 6 0.6
06-26-0B1-12-4 500 24.80 0.0052 5 0.5
06-26-0B4-12-4 500 26.70 0.0040 5 0.5
0 6-23-0A3-11-2 500 19.50 0.0010 3 0.3
Copyright © 2004 AOCS Press
TABLE 12.2
HR-NMR Results for the 1 mmol/L EMS Group
Normalized oil Quantity Percentage
Number Embryo signal integral of oil in of oil in wet
EMS solution of mass in the 3 ppm–0 embryos embryos
concentration (mmol/L) Sample ID transients (mg) ppm region (nL/mg) (%)
1 4-3-1A10,11,1C7 500 7.61 0.0598 27 2.5
1 6-23-1A2-10-15 500 6.80 0.0451 21 1.9
1 6-23-1B4-10-15 500 6.70 0.0290 15 1.4
1 7-11-1A8,1B7 500 14.79 0.0254 13 1.2
1 7-25-1A10,1B2,6,7 500 10.91 0.0241 13 1.2
1 7-25-1C3,9 500 12.56 0.0214 12 1.1
1 6-19-1A5-10-5 500 11.40 0.0192 11 1.0
1 4-3-1A5,6,11-1B10 500 18.58 0.0137 9 0.8
1 6-19-1A7-11-2 500 11.80 0.0127 8 0.7
1 4-3-1A5-9-17-s 500 57.82 0.0067 6 0.6
1 6-19-1A12-11-13 500 11.90 0.0065 6 0.6
1 6-19-1A6-11-2 500 12.60 0.0013 3 0.3
Copyright © 2004 AOCS Press
TABLE 12.3
HR-NMR Results for the 10 mnol/L EMS Group
Normalized oil Quantity Percentage
Number Embryo signal integral of oil in of oil in wet
EMS solution of mass in the 3 ppm–0 embryos embryos
concentration (mmol/L) Sample ID transients (mg) ppm region (nL/mg) (%)
10 5-14-4HR-W10 500 6.32 0.0404 19 1.7
10 6-19-10B5-10-5 500 6.20 0.0354 17 1.6
10 7-25-10B1,9 500 5.41 0.0338 17 1.6
10 7-11-10A6 500 8.10 0.0285 15 1.4
10 4-24-10C1,4 500 8.66 0.0276 14 1.3
10 6-23-10A11-10-15 500 10.90 0.0275 14 1.3
10 7-11-10A6,11,10C4,5 500 13.41 0.0269 14 1.3
10 7-25-10B9 500 10.50 0.0213 12 1.1
10 7-11-10C5 500 7.20 0.0194 11 1.0
10 6-23-10B12-10-15 500 14.60 0.0093 7 0.6
10 6-26-10A1-12-4 500 22.60 0.0080 6 0.6
10 6-26-10B3-11-20 500 17.30 0.0079 6 0.6
10 6-26-10A2-11-2 500 16.30 0.0071 6 0.6
10 6-26-10A3-12-4 500 35.80 0.0065 6 0.6
10 6-23-10A8-11-20 500 14.00 0.0048 5 0.5
10 6-19-10A11-11-13 500 15.80 0.0028 4 0.4
10 6-19-10A5-11-13 500 18.00 0.0022 4 0.4
10 6-26-10B4-11-20 500 20.80 0.0021 4 0.4
10 6-23-10A10-10-9 500 17.40 0.0018 4 0.4
10 6-19-10A8-11-2 500 16.70 0.0017 4 0.4
Copyright © 2004 AOCS Press
TABLE 12.4
HR-NMR Results for the 30 mmol/L EMS Group
Normalized oil Quantity Percentage
Number Embryo signal integral of oil in of oil in wet
EMS solution of mass in the 3 ppm–0 embryos embryos
concentration (mmol/L) Sample ID transients (mg) ppm region (nL/mg) (%)
30 7-11-30A10,30C11 500 7.02 0.0595 27 2.5
30 4-3-30C5 500 9.59 0.0394 19 1.7
30 7-25-30A2 500 9.72 0.0165 10 0.9
30 4-24-30A4 500 7.37 0.0260 14 1.3
30 7-25-30B11 500 11.15 0.0153 9 0.8
30 6-29-30A9-10-5 500 13.50 0.0111 7 0.6
30 7-11-30C11 500 12.40 0.0104 7 0.6
30 7-25-30B2 500 15.25 0.0103 7 0.6
30 6-19-30A7-11-20 500 19.00 0.0097 7 0.6
30 6-26-30A12-12-4 500 22.00 0.0060 5 0.5
30 6-26-30A5-10-15 500 20.90 0.0058 5 0.5
30 6-26-30A2-11-20 500 14.80 0.0054 5 0.5
30 6-26-30B1-11-20 500 11.20 0.0039 5 0.5
30 6-26-30B6-12-4 500 28.20 0.0038 5 0.5
30 6-23-30A5-11-20 500 11.00 0.0028 4 0.4
30 6-19-30B10-11-20 500 20.50 0.0028 4 0.4
30 6-19-3-A5-11-13 500 12.30 0.0023 4 0.4
30 4-3-30C5-9-17-s 500 107.30 0.0017 4 0.4
30 4-3-30C5-9-17 500 107.30 0.0006 3 0.3
30 4-3-30C5-9-17-s 500 116.00 0.0006 3 0.3
30 6-19-30A3-11-13 500 34.10 0.0003 3 0.3
Copyright © 2004 AOCS Press
ered here. On the other hand, HR-NMR has the lowest sensitivity and the highest res-
olution compared with the other techniques specified here. Nevertheless, in compari-
son with all of the other techniques, HR-NMR has the advantage of allowing absolute,
internal calibrations; other techniques, such as dispersive NIR and FT-NIR require
both external calibration and extensive external validation with large data sets (17).
Because HR-NMR is considerably faster than wet chemistry analyses routinely
employed for calibration purposes with reference samples, it would be practical and
advantageous to employ HR-NMR as a primary method for FT-NIR calibrations;
TABLE 12.5
Average Values of Oil Content (Wet %) in Somatic Embryogenic Cultures of Soybean
Samples, Measured by 1PULSE
1
H NMR Experiments, and Variation Range
Embryo oil average values
0 mmol/L EMS 1 mmol/L EMS 3 mmol/L EMS 10 mmol/L EMS 30 mmol/L EMS
oil (%) oil (%) oil (%) oil (%) oil (%)
0.6 1.1 0.7 1.2 0.9
Norm. Range
0.3–1.7 0.3–2.5 0.4–1.1 0.4–1.7 0.3–2.5
Fig. 12.17. Transmission IR chemical image of a live soybean somatic embryo. The
arrow indicates the high intensity of the protein amide II absorption band.
1804.7
1700
1600
1500
1400
1300
12422
6631.0 6800 7000 7162.2
Micrometers
Micrometers
Abs.
0.6507
0.5914
0.5321
0.4728
0.4136
0.3543
0.2950
0.2357
0.1764
0.1171
0.0579
Copyright © 2004 AOCS Press
such an approach is reported here for the first time in conjunction with FT-NIR cali-
brations for both oil and protein determinations. Because of the lower instrumentation
costs, pulsed NMR methods (that is, time-domain, without employing FT) are current-
ly the ones selected by AOCS for oil and moisture determinations in whole seeds, in
spite of their lower resolution compared with either HR-NMR or FT-NIR.
FT-IR and FT-NIR chemical imaging methods are also capable of quantitative
determination of constituent concentrations, but on a microscopic scale, and with
much higher spatial resolution than, for example, NMR imaging. However, as
shown in Figures 12.14, 12.18, and 12.19, FT-NIR/IR reflectance spectroscopy
encounters problems with black, green, brown, or red coat, whole soybeans (or
other seeds), as a result of the limited penetration of NIR and IR wavelength radia-
tion through the dark color coats. On the other hand, certain fluorescence spec-
troscopy-imaging methods (such as FCS and FCCS) are at present capable of still
higher microscopic resolution than either FT-NIR or FT-IR chemical imaging; the
trade-off here is between the high sensitivity/rapid detection and the overall, lower
spectral resolution/lower chemical selectivity of fluorescence spectroscopy-imag-
ing methods (vs. either FT-NIR or FT-IR chemical imaging).
The major, practical advantages of FT-NIR spectroscopy for quantitative deter-
mination of oil, protein, moisture, and perhaps other seed constituents are as follows:
speed, accuracy, reproducibility, convenience (i.e., little or no sample preparation),
and relatively low cost (compared with both pulsed and HR- NMR). A significant
advantage of the data sets/results obtained by adequately calibrated FT-NIR, even in
comparison with those obtained by wet chemistry, analytical methodology, is the high
Fig. 12.18. FT-NIR reflectance chemical image of a red coat bean (Vigna angularis)
and a section without the red coat (left, below diagonal).
Arb.
1.3102
1.3019
1.2936
1.2854
1.2771
1.2688
1.2605
1.2522
1.2440
1.2357
1.2274
1870.0
1850
1800
1750
1700
1650
1600
1570.0
–22174.0 –22100 –22000 –21900 –21774.0
Micrometers
Micrometers
Copyright © 2004 AOCS Press
internal consistency of the FT-NIR results for large numbers of normal, yellow-coat,
soybean seed samples. This advantage is very important both for soybean breeding/
selection programs and for wide-scale industrial applications of NIR composition
analysis throughout the entire soybean distribution and processing chain. The major
practical limitations of FT-NIR spectroscopy are the need for primary/reference meth-
ods, the need for adequate calibration models/data preprocessing, and its lower resolu-
tion (compared with either FT-IR or HR-NMR).
Other Applications
The following discussion illustrates the major improvements in spatial resolution
and sensitivity that have become possible with femtosecond, pulsed NIR excitation
of FCS and FCCS imaging techniques.
Two-Photon FCS Observations on Plant Cells and Thylakoids
The application of two-photon NIR excitation FCS to plant cells and thylakoids in sus-
pensions is presented here to illustrate the capabilities of 2PE measurements in live
cells and intracellular membranes. The measurements have reasonable signal-to-noise
ratios, even with very low fluorescent probe concentrations such as a single molecule
present in one femtoliter volume excited by the ultra-short (femtosecond) laser NIR
(780 nm) pulses. Representative results are shown in Figures 12.23–12.26.
Fig. 12.19. FT-NIR chemical imaging by difference spectroscopy (CIDS): red coat spectra
minus the yellow, undercoat section spectra.
Section
without coat
Difference = Red
Coat minus
Yellow Section
cm
–1
Copyright © 2004 AOCS Press
FCCS Applications to DNA Hybridization, Polymerase Chain
Reaction, and DNA Binding
In the bioanalytical and biochemical sciences, FCS can be used to determine vari-
ous thermodynamic and kinetic properties, such as association and dissociation
constants of intermolecular reactions in solution (18,19). Examples of this are spe-
cific hybridization and renaturation processes between complementary DNA or
RNA strands, as well as antigen-antibody or receptor-ligand recognition. Although
of significant functional relevance in biochemical systems, the hybridization mech-
anism of short oligonucleotide DNA primers to a native RNA target sequence
could not be investigated in detail before the FCS/FCCS application to these prob-
lems. Most published models agree that the process can be divided into two steps,
a reversible first initiating step, in which few base pairs are formed, and a second
irreversible phase described as a rapid zippering of the entire sequence. By com-
peting with the internal binding mechanisms of the target molecule such as sec-
ondary structure formation, the rate-determining initial step is of crucial relevance
for the entire binding process. Increased accessibility of binding sites, attributable
to single-stranded open regions of the RNA structure at loops and bulges, can be
quantified using kinetic measurements (20).
The measurement principle for nearly all of our FCS/FCCS applications is based
so far upon the change in diffusion characteristics when a small labeled reaction partner
(e.g., a short nucleic acid probe) associates with a larger, unlabeled one (target
DNA/RNA). The average diffusion time of the labeled molecules through the illumi-
Fig. 12.20. The soybean oil standard plot from 400 MHz
1
H NMR measurements on the
Varian U400. The probe was a Nalorac 5-mm QUAD for high-resolution liquids
1
H NMR.
y = 0.0029x – 0.0092
R
2
= 0.916
Normalized oil signal integrals
Weight of oil (µg)
Copyright © 2004 AOCS Press
nated focal volume element is inversely related to the diffusion coefficient, and increas-
es during the association process. By calibrating the diffusion characteristics of free and
bound fluorescent partners, the binding fraction can be easily evaluated from the corre-
lation curve for any time of the reaction. This principle has been employed to investi-
gate and compare the hybridization efficiency of six labeled DNA oligonucleotides
with different binding sites to an RNA target in a native secondary structure (20).
Hybridization kinetics were examined by binding six fluorescently labeled
oligonucleotide probes of different sequence, length, and binding sites to a 101-
nucleotide-long native RNA target sequence with a known secondary structure
(Fig. 12.27). The hybridization kinetics were monitored and quantitated by FCS to
investigate the overall reaction mechanism. In this “all-or-none” binding model,
the expected second-order reaction was assumed to be irreversible. For nanomole
concentrations and at temperatures of ~40°C, the typical half-value reaction times
for these systems are in the range of 30–60 min; therefore, the hybridization
process could be easily followed by FCS diffusional analysis. At the measurement
temperature of 40°C, the probes are mostly denatured, whereas the target retains its
native structure. The binding process could be directly monitored through diffu-
Fig. 12.21.
1
H NMR spectrum of the somatic embryogenic culture of a soybean sample
(10A10). The
1
H NMR spectra were collected with a Varian U400 spectrometer and a
Nalorac 5 mm
1
H Quad probe tuned at a 400 MHz resonance frequency in an external
magnetic field of 9.4 T (with FT of 500 NMR transients). Several broad absorption bands
are present between 0 and 3 ppm, whereas several
1
H NMR sharp peaks of oil are located
between 3.1 ppm and 4.3 ppm. The
1
H NMR peak of water (HDO) is located at 4.7 ppm.
Copyright © 2004 AOCS Press
sional FCS analysis via the change in translational diffusion time of the labeled 17-
mer to 37-mer oligonucleotide probes HS1–HS6 upon specific hybridization with
the larger RNA target (Fig. 12.27). The characteristic diffusion time through the
laser-illuminated focal spot of the 0.5 µm-diameter objective increased from 0.13
to 0.20 ms for the free probe, and from 0.37 to 0.50 ms for the bound probe within
60 min. The increase in diffusion time from measurement to measurement over the
60 min could be followed on a PC monitor and varied strongly from probe to
probe. HS6 showed the fastest association, whereas the reaction of HS2 could not
be detected at all for the first 60 min. It has been shown above that FCS diffusional
analysis provides an easy and comparably fast determination of the hybridization
time course of reactions between complementary DNA/RNA strands in the con-
centration range from 10
–10
to 10
–8
mol/L. Perturbation of the system is therefore
not necessary, so that the measurement can be carried out at thermal equilibrium.
Thus, the FCS-based methodology also permits rapid screening for suitable anti-
sense nucleic acids directed against important targets such as HIV-1 RNA with low
consumption of probes and target.
Because of the high sensitivity of FCS detection, the same principle can be
exploited to simplify the diagnostics for extremely low concentrations of infectious
agents such as bacterial or viral DNA/RNA. By combining confocal FCS with bio-
chemical amplification reactions such as PCR or 3SR, the detection threshold of
infectious RNA in human sera could be lowered to concentrations of 10
–18
mol/L
(21,22). The method is useful in that it allows for simple quantitation of initial
Fig. 12.22. TEM micrograph of a suspension of soybean somatic embryos in culture (after
treatment with 1 mmol/L ethylmethane sulfonate). Oil droplets (visible at arrows) are dis-
tributed inside embryos, and were more frequent in mutant soybean embryos with higher
oil contents.
Copyright © 2004 AOCS Press