Diffusion Solids Fundamentals Diffusion Controlled Solid State Episode 1 Part 4 potx
Bạn đang xem bản rút gọn của tài liệu. Xem và tải ngay bản đầy đủ của tài liệu tại đây (528.96 KB, 25 trang )
4.1 Random Walk and Diffusion 61
R
2
=
n
i=1
r
2
i
+2
n−1
i=1
n
j=i+1
r
i
r
j
,
X
2
=
n
i=1
x
2
i
+2
n−1
i=1
n
j=i+1
x
i
x
j
. (4.20)
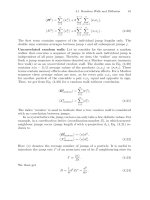
The first term contains squares of the individual jump lengths only. The
double sum contains averages between jump i and all subsequent jumps j.
Uncorrelated random walk: Let us consider for the moment a random
walker that executes a sequence of jumps in which each individual jump is
independent of all prior jumps. Thereby, we deny the ‘walker’ any memory.
Such a jump sequence is sometimes denoted as a Markov sequence (memory
free walk) or as an uncorrelated random walk. The double sum in Eq. (4.20)
contains n(n − 1)/2 average values of the products x
i
x
j
or r
i
r
j
.These
terms contain memory effects also denoted as correlation effects. For a Markov
sequence these average values are zero, as for every pair x
i
x
j
one can find
for another particle of the ensemble a pair x
i
x
j
equal and opposite in sign.
Thus, we get from Eq. (4.20) for a random walk without correlation
R
2
random
=
n
i=1
r
2
i
,
X
2
random
=
n
i=1
x
2
i
. (4.21)
The index ‘random’ is used to indicate that a true random walk is considered
with no correlation between jumps.
In a crystal lattice the jump vectors can only take a few definite values. For
example, in a coordination lattice (coordination number Z), in which nearest-
neighbour jumps occur (jump length d with x-projection d
x
), Eq. (4.21) re-
duces to
R
2
random
=
n
d
2
,
X
2
random
=
n
d
2
x
. (4.22)
Here n denotes the average number of jumps of a particle. It is useful to
introduce the jump rate Γ of an atom into one of its Z neighbouring sites via
Γ ≡
n
Zt
. (4.23)
We then get
D =
1
6
d
2
ZΓ =
d
2
6¯τ
. (4.24)
62 4 Random Walk Theory and Atomic Jump Process
Table 4.1. Geometrical properties of cubic Bravais lattices with lattice parameter a
Lattice Coordination number Z Jump length d
Primitive cubic 6 a
Body-centered cubic (bcc) 8 a
√
3/2
Face-centered cubic (fcc) 12 a
√
2/2
This equation describes diffusion of interstitial atoms in a dilute interstitial
solid solution
1
.Thequantity
¯τ =
1
ZΓ
(4.25)
is the mean residence time of an atom on a certain site. For cubic Bravais
lattices, the jump length d and the lattice parameter a are related to each
other as indicated in Table 4.1. Using these parameters we get from Eq. (4.24)
D = a
2
Γ. (4.26)
4.1.4 Correlation Factor
Random walk theory, to this point, involved a series of independent jumps,
each occurring without any memory of the previous jumps. However, several
atomic mechanisms of diffusion in crystals entail diffusive motions of atoms
which are not free of memory effects. Let us for example consider the vacancy
mechanism (see also Chap. 6). If vacancies exchange sites with atoms a mem-
ory effect is necessarily involved. Upon exchange, vacancy and ‘tagged’ atom
(tracer) move in opposite directions. Immediately after the exchange the va-
cancy is for a while available next to the tracer atom, thus increasing the
probability for a reverse jump of the tracer. Consequently, the tracer atom
does not diffuse as far as expected for a completely random series of jumps.
This reduces the efficiency of a tracer walk in the presence of positional mem-
ory effects with respect to an uncorrelated random walk.
Bardeen and Herring in 1951 [7, 8] recognised that this can be ac-
counted for by introducing the correlation factor
f = lim
n→∞
R
2
R
2
random
= 1 + 2 lim
n→∞
n−1
i=1
n
j=i+1
r
i
r
j
n
i=1
r
2
i
,
1
In a non-dilute interstitial solution correlation effects can occur, because some
of the neighbouring sites are not available for a jump.
4.1 Random Walk and Diffusion 63
f
x
= lim
n→∞
X
2
X
2
random
= 1 + 2 lim
n→∞
n−1
i=1
n
j=i+1
x
i
x
j
n
i=1
x
2
i
. (4.27)
The correlation factor in Eq. (4.27) equals the sum of two terms: (i) the
leading term +1, associated with uncorrelated (Markovian) jump sequences
and (ii) the double summation contains the correlation between jumps. It
has been argued above that for an uncorrelated walk the double summation
is zero.
Diffusion in solids is often defect-mediated. Then, successive jumps occur
with higher probability in the reverse direction and the contribution of the
double sum is negative. Equation (4.27) also shows that one may define the
correlation factor as the ratio of the diffusivity of tagged atoms, D
∗
,and
a hypothetical diffusivity arising from uncorrelated jump sequencies, D
random
,
via
f ≡
D
∗
D
random
. (4.28)
Correlation effects are important in solid-state diffusion of crystalline mate-
rials, whenever diffusion is mediated by a diffusion vehicle (see Table 4.2).
Examples for diffusion vehicles are vacancies, vacancy pairs, self-interstitials,
etc. An equivalent statement is to say, there must be at least three identi-
fiable ‘species’ involved in the diffusion process. For example, during tracer
diffusion via vacancies in pure crystals, the three participating ‘species’ are
vacancies, host atoms, and tracer atoms. Interstitial diffusion in a dilute in-
terstitial solution is uncorrelated, because no diffusion vehicle is involved.
Let us consider once more diffusion in a cubic Bravais lattice. When cor-
relation occurs, Eq. (4.24) must be replaced by
D
∗
=
1
6
fd
2
ZΓ = fa
2
Γ. (4.29)
We will return to the correlation factor in Chap. 7, after having introduced
point defects in Chap. 5 and the major mechanisms of diffusion in crystals
in Chap. 6.
Table 4.2. Correlation effects of diffusion for crystalline materials
f = 1 Markovian jump sequence
No diffusion vehicle involved: direct interstitial diffusion
f<1 Non-Markovian jump sequence
Diffusion vehicle involved: vacancy, divacancy, self-interstitial, . . .
mechanisms
64 4 Random Walk Theory and Atomic Jump Process
4.2 Atomic Jump Process
In preceding sections, we have considered many atomic jumps on a lat-
tice. Equally important are the rates at which jumps occur. Let us take
a closer look to the atomic jump process illustrated in Fig. 4.3. An atom
moves into a neighbouring site, which could be either a neighbouring va-
cancy or an interstitial site. Clearly, the jumping atom has to squeeze be-
tween intervening lattice atoms – a process which requires energy. The en-
ergy necessary to promote the jump is usually large with respect to the
thermal energy k
B
T . At finite temperatures, atoms in a crystal oscillate
around their equilibrium positions. Usually, these oscillations are not vio-
lent enough to overcome the barrier and the atom will turn back to its ini-
tial position. Occasionally, large displacements result in a successful jump
of the diffusing atom. These activation events are infrequent relative to
the frequencies of the lattice vibrations, which are characterised by the De-
bye frequency. Typical values of the Debye frequency lie between 10
12
and
10
13
s
−1
. Once an atom has moved as the result of an activation event, the
energy flows away from this atom relatively quickly. The atom becomes de-
activated and waits on the average for many lattice vibrations before it
jumps again. Thermally activated motion of atoms in a crystal occurs in
a series of discrete jumps from one lattice site (or interstitial site) to the
next.
The theory of the rate at which atoms move from one site to a neighbour-
ing one was proposed by Wert [9] and has been refined by Vineyard [10].
Vineyard’s approach is based upon the canonical ensemble of statistical me-
chanics for the distribution of atomic positions and velocities. The jump
process can be viewed as occurring in an energy landscape characterised by
Fig. 4.3. Atomic jump process in a crystalline solid: the black atom moves from an
initial configuration (left) to a final configuration (right) pushing through a saddle-
point configuration (middle)
4.2 Atomic Jump Process 65
the difference in Gibbs free energy G
M
between the saddle-point barrier and
the equilibrium position (Fig. 4.3). G
M
is denoted as the Gibbs free energy
of migration (superscript M) of the atom. It can be separated according to
G
M
= H
M
− TS
M
, (4.30)
where H
M
denotes the enthalpy of migration and S
M
the entropy of migra-
tion. Using statistical thermodynamics, Vineyard [10] has shown that the
jump rate ω (number of jumps per unit time to a particular neighbouring
site) can be written as
ω = ν
0
exp
−
G
M
k
B
T
= ν
0
exp
S
M
k
B
exp
−
H
M
k
B
T
, (4.31)
where ν
0
is called the attempt frequency. It is of the order of the Debye
frequency. Its rigorous meaning is as follows: ν
0
is the vibration frequency
around the equilibrium site but in the direction of the reaction path. The
entropy of migration corresponds to the change in lattice vibrations associ-
ated with the displacement of the jumping atom from its equilibrium to the
saddle point configuration. Vineyard’s treatment also provides an expression
for the migration entropy:
S
M
= k
B
⎡
⎣
3N−1
j=0
ln
hν
j
k
B
T
A
−
3N−1
j=0
ln
hν
j
k
B
T
SP
⎤
⎦
. (4.32)
The ν
j
are the 3N − 1 normal mode frequencies for vibrations around the
equilibrium site A while ν
j
are the frequencies of the system when it is con-
strained to move within the hyperface which passes through the saddle point
(SP) perpendicular to the jump direction.
The theory of the rates at which atoms move from one lattice site to
another covers one of the fundamental aspects of diffusion. For most practical
purposes, a few general conclusions are important:
1. Atomic migration in a solid is the result of a sequence of localised jumps
from one site to another.
2. Atomic jumps in crystals usually occur from one site to a nearest-
neighbour site. Molecular dynamic simulations mostly confirm this view.
Multiple hops are rare, although their occurrence is indicated in some
model substances. Jumps with magnitudes larger than the nearest-
neighbour distance are more common on surfaces or in grain boundaries
(see Chap. 32).
3. The jump rate ω has an Arrhenius-type dependence on temperature as
indicatedinEq.(4.31).
4. The concept of an atomic jump developed above applies to all the diffu-
sion mechanisms discussed in Chap. 6. Of course, the values of G
M
,H
M
,
66 4 Random Walk Theory and Atomic Jump Process
and S
M
depend on the diffusion mechanism and on the material under
consideration:
For interstitial diffusion, the quantities G
M
, H
M
,andS
M
pertain to the
saddle point separating two interstitial positions. For a dilute interstitial
solution, virtually every interstitial solute is surrounded by empty inter-
stitial sites. Thus, for an atom executing a jump the probability to find
an empty site next to its starting position is practically unity.
For vacancy-mediated diffusion, G
M
, H
M
,andS
M
pertain to the saddle-
point separating the vacant lattice site and the jumping atom on its
equilibrium site.
5. There are cases – mostly motion of hydrogen in solids at low tempera-
tures – where a classical treatment is not adequate [16]. However, the end
result of different theories including quantum effects is still a movement
in a series of distinct jumps from one site to another [17]. For atoms
heavier than hydrogen and its isotopes, quantum effects can usually be
disregarded.
For more detailed discussions of the problem of thermally activated jumps
the reader may consult the textbook of Flynn [3] and the reviews by
Franklin [11], Bennett [12], Jacucci [13], H
¨
anngi et al. [15] Pon-
tikis [14] and Flynn and Stoneham [17].
Molecular dynamic calculations become increasingly important and are
used to check and to supplement analytical theories. Atomistic computer
simulations of diffusion processes have been reviewed, e.g., by Mishin [18].
Nowadays, simulation methods present a powerful approach to gain funda-
mental insight into atomic jump processes in materials. The capabilities of
simulations have drastically improved due to the development of new simula-
tion methods reinforced by increased computer power. Reliable potentials of
atomic interaction have been developed, which allow a quantitative descrip-
tion of point defect properties. Simulation of atomic jump processes have
been applied to ordered intermetallic compounds, surface diffusion, grain-
boundary diffusion, and other systems. The challenge is to understand, de-
scribe, and calculate diffusion coefficients in a particular metal, alloy, or com-
pound. In some – but not all – of the rare cases, when this has been done,
the agreement with experiments is encouraging.
References
1. A. Einstein, Annalen der Physik 17, 549 (1905)
2. M. van Smoluchowski, Annalen der Physik 21, 756 (1906)
3. M. van Smoluchowski, Z. Phys. 13, 1069 (1912); and Physikalische Zeitschrift
17, 557 (1916)
4. C.P. Flynn, Point Defects and Diffusion, Clarendon Press, Oxford, 1972
5. P. H¨anggi, P. Talkner, M. Borkovec: Rev. Mod. Phys. 62, 251 (1990)
References 67
6. J.R. Manning, Diffusion Kinetics for Atoms in Crystals, D. van Norstrand
Comp., Inc., 1968
7. J. Bardeen, C. Herring, in: Atom Movements, A.S.M. Cleveland, 1951, p. 87
8. J. Bardeen, C. Herring, in: Imperfections in Nearly Perfect Solids, W. Shockley
(Ed.), Wiley, New York, 1952, p. 262
9. C. Wert, Phys. Rev. 79, 601 (1950)
10. G. Vineyard, J. Phys. Chem. Sol. 3, 121 (1957)
11. W.M. Franklin, in: Diffusion in Solids – Recent Developments, A.S. Nowick,
J.J. Burton (Eds.), Academic Press, Inc., 1975, p.1
12. C.H. Bennett, in: Diffusion in Solids – Recent Developments, A.S. Nowick, J.J.
Burton (Eds.), Academic Press, Inc., 1975, p.74
13. G. Jacucci, in: Diffusion in Crystalline Solids,G.E.Murch,A.S.Nowick(Eds.),
Academic Press, Inc., 1984, p.431
14. V. Pontikis, Thermally Activated Processes,in:Diffusion in Materials,
A.L.Laskar,J.L.Bocqut,G.Brebec,C.Monty(Eds.),KluwerAcademicPub-
lishers, Dordrecht, The Netherlands, 1990, p.37
15. P. H¨anngi, P. Talkner, M. Borkovec, Rev. Mod. Phys. 62, 251 (1990)
16. J. V¨olkl, G. Alefeld, in: Diffusion in Solids – Recent Developments, A.S. Nowick,
J.J. Burton (Eds.), Academic Press, Inc., 1975
17. C.P. Flynn, A.M. Stoneham, Phys. Rev. B1, 3966 (1970)
18. Y. Mishin, Atomistic Computer Simulation of Diffusion,in:Diffusion Processes
in Advanced Technological Materials, D. Gupta (Ed.), William Andrews, Inc.,
2005
5 Point Defects in Crystals
The Russian scientist Frenkel in 1926 [1] was the first author to introduce
the concept of point defects (see Chap. 1). He suggested that thermal agita-
tion causes transitions of atoms from their normal lattice sites into interstitial
positions leaving behind lattice vacancies. This type of disorder is nowadays
denoted as Frenkel disorder and contained already the concepts of vacancies
and self-interstitials. Already in the early 1930s Wagner and Schottky [2]
treated a fairly general case of disorder in binary AB compounds considering
the occurrence of vacancies, self-interstitials, and of antisite defects on both
sublattices.
Point defects are important for diffusion processes in crystalline solids.
This statement mainly derives from two features: one is the ability of point
defects to move through the crystal and to act as ‘vehicles for diffusion’
of atoms; another is their presence at thermal equilibrium. Of particular
interest in this chapter are diffusion-relevant point defects, i.e. defects which
are present in appreciable thermal concentrations.
In a defect-free crystal, mass and charge density have the periodicity of
the lattice. The creation of a point defect disturbs this periodicity. In metals,
the conduction electrons lead to an efficient electronic screening of defects.
As a consequence, point defects in metals appear uncharged. In ionic crystals,
the formation of a point defect, e.g., a vacancy in one sublattice disturbs the
charge neutrality. Charge-preserving defect populations in ionic crystals in-
clude Frenkel disorder and Schottky disorder, both of which guarantee global
charge neutrality. Frenkel disorder implies the formation of equal numbers
of vacancies and self-interstitials in one sublattice. Schottky disorder con-
sists of corresponding numbers of vacancies in the sublattices of cations and
anions. For example, in AB compounds like NaCl composed of cations and
anions with equal charges opposite in sign the number of vacancies in both
sublattices must be equal to preserve charge neutrality. Point defects in semi-
conductors introduce electronic energy levels within the band gap and thus
can occur in neutral or ionised states, depending on the position of the Fermi
level. In what follows, we consider at first point defects in metals and then
proceed to ionic crystals and semiconductors.
Nowadays, there is an enormous body of knowledge about point defects
from both theoretical and experimental investigations. In this chapter, we
70 5 Point Defects in Crystals
provide a brief survey of some features relevant for diffusion. For more com-
prehensive accounts of the field of point defects in crystals, we refer to the
textbooks of Flynn [3], Stoneham [4], Agullo-Lopez, Catlow and
Townsend [5], to a review on defect in metals by Wollenberger [6], and to
several conference proceedings [9–12]. For a compilation of data on point de-
fects properties in metals, we refer to a volume edited by Ullmeier [13]. For
semiconductors, data have been assembled by Schulz [14], Stolwijk [15],
Stolwijk and Bracht [16], and Bracht and Stolwijk [17]. Proper-
ties of point defects in ionic crystals can be found in reviews by Barr
and Lidiard [7] and Fuller [8] and in the chapters of Beni
`
ere [18] and
Erdely [19] of a data collection edited by Beke.
5.1 Pure Metals
5.1.1 Vacancies
Statistical thermodynamics is a convenient tool to deduce the concentra-
tion of lattice vacancies at thermal equilibrium. Let us consider an elemental
crystal, which consists of N atoms (Fig. 5.1). We restrict the discussion to
metallic elements or to noble gas solids in which the vacancies are in a single
electronic state and we suppose (in this subsection) that the concentration
is so low that interactions among them can be neglected. At a finite temper-
ature, n
1V
vacant lattice sites (monovacancies, index 1V ) are formed. The
total number of lattice sites then is
N
= N + n
1V
. (5.1)
The thermodynamic reason for the occurrence of vacancies is that the Gibbs
free energy of the crystal is lowered. The Gibbs free energy G(p, T )ofthe
Fig. 5.1. Vacancies in an elemental crystal
5.1 Pure Metals 71
crystal at temperature T and pressure p is composed of the Gibbs function
of the perfect crystal, G
0
(p, T ), plus the change in the Gibbs function on
forming the actual crystal, ∆G:
G(p, T )=G
0
(p, T )+∆G, (5.2)
where
∆G = n
1V
G
F
1V
− TS
conf
. (5.3)
In Eq. (5.3) the quantity G
F
1V
represents the Gibbs free energy of formation
of an isolated vacancy. It corresponds to the work required to create a va-
cancy by removing an atom from a particular, but arbitrary, lattice site and
incorporating it at a surface site (‘Halbkristalllage’). Not only surfaces also
grain boundaries and dislocations can act as sources or sinks for vacancies.
If a vacancy is created, the crystal lattice relaxes around the vacant site and
the vibrations of the crystal are also altered. The Gibbs free energy can be
decomposed according to
G
F
1V
= H
F
1V
− TS
F
1V
(5.4)
into the formation enthalpy H
F
1V
and the formation entropy S
F
1V
.Thelast
term on the right-hand side of Eq. (5.3) contains the configurational entropy
S
conf
, which is the thermodynamic reason for the presence of vacancies.
In the absence of interactions, all distinct configurations of n
1V
vacancies
on N
lattice sites have the same energy. The configurational entropy can be
expressed through the equation of Boltzmann
S
conf
= k
B
ln W
1V
, (5.5)
where W
1V
is the number of distinguishable ways of distributing n
1V
mono-
vacancies among the N
lattice sites. Combinatoric rules tell us that
W
1V
=
N
!
n
1V
!N!
. (5.6)
The numbers appearing in Eq. (5.6) are very large. Then, the formula of
Stirling, ln x! ≈ x ln x, approximates the factorial terms and we get
ln W
1V
≈ (N + n
1V
)ln(N + n
1V
) −n
1V
ln n
1V
− N ln N. (5.7)
Thermodynamic equilibrium is imposed on a system at given temperature
and pressure by minimising its Gibbs free energy. In the present case, this
means
∆G ⇒ Min . (5.8)
The equilibrium number of monovacancies, n
eq
1V
, is obtained, when the Gibbs
free energy in Eq. (5.3) is minimised with respect to n
1V
, subject to the
constraint that the number of atoms, N, is fixed. Inserting Eqs. (5.5) and (5.7)
72 5 Point Defects in Crystals
into Eq. (5.3), we get from the necessary condition for thermal equilibrium,
∂∆G/∂n
1V
=0:
H
F
1V
− TS
F
1V
+ k
B
T ln
n
eq
1V
N + n
eq
1V
=0 (5.9)
By definition we introduce the site fraction of monovacancies
1
via:
C
1V
≡
n
1V
N + n
1V
. (5.10)
This quantity also represents the probability to find a vacancy on an arbitrary,
but particular lattice site. In thermal equilibrium we have C
eq
1V
≡ n
eq
1V
/(N +
n
eq
1V
). Solving Eq. (5.9) for the equilibrium site fraction yields
C
eq
1V
=exp
−
G
F
1V
k
B
T
=exp
S
F
1V
k
B
exp
−
H
F
1V
k
B
T
. (5.11)
This equation shows that the concentration of thermal vacancies increases
via a Boltzmann factor with increasing temperature. The temperature depen-
dence of C
eq
1V
is primarily due to the formation enthalpy term in Eq. (5.11).
We note that the vacancy formation enthalpy is also given by
H
F
1V
= −k
B
∂ ln C
eq
1V
∂(1/T )
. (5.12)
This quantity is often determined in experiments which measure relative con-
centrations. Such measurements are less tedious than measurements of abso-
lute concentrations (see below). In the analysis of experiments, it is frequently
assumed that formation enthalpy and entropy are independent of tempera-
ture; this is often, though not always, justified.
5.1.2 Divacancies
Divacancies (2V) are point defects that form in a crystal as the simplest
complex of monovacanies (1V). This is a consequence of the mass-action
equilibrium for the reaction
1V +1V 2V. (5.13)
The probability that a given lattice site in a monoatomic crystal is vacant
equals the site fraction of monovacancies. Let us suppose that a divacancy
consists of two monovacancies on nearest-neighbour lattice sites. For non-
interacting monovacancies, the probability of forming a divacancy is propor-
tional to (C
1V
)
2
. For a coordination lattice (coordination number Z)the
1
Concentrations as number densities are given by C
1V
N,whenN is taken as the
number density of atoms.
5.1 Pure Metals 73
equilibrium fraction of divacancies C
eq
2V
that form simply for statistical rea-
sons is given by
Z
2
(C
eq
1V
)
2
. However, there is also a gain in enthalpy (and en-
tropy) when two vacancies are located on adjacent lattice sites. Fewer bonds
to neighbouring atoms must be broken, when a second vacancy is formed next
to an already existing one. Interactions between two vacancies are accounted
for by a Gibbs free energy of binding G
B
2V
, which according to
G
B
2V
= H
B
2V
− TS
B
2V
(5.14)
can be decomposed into an enthalpy H
B
2V
and an entropy S
B
2V
of interaction.
For G
B
2V
> 0 the interaction is attractive and binding occurs, whereas for
G
B
2V
< 0 it is repulsive. Combining Eq. (5.14) with the mass-action law for
Eq. (5.13) yields
C
eq
2V
=
Z
2
exp
G
B
2V
k
B
T
(C
eq
1V
)
2
. (5.15)
Equation (5.15) shows that at thermal equilibrium the divacancy concentra-
tion rises faster with increasing temperature than the monovacancy concen-
tration (see Fig. 5.2). With increasing G
B
2V
the equilibrium concentration of
divacancies increases as well.
The total equilibrium concentration of vacant lattice sites, C
eq
V
,inthe
presence of mono- and divacancies (neglecting higher agglomerates) is then
C
eq
V
= C
eq
1V
+2C
eq
2V
. (5.16)
For a typical monovacancy site fraction in metals of 10
−4
near the melting
temperature (see below), the fraction of non-interacting divacancies would be
Fig. 5.2. Arrhenius diagram of equilibrium concentrations of mono- and divacan-
cies in metals (schematic)
74 5 Point Defects in Crystals
Z
2
×10
−8
. Typical interaction energies of a few 0.1 eV increase the divacancy
concentration by factors of 10 to 100. Therefore, the divacancy concentration
at thermal equilibrium is less or much less than that of monovacancies. Nev-
ertheless, divacancies in close-packed metals can contribute to some extent to
the diffusive transport (see Chaps. 6 and 17). The major reason is that diva-
cancies are more effective diffusion vehicles than monovacancies, since their
mobility can be considerably higher than that of monovacancies [20]. The
contribution of higher agglomerates than divacancies is usually negligible.
5.1.3 Determination of Vacancy Properties
The classical method for an absolute measurement of the total vacancy con-
centration, Eq. (5.16), is differential dilatometry (DD). The idea is to
compare macroscopic and microscopic volume changes as functions of tem-
perature. To understand this method, we consider a monoatomic crystal with
N atoms. We denote its macroscopic volume in the defect-free state as V
0
and the volume per lattice site as Ω
0
. A defect-free state can usually be re-
alised by cooling slowly to low enough temperatures. As long as the thermal
concentration of vacant lattice sites is negligible, we have V
0
= N Ω
0
. With
increasing temperature the volume increases due to thermal expansion and
due the formation of new lattice sites. Then, the macroscopic volume and
the volume per lattice site take the values V (T )andΩ(T ), respectively. The
change in the macroscopic volume is given by
∆V ≡ V (T ) −V
0
=(N + n)Ω(T ) −NΩ
0
= N ∆Ω + nΩ(T ) , (5.17)
where ∆Ω ≡ Ω(T ) −Ω
0
. n is the number of new lattice sites. Equation (5.17)
can be rearranged to give
∆V
V
0
=
∆Ω
Ω
0
+
n
N
Ω(T )
Ω
0
. (5.18)
This equation reflects the two major physical reasons of the macroscopic
volume change: ∆Ω/Ω
0
is the thermal expansion of the unit cell and the
second term on the right-hand side stands for the additional lattice sites.
If n
V
vacant sites and n
I
self-interstitials are created, we have n = n
V
−n
I
new lattice sites. The difference between the total self-interstitial fraction,
C
eq
I
, and the total site fraction of vacant lattice sites, C
eq
V
,isgivenby
C
eq
V
− C
eq
I
=
∆V
V
0
−
∆Ω
Ω
0
. (5.19)
In Eq. (5.19) the effect of thermal expansion in the ratio Ω(T )/Ω
0
and higher
order terms in n/N have been omitted.
5.1 Pure Metals 75
In metals, self-interstitials need not to be considered as equilibrium defects
(see below). We then have
C
eq
V
=
∆V
V
0
−
∆Ω
Ω
0
. (5.20)
For cubic crystals Eq. (5.20) can be rewritten as
C
eq
V
=3
∆l
l
0
−
∆a
a
0
, (5.21)
where ∆l/l
0
is the relative length change of the sample and ∆a/a
0
the lattice
parameter change. In deriving Eq. (5.21) from Eq. (5.20) quadratic and cubic
terms in ∆l/l
0
and ∆a/a
0
have been neglected, because already the linear
terms are of the order of a few percent or less.
Equation (5.21) shows what needs to be done in DD-experiments. The
macroscopic length change and the expansion of the unit cell must be mea-
sured simultaneously
2
. The expansion of the unit cell can be measured in
very precise X-ray or neutron diffraction studies. As already mentioned, near
the melting temperature of metallic elements C
eq
V
does not exceed 10
−3
to
10
−4
(see Table 5.1) and is much smaller at lower temperatures. Thus, precise
measurements of C
eq
V
are very ambitious. Both length and lattice parameter
changes must be recorded with the extremely high accuracy of about 10
−6
.
Differential dilatometry experiments were introduced by Feder and
Nowick [21] and Simmons and Balluffi [22, 23] around 1960 and later
Fig. 5.3. Length and lattice parameter change versus temperature for Au according
to Simmons and Balluffi [23]
2
For uniaxial crystals measurements in two independent directions are necessary.
76 5 Point Defects in Crystals
used by several authors. As an example, Fig. 5.3 shows measured length and
lattice parameter expansion versus temperature for gold in the interval 900
to 1060
◦
C according to [23]. ∆l/l is larger than ∆a/a at high temperatures
due to the presence of lattice vacancies. This technique demonstrated that
the dominant, thermally created defects in metals are vacancies and the ex-
ponential dependence of the vacancy concentration on temperature was also
confirmed. The great advantage of DD experiments is that the total vacancy
content as a function of temperature can be obtained. If monovacancies are
the dominant species, both the formation enthalpy and the formation en-
tropy can be deduced. When the divacancy contribution is not negligible,
additional divacancy properties can be obtained [20].
The basic weakness of DD experiments is the unsufficient accuracy in
the range below about C
eq
V
≈ 10
−5
, where the divacancy contribution would
be low enough to permit a direct measurement of the formation properties
of monovacancies. This is illustrated for aluminium in Fig. 5.4 according to
Seeger [24]. The thermal expansion measurements of various groups [25–27]
cover, with a reasonable accuracy only the concentration range between 10
−3
to 10
−5
. Fortunately, there are additional techniques such as positron annihi-
lation spectroscopy (see below) that supplement DD measurements very well.
An analysis of DD measurements together with these additional data yields
the line in Fig. 5.4, which corresponds to a monovacancy contribution with
H
F
1V
=0.66 eV and S
F
1V
=0.8k
B
. Near the melting temperature the fraction
of vacant sites associated as divacancies is about 50%.
Fig. 5.4. Equilibrium concentration of vacant lattice sites in Al determined by DD
measurements according to [24]. DD data: + [25], • [27], × [26]. The concentration
range covered by positron lifetime measurements is also indicated
5.1 Pure Metals 77
Despite the elegance of DD experiments, much information on defect prop-
erties is obtained from other ingenious experiments, which are less direct,
some of which are mentioned in what follows:
Formation enthalpies can be deduced from experiments which do not
involve a determination of the absolute vacancy concentration. A frequently
used method is rapid quenching (RQ) from high temperatures, T
Q
.The
quenched-in vacancy population can be studied in measurements of the resid-
ual resistivity. For example, thin metal wires or foils can be rapidly quenched.
Their residual resistivities before and after quenching, ρ
0
and ρ
Q
,canbe
measured accurately at liquid He temperature. The residual resistivity after
quenching increases due to the additional scattering processes of conduction
electrons at ‘frozen in’ vacancies. The increase of the residual resistivity, ∆ρ,
is proportional to the frozen-in vacancy concentration C
eq
V
(T
Q
):
∆ρ ≡ ρ
Q
− ρ
0
= ρ
V
C
eq
V
(T
Q
) . (5.22)
ρ
V
is a defect-related quantity, which accounts for the resistivity increase
per vacant site. In a successful quenching experiment, the equilibrium va-
cancy population is completely ‘frozen in’. Vacancy losses to sinks such as
dislocations, grain-boundaries, or surfaces can cause problems in quenching
experiments. Since the residual resistivity increase per vacant site is usu-
ally unknown, only formation enthalpies can be determined from RQ experi-
ments when ∆ρ is measured for various quenching temperatures. Formation
entropies S
F
are not accessible from such experiments. Only the product
ρ
V
exp(S
F
/k
B
) can be deduced.
Transmission electron microscopy (TEM) of quenched-in vacancy
agglomerates is a further possibility to determine vacancy concentrations.
Upon annealing vacancies become mobile and can form agglomerates. If the
agglomerates are large enough they can be studied by TEM. In addition to
vacancy losses during the quenching process, the invisibility of very small
agglomerates can cause problems.
A very valuable tool for the determination of vacancy formation enthalpies
is positron annihilation spectroscopy (PAS). The positron is the an-
tiparticle of the electron. It is, for example, formed during the β
+
decay
of radioisotopes. High-energy positrons injected in metals are thermalised
within picoseconds. A thermalised positron diffuses through the lattice and
ends its life by annihilation with an electron. Usually, two γ-quanta are emit-
ted according to
e
+
+ e → 2γ.
The energy of each γ-quantum is about 511 keV. The positron lifetime de-
pends on the total electron density. Vacancies can trap positrons. Because of
the missing core electrons at the vacant lattice site, the local electron den-
sity is significantly reduced. Therefore, the lifetime of trapped positrons is
enhanced as compared to that of positrons annihilating in the perfect lattice.
78 5 Point Defects in Crystals
Positrons in a vacancy-containing crystal end their life either by annihilation
as free positrons or as trapped positrons. The lifetimes of both fates are differ-
ent and the trapping probability increases with the vacancy concentration.
Lifetime measurements are possible using, e.g.,
22
Na as a positron source.
This nuclide emits γ-quanta simultaneously at the ‘birth’ of the positron.
The positrons ‘death’ is accompanied by the emission of two 511 keV annihi-
lation quanta.
The interpretation of positron lifetime measurements is provided by
a trapping model: a thermalised positron diffusing through a metal is trapped
by a vacancy with the trapping rate σ. The positron lifetime in the trapped
state, τ
t
, exceeds that in the free state, τ
f
, when the positron is located in
an interstitial position of the perfect crystal. If untrapping is disregarded two
distinct lifetimes of the positron are predicted by this model:
(i) The trapped positron is annihilated with a lifetime τ
t
.
(ii) A positron diffusing through the crystal may end its existence as a ‘free’
particle either by the annihilation rate 1/τ
f
or by being trapped by a va-
cancy with the trapping rate σC
1V
,whereσ is the trapping cross section.
This results in a lifetime given by τ
f
/(1 + τ
f
σC
1V
). If one assumes that
initially all positrons are free, one gets for their mean lifetime:
¯τ = τ
f
1+τ
t
σC
1V
1+τ
f
σC
1V
. (5.23)
Figure 5.5 shows as an example measurements of the mean lifetime of
positrons in aluminium as a function of temperature [28]. The mean life-
time increases from about 160 ps near room temperature and reaches a high
Fig. 5.5. Mean lifetime of positrons in Al according to Schaefer et al. [28]
5.1 Pure Metals 79
Table 5.1. Monovacancy properties of some metals. C
eq
1V
is given in site fractions
Metal H
F
1V
/eV S
F
1V
/k
B
C
eq
1V
at T
m
Method(s)
Al 0.66 0.6 9.4 ×10
−4
DD + PAS
Cu 1.17 1.5 2 ×10
−4
DD + PAS
Au 0.94 1.1 7.2 × 10
−4
DD
Ag 1.09 – 1.7 ×10
−4
DD
Pb 0.49 0.7 1.7 ×10
−4
DD
Pt 1.49 1.3 – RQ
Ni 1.7 – – PAS
Mo 3.0 – – PAS
W4.02.31× 10
−4
RQ+TEM
temperature value of about 250 ps. From a fit of Eq. (5.23) to the data the
product σC
1V
can be deduced. If the trapping cross section is known the
vacancy concentration is accessible. If σ is constant, the vacancy formation
enthalpy can be deduced from the temperature variation of σC
1V
. At high
temperature, i.e. for high vacancy concentrations, all positrons are annihi-
lated from the trapped state. Under such conditions the method is no longer
sensitive to a further increase of the vacancy concentration and the curve ¯τ
versus T saturates. The maximum sensitivity of positron annihilation mea-
surements occurs for vacant site fractions between about 10
−4
and 10
−6
(see
Fig. 5.4).
A unique feature of PAS is that it is sensitive to vacancy-type defects, but
insensitive to interstitials. Measurements of the mean positron lifetime is one
technique of PAS. Other techniques, not described here, are measurements
of the line-shape of the annihilation line and lifetime spectroscopy. Review
articles on PAS applications for studies of vacancy properties in metals are
provided by Seeger [24], Doyama and Hasiguti [29], Hautoj
¨
arvi [30],
and Schaefer et al. [31]. Vacancy properties of metals are listed in Ta-
ble 5.1 according to [6].
5.1.4 Self-Interstitials
Using statistical thermodynamics and a reasoning analogous to that for va-
cancies, the equilibrium fraction of self-interstitials in pure metals can be
written as
C
eq
I
= g
I
exp
−
G
F
I
k
B
T
= g
I
exp
S
F
I
k
B
exp
−
H
F
I
k
B
T
. (5.24)
G
F
I
denotes the Gibbs free energy of formation, S
F
I
and H
F
I
the correspond-
ing formation entropy and enthalpy, and g
I
a geometric factor. For example,
in fcc metals g
I
= 3 accounts for the fact that self-interstitials occur in the
80 5 Point Defects in Crystals
Fig. 5.6. Dumbbell configuration of a self-interstitial in an fcc lattice
so-called dumbbell configuration illustrated in Fig. 5.6, which implies three
possible 100 orientations for a self-interstitial with its midpoint at the same
lattice site.
In close-packed metals the formation enthalpy of a self-interstitial is con-
siderably higher than that of a vacancy (see, e.g., Table 6 in the review of
Wollenberger [6] and the data compilation of Ullmaier [13]):
H
F
I
≈ (2 to 3) ×H
F
1V
. (5.25)
Therefore, at thermal equilibrium
C
eq
V
>>> C
eq
I
, (5.26)
i.e. the overwhelming thermal defect population is of the vacancy type.
Self-interstitials are produced athermally (together with an equal number
of vacancies), when a metal is subject to irradiation with energetic particles.
Thus, self-interstitials play a significant rˆole in the radiation damage and in
radiation-enhanced diffusion [9, 11]. In some ionic crystals, Frenkel disorder is
established at thermal equilibrium (see Sect. 5.3 and Chap. 26). For example,
in silver halides Frenkel pairs are formed, which consist of self-interstitials and
vacancies in the cation sublattice of the crystal.
Semiconductors are less densely packed than metals and offer more
space in their interstitial sites. Therefore, the formation enthalpies of self-
interstitials and vacancies are not much different. Depending on the semi-
conductor, both types of defects can play a rˆole under thermal equilibrium
conditions. This is the case for example for Si, whereas in Ge vacancies dom-
inate self-diffusion (see Sect. 5.5 and Chap. 23).
5.2 Substitutional Binary Alloys
A knowledge of the vacancy population in substitutional alloys is of consider-
able interest as well. Let us consider first dilute substituional alloys and then
make a few remarks about the more complex case of concentrated alloys.
5.2 Substitutional Binary Alloys 81
5.2.1 Vacancies in Dilute Alloys
A binary alloy of atoms B and A is denoted as dilute if the number of B atoms
is not more than a few percent of the number of A atoms. Then, B is called the
solute and A the solvent (or matrix). Depending on the solute/solvent combi-
nation interstitial and substitutional alloys are to be distinguished. Small so-
lutes such as H, C, and N usually form interstitial alloys whereas solute atoms,
which are similar in size to the solvent atoms form substitutional alloys.
In a substitutional alloy, A and B atoms and vacancies occupy sites of the
same lattice. However, we have to distinguish whether a vacancy is formed
on a site, where it is surrounded by A atoms only, or whether the vacancy
is formed on a neighbouring site of a solute atom. In the latter case, we talk
about a solute-vacancy pair (see Fig. 5.7). For simplicity let us suppose that
the solute-vacancy interaction is restricted to nearest-neighbour sites, which
is often reasonable for metals. The Gibbs free energy of vacancy formation
in the undisturbed solvent, G
F
1V
(A), is different from the Gibbs free energy
of vacancy formation next to a B atom, G
F
1V
(B):
G
F
1V
(A) = G
F
1V
(B) . (5.27)
For G
F
1V
(A) >G
F
1V
(B) the vacancy-solute interaction is attractive, whereas
for G
F
1V
(A) <G
F
1V
(B)itisrepulsive.AccordingtoLomer [32] the total
vacancy fraction in a dilute alloy, C
eq
V
(C
B
), is given by
C
eq
V
(C
B
)=(1−ZC
B
)exp
−
G
F
1V
(A)
k
B
T
+ ZC
B
exp
−
G
F
1V
(B)
k
B
T
, (5.28)
Fig. 5.7. Vacancies in a dilute substitutional alloy
82 5 Point Defects in Crystals
where Z denotes the coordination number and C
B
the solute fraction. Equa-
tion (5.28) is a good approximation for C
B
< 0.01. We recognise that the first
term corresponds to the concentration of unpaired vacancies. It is reduced
by a factor (1 − ZC
B
) relative to that of the pure solvent. The second term
is the fraction of solute-vacancy pairs. If we introduce the Gibbs free energy
of interaction between solute and vacancy
G
B
≡ G
F
1V
(A) −G
F
1V
(B) , (5.29)
Eq. (5.28) can be written as
C
eq
V
=exp
−
G
F
1V
(A)
k
B
T
1 −ZC
B
+ ZC
B
exp
G
B
k
B
T
(5.30)
and is sometimes called the Lomer equation.
The first factor in Eq. (5.30) is the equilibrium vacancy fraction in the
pure solvent. The factor in square brackets is larger/smaller than unity if G
B
is positive/negative. For binding/repulsion between solute and vacancy the
total vacancy content in the alloy is higher/lower than in the pure solvent.
In dilute alloys of the noble metals with solute elements lying to their right
in the periodic table, G
B
is typically about 0.2 eV [13]. We note that the
quantity
p = C
eq
1V
exp
G
B
k
B
T
(5.31)
denotes the probability that a vacancy occupies a nearest-neighbour site of
a solute, when C
eq
1V
is measured in site fractions. The expressions (5.30) and
(5.31) are of interest for diffusion in dilute alloys, which will be considered in
Chap. 19.
5.2.2 Vacancies in Concentrated Alloys
The Lomer equation is valid for very dilute alloys (C
B
≤ 0.01). In its deriva-
tion only associates between one solute atom and vacancy are considered.
In concentrated alloys, associates between several solute atoms and vacancy
and interactions between atoms of an associate become also important. To
the author’s knowledge robust theoretical models for the vacancy population
in concentrated substitutional alloys are not available. An approximation was
treated by Dorn and Mitchell [33]. These authors attribute to each as-
sociate consisting of i solute atoms and one vacancy the (same) Gibbs free
energy G
i
. By standard thermodynamic reasoning, they derive the following
expression for the total vacancy concentration in a concentrated alloy
C
eq
V
(C
B
)=
Z
i=0
Z
i
C
Z−i
A
C
i
B
exp
−
G
i
k
B
T
, (5.32)
5.3 Ionic Compounds 83
where Z denotes the coordination number. The term for i = 0 represents
the vacancy content of free vacancies in the solvent. A limitation to the
terms for i =0andi = 1 reproduces Lomer’s equation using G
0
≡ G
F
1V
(A)
and G
i
= G
F
1V
(B). In the derivation of Eq. (5.32) a random distribution of
atoms has been assumed. For a generalisation of Eq. (5.32) by including an
interaction between atoms we refer to [34].
5.3 Ionic Compounds
Let us consider thermal defects in ionic crystals such as the alkali halides,
silver chloride and bromide. These materials crystallise in sodium chloride
and cesium chloride structures. They are strongly stoichiometric and have
wide band gaps so that thermally produced electrons or holes can be ignored.
These materials are the classical ion conductors, whose conductivity arises
from the presence and mobility of vacancies and/or self-interstitials.
The classical ionic conductors are to be distinguished from the fast ion
conductors. As a general rule, fast ion conductors are materials with an open
structure, which allows for the rapid motion of relatively small ions. A fa-
mous example is silver iodide, for which fast ionic conduction was reported as
early as 1914 [35]. It displays a first order phase transition between a fast ion-
conducting phase (α-AgI) above 147
◦
C and a normal conducting phase at
lower temperatures. α-AgI has a body-centered cubic sublattice of practically
immobile I
−
ions. Each unit cell displays 42 interstitial sites (6 octahedral,
12 tetrahedral, 24 trigonal) over which the two Ag
+
ions per unit cell are dis-
tributed (see Fig. 27.2). Since there are many more sites than Ag
+
ions, the
latter can migrate easily. Other examples are β-alumina, some compounds
with fluorite structure such as some halides such as CaF
2
and PbF
2
and
oxides like doped ZrO
2
, which are fluorine or oxygen ion conductors at el-
evated temperatures. These materials require a different approach, because
in the sublattice of one ionic species the fraction of vacant sites is high (see
Chap. 27).
To be specific, we consider here classical ionic crystals with CA stoichiom-
etry (C=cation, A=anion). They are composed of anions and cations which
carry equal charges opposite in sign. Let us further assume that all cation
sites are equivalent and all anion sites likewise; in other words, there are two
filled sublattices. The defect population that can develop in such a crystal
has the structural constraint that the number of C atoms and of A atoms
must be equal. This can also be viewed as a condition of electroneutrality by
assigning ionic charges to the atoms C and A.
3
Then, only charge-preserving
3
Electroneutrality must be fulfilled in the volume of ionic crystal. In the vicinity
of charged dislocations, grain boundaries or surfaces, unbalanced point defect
populations can develop. In compounds with additional electronic defects the
requirements of structure and of electroneutrality are different (see, e.g., the
textbook of Maier [36]).
84 5 Point Defects in Crystals
defect populations can develop. In addition, the formation of antisite defects
need not to be considered due to the high Coulomb energy of an ion placed
in the ‘wrong’ sublattice. In what follows, we consider two important cases
of disorder in CA ionic crystals. For a more general treatment the reader is
referred, e.g., to the textbook of Allnatt and Lidiard [37].
5.3.1 Frenkel Disorder
Let us suppose that vacancies (V
C
) and self-interstitials (I
C
) in the C sub-
lattice are formed from cations on cation sites (C
C
) according to the quasi-
chemical reaction
C
C
V
C
+ I
C
. (5.33)
This type of disorder is called Frenkel disorder (Fig. 5.8), as it was first
suggested by the Russian scientist Frenkel [1]. Pairs of vacancies and self-
interstitials are denoted as Frenkel pairs. According to the law of mass action
we may write
C
eq
V
C
C
eq
I
C
=exp
S
FP
k
B
exp
−
H
FP
k
B
T
≡ K
FP
. (5.34)
Here C
eq
V
C
and C
eq
I
C
denote equilibrium site fractions of vacancies and self-
interstitials in the C sublattice. K
FP
is called the Frenkel product.Thefor-
mation enthalpy H
FP
and entropy S
FP
for (non-interacting) Frenkel pairs
can be split according to
H
FP
= H
F
V
C
+ H
F
I
C
and S
FP
= S
F
V
C
+ S
F
I
C
(5.35)
into sums of formation enthalpies, H
F
V
C
+ H
F
I
C
, and formation entropies,
S
F
V
C
+ S
F
I
C
, of vacancies and self-interstitials. Charge neutrality of undoped
Fig. 5.8. Frenkel disorder in the cation sublattice of a CA ionic crystal
5.3 Ionic Compounds 85
crystals requires that the numbers of vacancies and self-interstitials are equal,
i.e. C
eq
V
C
= C
eq
I
C
.Thenweget
C
eq
V
C
= C
eq
I
C
=exp
S
FP
2k
B
exp
−
H
FP
2k
B
T
. (5.36)
Frenkel disorder occurs in the silver sublattices of silver chloride and bro-
mide [38, 39]. Frenkel-pair formation properties of these silver halides are
listed in Table 5.2.
5.3.2 Schottky Disorder
Let us consider once more a binary ionic CA compound composed of cations
on the C sublattice, C
C
, and anions on the A sublattice, A
A
. The constraint
of electroneutrality is fulfilled, when vacancies in both sublattices, V
C
and
V
A
, are formed according to the reaction
C
C
+ A
A
+ 2 new lattice sites V
C
+ V
A
. (5.37)
in equal numbers (Fig. 5.9). Applying the law of mass-action to this reaction,
we get for thermal equilibrium
C
eq
V
C
C
eq
V
A
=exp
S
SP
k
B
exp
−
H
SP
k
B
T
≡ K
SP
, (5.38)
where C
V
C
and C
V
A
denote site fractions of cation and anion vacancies, re-
spectively. H
SP
and S
SP
denote enthalpy and entropy for the formation of
a Schottky pair (cation vacancy plus anion vacancy).
Fig. 5.9. Schottky disorder in an CA ionic crystal
86 5 Point Defects in Crystals
Table 5.2. Formation enthalpies of Schottky- and Frenkel pairs of ionic crystals
Ionic compound (H
SP
or H
FP
)/eV (S
SP
or S
FP
)/k
B
Type of disorder
NaCl 2.44 9.8 Schottky
KCl 2.54 7.6 Schottky
NaI 2.00 7.6 Schottky
KBr 2.53 10.3 Schottky
LiF 2.68 Schottky
LiCl 2.12 Schottky
LiBr 1.80 Schottky
LiI 1.34 Schottky
AgCl 1.45–1.55 5.4–12.2 Frenkel
AgBr 1.13–1.28 6.6–12.2 Frenkel
This type of disorder is called Schottky disorder and K
SP
is denoted as
the Schottky product. Charge neutrality in an undoped crystal requires equal
concentrations of cation and anion vacancies:
C
eq
V
C
= C
eq
V
A
=exp
S
SP
2k
B
exp
−
H
SP
2k
B
T
. (5.39)
For non-interacting Schottky pairs, the enthalpy and entropy of pair forma-
tion according to
H
SP
= H
F
V
C
+ H
F
V
A
and S
SP
= S
F
V
C
+ S
F
V
A
(5.40)
can be expressed in terms of the formation enthalpies, H
F
V
C
and H
F
V
A
,and
entropies, S
F
V
C
and S
F
V
A
, of cation and anion vacancies. Experience shows that
Schottky disorder dominates the defect population in most alkali halides and
in many oxides. Schottky-pair formation properties are listed in Table 5.2.
Crystals doped with aliovalent ions are considered in detail in Chap. 26. In
doped crystals, the Schottky product is still valid.
5.4 Intermetallics
Intermetallics are a fascinating group of materials, which attract attention
from the viewpoints of fundamentals as well as applications [40, 41]. Binary
intermetallics are composed of two metals or of a metal and a semimetal.
Their crystal structures are different from those of the elements. This def-
inition includes both intermetallic phases and ordered alloys. Intermetallics
form a numerous and manifold group of materials and comprise a greater
variety of crystal structures than metallic elements [48]. They crystallise in
structures with ordered atomic distributions in which atoms are preferen-
tially surrounded by unlike atoms. Some frequent structures are illustrated