Báo cáo sinh học: "All systems GO for understanding mouse gene function" ppsx
Bạn đang xem bản rút gọn của tài liệu. Xem và tải ngay bản đầy đủ của tài liệu tại đây (87.61 KB, 4 trang )
Minireview
All systems GO for understanding mouse gene function
Chris Holmes*
†
and Steve DM Brown*
Addresses: *MRC Mammalian Genetics Unit, Harwell OX11 0RD, UK.
†
Department of Statistics, Oxford Centre for Gene Function,
University of Oxford, 1 South Parks Road, Oxford OX1 3TG, UK.
Correspondence: Steve DM Brown. E-mail:
With the completion of the human and mouse genome
sequences [1-3], the challenge for functional genomics in
the twenty-first century is to determine the function of all of
the genes that are predicted to be in the mammalian
genome. Indeed, if we could unscramble the rich relation-
ships between gene variation and disease, the impact upon
medicine, healthcare and lifestyle would be dramatic - as
would the effect on our understanding of fundamental bio-
logical processes. But the task is daunting and we will need
to bring a variety of tools and approaches to bear if we are
to undertake a comprehensive and systematic analysis of
mammalian gene function. It is humbling to reflect that
taking together all of the available information on the
sequence, expression and mutation of mammalian genes,
we know little if anything about the physiological function
of at least half of the mammalian gene catalog.
One approach to discovering gene function in a mammal is
to mutate the gene in a mouse, and a number of methods
are available for introducing mutations into mouse genes.
We are likely to see, over the next few years, a systematic
effort that aims to obtain a variety of mutant alleles for
every gene in the mouse genome [4,5]. But this is the easy
part, and determining the phenotypic consequences of each
mutation represents an effort many times greater than the
generation of the mutations themselves. In addition, deter-
mining the phenotype of a mutant gene often begins with
making some assumptions about the likely function of the
gene on the basis a number of observations.
One common starting point for the curious molecular
geneticist is to ask, “Where is the gene expressed?” Tissue-
restricted patterns of expression might be expected to tell us
something about a gene’s function and where to look for
phenotypes when examining mutants - but this is fraught
with pitfalls. For example, we might assume straight-
forwardly that expression in a particular tissue indicates that
a gene plays some physiological role there. But many
mutants fail to reveal phenotypes in at least some of the
tissues in which the wild-type version of the gene is nor-
mally expressed. Revealing a function for the gene being
studied in those tissues may be contingent on perturbations
in other molecules or pathways, adding an extra layer of
complexity to the analysis. Moreover, many genes are
Abstract
It is widely supposed that the tissue specificity of gene expression indicates gene function.
Now, an extensive analysis of gene expression in the mouse reveals that quantitative
measurement of expression levels in different tissues can contribute powerfully to the
prediction of gene function.
BioMed Central
Journal
of Biology
Journal of Biology 2004, 3:20
Published: 17 December 2004
Journal of Biology 2004, 3:20
The electronic version of this article is the complete one and can be
found online at />© 2004 BioMed Central Ltd
widely expressed, effectively nullifying expression patterns
as a predictor. Thus, although they are widely used, it is
clear that tissue-specific expression patterns are a very blunt
tool in the molecular geneticist’s armory.
Now, in an article in Journal of Biology, Zhang and colleagues
[6] have tackled this problem head-on. Beginning with the
fact that analyses of gene-expression patterns have success-
fully been used in yeast and the nematode Caenorhabditis
elegans to determine gene function, they surmised that
similar approaches would be applicable in mammals and
that comparison of quantitative gene-expression patterns
would uncover co-regulated genes that may represent func-
tional categories. If this were the case then a systematic
determination of expression patterns for the bulk of genes
across a wide variety of tissues in the mouse would be one
route to determining novel gene function. In a tour de force
that represents one of the most extensive analyses of mam-
malian gene expression published to date, they analyzed the
expression patterns for 40,000 known and predicted
mRNAs across 55 diverse tissues. Their analyses provide
quite startling conclusions revealing that, in contrast to the
simple binary output (expressed/not expressed) that is the
usual representation of tissue-specific expression data,
quantitative measurements contain critical information that
is powerfully predictive of function.
The analysis [6] is based on data generated from a single
dye-swap cDNA microarray experiment [7]. On the face of
it, this appears a very small number of samples to support
such an ambitious study. But some impressive quality-
control checks were put in place to ensure robustness of
results, including comparison of measurements of known
tissue-specific genes, cross-referencing of related studies,
and reverse-transcription-coupled real-time PCR. Moreover,
by constructing an empirical null-distribution for differen-
tial expression built via ‘negative control’ transcripts using
non-coding, randomly generated and yeast transcripts, they
were able to filter the 40,000 measurements down to
21,622 genes that could be confidently said to exhibit dif-
ferential expression in at least some tissues.
In terms of scope, the study is similar to the work of Su et al.
[8], who considered 46 and 45 human and mouse tissue
lines, respectively, measured using Affymetrix gene chips.
But a key departure is that Zhang and colleagues [6] chose
to investigate the relationship between gene function, as
specified by Gene Ontology ‘Biological Process’ (GO-BP)
categories [9], and quantitative gene-expression measure-
ments. The controlled hierarchical vocabulary that com-
prises the Gene Ontology includes one ‘layer’ describing the
biological process such as signaling or RNA processing, in
which a gene functions; other layers indicate cellular
component (or localization) and molecular function. Gene
Ontology thus provides a rich source of information that
will become increasingly integrated into analysis of experi-
mental data derived from the emerging ‘-omics’ platforms,
including transcriptomics. The combining of qualitative
ontology models and quantitative gene expression in mouse
functional genomics is a powerful and original approach
that is likely to prove fruitful in other mammals and in
cross-species comparative studies. In comparison, the con-
ventional approach of examining tissue-specific expression
clearly loses resolution to the point that the geneticist may
miss many interesting functional profiles. Indeed, as Zhang
and colleagues show [6], tissue specificity alone can be a
poor predictor of gene function.
With this in mind, Zhang et al. [6] put forward their central
hypothesis that the pattern of gene expression across tissues
provides a multivariate discriminative signature of gene func-
tion: that is, knowing the expression level in several tissues at
once provides a more detailed description of gene function.
Visual examination of the gene-expression profiles appears to
support this strongly (see Figure 1) - but the eye can be
deceived. To test the assertion more rigorously, machine-
learning (pattern-recognition) algorithms were used to infer a
model to predict function for 7,387 genes labeled by Gene
Ontology, using the expression measurements for the genes
across the 55 tissues. If the authors’ hypothesis is correct then
the vector of 55 tissue-specific expression measurements
should contain discriminative information on gene function
and the algorithm should be able to classify correctly the
corresponding GO-BP annotations. The results show that
there is indeed significant predictive information, as com-
pared to a control experiment using randomized gene
labels. Zhang et al. [6] then proceeded to use the model to
predict the physiological function for 12,123 unannotated
genes, in other words, those with no associated GO-BP label.
Of the 12,000 or so tested, Zhang et al. concentrated on a
subset, 1,092 genes, which had predicted precision scores
above 50%; this represents the subset of unannotated genes
about which the algorithm is most confident in making a
prediction. In order to see whether this confidence is war-
ranted, supporting literature, protein-domain information
and de novo functional analysis were used, all of which largely
validated the predictions. Put together, these findings consti-
tute conclusive evidence that cross-tissue patterns of gene
expression can provide signatures of gene function.
In adopting a machine-learning approach, support vector
machines (SVMs) were chosen for making predictions, but
it might have been just as fruitful to have used less sophisti-
cated methods. Often more simple models, such as linear
discriminant analysis, can work nearly as well, and more-
over they are more interpretable [10]. For instance, it would
20.2 Journal of Biology 2004, Volume 3, Article 20 Holmes and Brown />Journal of Biology 2004, 3:20
be interesting to examine the discrimination profiles for the
various GO-BP categories, for example by investigating the
signature of tissue-specific expression that distinguishes,
say, a ‘cell-cell adhesion’ gene from a non-cell-cell adhesion
gene (see Figure 1). Furthermore, it would be interesting to
investigate the weight given to each tissue in classifying a
particular functional category, and to report for each func-
tional category which tissue’s measurements appeared most
informative for function classification. It seems apparent
that not all of the 55 tissues would be necessary for every
GO-BP classification: some functional categories are likely
to be characterized by a small subset of tissues, while for
others we may need a wider profile in order to reach reason-
able precision. Such an analysis may well reveal interesting
structure within the data.
Speculating a little further, the work opens up the intriguing
prospect of using quantitative information to help refine
and further validate the qualitative models themselves. For
example, if a particular Gene Ontology category is poorly
discriminated by gene-expression data, does this suggest
that the ontological level is perhaps too coarse? Expression
profiles may suggest a refinement of ontological categories;
for example, as noted by Zhang et al. [6], the category ‘cell-
cell adhesion’ appears to contain three distinct sub-groups.
Does this suggest that this GO-BP category may need refine-
ment? In conclusion, the work by Zhang et al. [6] provides
us with a clear message: a carefully designed study using
Gene Ontology and quantitative expression profiles can
reveal functional relationships and can be a powerful pre-
dictor of gene function. In addition, the study provides an
important resource for the genetics community, one that
will be built upon in the future as we attempt to provide a
comprehensive picture of the roles and functional discrimi-
nations behind every gene in the mammalian genome.
References
1. International Human Genome Sequencing Consortium. Initial
sequencing and analysis of the human genome. Nature
2001, 409:860-921.
Journal of Biology 2004, Volume 3, Article 20 Holmes and Brown 20.3
Journal of Biology 2004, 3:20
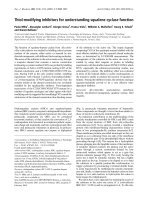
Figure 1
Examples of the results in Zhang et al. [6] (reproduced with permission). Each row of the image represents a gene and each column a tissue (labeled
at the bottom), with the color indicating the ratio of expression levels. Clusters of genes coordinately regulated in certain tissues correlate with the
biological functions indicated on the right. See the complete article [6] for a full version of this figure.
Ratio
Genes
Kidney
Liver
Adrenal
Lung
Aorta
Heart
Skeletal muscle
Skin
Digit
Snout
Tongue
Tongue surface
Trachea
Thyroid
Eye
Olfactory bulb
Brain
Striatum
Cortex
Cerebellum
Hindbrain
Spinal cord
Midbrain
Trigeminal nucleus
E10.5 Head
E14.5 Head
Embryo 12.5
Embryo 9.5
Embryo
ES
Placenta 9.5
Placenta 12.5
Uterus
Ovary
Testis
Epididymus
Prostate
Colon
Large intestine
Small intestine
Pancreas
Stomach
Salivary
Teeth
Mandible
Femur
Knee
Calvaria
Bone marrow
Spleen
Lymph node
Bladder
Thymus
Brown fat
Mammary gland
Polyamine biosynthesis
Oxidative phosphorylation
Muscle contraction
Epidermal differentiation
Cell-cell adhesion
Regulation of neurotransmitter levels
Synaptic transmission
1 3 7 20
Mouse tissues
GO-BP annotations
2. International Human Genome Sequencing Consortium. Finishing
the euchromatic sequence of the human genome. Nature
2004, 431:931-945.
3. Mouse Genome Sequencing Consortium. Initial sequencing and
comparative analysis of the mouse genome. Nature 2002,
420:520-573.
4. The Comprehensive Knockout Mouse Project Consortium. The
knockout mouse project. Nat Genet 2004, 36:921-924.
5. The European Mouse Mutagenesis Consortium. The European
dimension for the mouse genome mutagenesis pro-
gramme. Nat Genet 2004, 36:925-927.
6. Zhang W, Morris QD, Chang R, Shai O, Bakowski MA, Mit-
sakakis N, Mohammad N, Robinson MD, Zirngibl R, Somogyi E,
Laurin N, Eftekharpour E, Sat E, Grigull J, Pan Q, Peng WT,
Krogan N, Greenblatt J, Fehlings M, van der Kooy D, Aubin J,
Bruneau BG, Rossant J, Blencowe BJ, Frey BJ, Hughes TR: The
functional landscape of mouse gene expression. J Biol
2004, 3:21.
7. Churchill GA: Fundamentals of experimental design for
cDNA microarrays. Nat Genet 2002, 32 Suppl:490-495.
8. Su AI, Cooke MP, Ching KA, Hakak Y, Walker JR, Wiltshire T,
Orth AP, Vega RG, Sapinoso LM, Moqrich A, et al. Large-scale
analysis of the human and mouse transcriptomes. Proc Natl
Acad Sci USA 2002, 99:4465-4470.
9. The Gene Ontology Consortium: Gene Ontology: tool for the
unification of biology. Nat Genet 2000, 25:25-29.
10. Hastie T, Tibshirani R, Friedman J: The Elements of Statistical
Learning. New York: Springer; 2002.
20.4 Journal of Biology 2004, Volume 3, Article 20 Holmes and Brown />Journal of Biology 2004, 3:20