Báo cáo sinh học: "A quantitative analysis of the mechanism that controls body size in Manduca sexta" docx
Bạn đang xem bản rút gọn của tài liệu. Xem và tải ngay bản đầy đủ của tài liệu tại đây (759.14 KB, 15 trang )
Research article
A quantitative analysis of the mechanism that controls body size
in Manduca sexta
HF Nijhout*, G Davidowitz
†
and DA Roff
‡
Addresses: *Department of Biology, Duke University, Durham, NC 27708, USA.
†
Department of Ecology and Evolutionary Biology,
University of Arizona, Tucson, AZ 85721, USA.
‡
Department of Biology, University of California, Riverside, CA 92521, USA.
Correspondence: HF Nijhout. Email:
Abstract
Background: Body size is controlled by mechanisms that terminate growth when the
individual reaches a species-specific size. In insects, it is a pulse of ecdysone at the end of
larval life that causes the larva to stop feeding and growing and initiate metamorphosis. Body
size is a quantitative trait, so it is important that the problem of control of body size be
analyzed quantitatively. The processes that control the timing of ecdysone secretion in larvae
of the moth Manduca sexta are sufficiently well understood that they can be described in a
rigorous manner.
Results: We develop a quantitative description of the empirical data on body size
determination that accurately predicts body size for diverse genetic strains. We show that
body size is fully determined by three fundamental parameters: the growth rate, the critical
weight (which signals the initiation of juvenile hormone breakdown), and the interval between
the critical weight and the secretion of ecdysone. All three parameters are easily measured
and differ between genetic strains and environmental conditions. The mathematical
description we develop can be used to explain how variables such as growth rate, nutrition,
and temperature affect body size.
Conclusions: Our analysis shows that there is no single locus of control of body size, but
that body size is a system property that depends on interactions among the underlying
determinants of the three fundamental parameters. A deeper mechanistic understanding of
body size will be obtained by research aimed at uncovering the molecular mechanisms that
give these three parameters their particular quantitative values.
BioMed Central
Journal
of Biolo
gy
Journal of Biology 2006, 5:16
Open Access
Published: 2 August 2006
Journal of Biology 2006, 5:16
The electronic version of this article is the complete one and can be
found online at />Received: 30 January 2006
Revised: 13 April 2006
Accepted: 28 April 2006
© 2006 Nijhout et al.; licensee BioMed Central Ltd.
This is an Open Access article distributed under the terms of the Creative Commons Attribution License ( />which permits unrestricted use, distribution, and reproduction in any medium, provided the original work is properly cited.
Background
Body size is an obvious and important characteristic of
animals. It is highly correlated with fitness, and an increase
in body size is one of the most common trends seen in evo-
lutionary biology. The mechanisms by which genes affect
body size have been widely studied. Genetic dwarf and
giant strains are known for many animals. In both verte-
brates and invertebrates, the genes that affect body size
commonly exert their effect by altering the production of
growth factors, or by altering the cellular response to
growth regulators [1,2]. There has been much recent inter-
est in the developmental mechanisms that control body
size in insects [3]. Much of this work has used Drosophila as
a model system and has focused on elucidating the role of
insulin signaling in the regulation of growth and size, and
on discovering the degree to which genetically and envir-
onmentally induced changes in body size are associated
with changes in cell size or cell number [3-9]. It is now well
established that increased insulin signaling, through over-
expression of insulin-like peptides or overexpression of the
insulin receptor, results in increased body size, and that
reduction in insulin signaling is accompanied by a reduc-
tion in body size. Although the empirical correlation
between insulin signaling and body size is well docu-
mented in Drosophila and is believed to be widespread
among insects, it is not at all clear by what mechanism
insulin affects body size. Presumably insulin controls cyto-
plasmic growth and cell proliferation and this is directly
related to somatic growth. But exactly how somatic growth
is, in turn, related to the final body size that an individual
achieves is a mystery. This gap in our understanding is in
part due to the fact that in Drosophila we do not fully
understand the chain of events that results in the termin-
ation of the growth phase when the larva has achieved its
species-characteristic size [3].
Body size is also affected by nutrient quantity and quality
[10,11]. Nutrient restriction causes a diminution of body
size, and it appears that nutrients affect growth rate and
body size primarily by altering the secretion of insulin-like
peptides. Temperature also has an effect on body size, and
higher temperatures generally result in the development of
animals of smaller body size. The mechanism by which
temperature produces this effect in Drosophila has not yet
been elucidated, but it is understood in the larva of another
insect, the moth Manduca sexta, commonly known as the
tobacco hornworm [12].
Size determination depends critically on the mechanism
that causes a larva to stop growing. In all insects, including
Drosophila, the immediate stimulus for the cessation of
growth is the secretion of ecdysone, so the mechanism that
controls the secretion of ecdysone must be part of the
mechanism that controls size. The chain of events that leads
to the secretion of ecdysone in the context of size regulation
is today best understood in Manduca [3,12,13], which has
long served as the model organism for insect endocrinology
and postembryonic developmental physiology [14]. The
sequence of physiological events and feedback mechanisms
that culminate in the cessation of growth in Manduca are
now sufficiently well understood that they can be described
in explicit quantitative terms.
Most biological regulatory systems are sufficiently complex
and nonlinear that they cannot be credibly analyzed
through standard thought experiments and control dia-
grams. A mathematical description, however, provides an
objective method for establishing the level of our under-
standing of a process. This is because it forces us to be
explicit about all underlying assumptions, and quickly
reveals whether the hypothesized interactions can actually
produce the observed behavior of a system. A mathematical
description allows us to explore the way in which the
genetic, physiological and environmental determinants of
body size interact, and allows us to examine their relative
significance in body-size determination under different
genetic and environmental circumstances. An accurate and
well supported mathematical description of a complex
process can also be used to make predictions about how a
system will behave under novel or extreme conditions, and
to do in silico ‘experiments’ that would be impractical or
time-consuming to do on living organisms. We previously
[12] proposed an endocrine-based physiological mecha-
nism that describes the regulation of body size. In the two
sections that follow we outline the critical features of that
mechanism, which we then use to formulate a quantitative
model for growth and size determination.
Larval growth
In the laboratory, M. sexta has five larval instars, and thus
undergoes four larval molts. The cuticle of most of the body
wall of the larva is soft and pliable. During the intermolt
period the soft cuticle grows in thickness, but also increases
in surface area through intercalary insertion of the chitin
and protein matrix that makes up the bulk of the cuticle
[15]. Presumably this soft integument could grow indefi-
nitely, and this should obviate the need for periodic
molting, were it not for the heavily sclerotized head capsule
and mouthparts, which cannot grow and can therefore only
increase in size through a classical molting cycle. An addi-
tional constraint to intermolt growth is provided by the
outermost layer of the cuticle, the epicuticle. The epicuticle
is laid down as a finely corrugated sheet that gradually flat-
tens out as the underlying cuticle grows [15,16]. The epicuti-
cle is inextensible and once its fine folds are stretched flat it
allows no further increase in the surface area of the cuticle.
16.2 Journal of Biology 2006, Volume 5, Article 16 Nijhout et al. />Journal of Biology 2006, 5:16
Adult insects cannot grow and, therefore, adult body size is
determined by the size the larva has reached when it stops
feeding and begins the metamorphic molt. The final size of
the larva, and as a consequence the size of the adult, is
determined by three factors: the number of larval instars,
the size increment at each larval molt, and the size within
the last larval instar at which the larva stops feeding and ini-
tiates metamorphosis.
Evolution of body size could be accomplished by evolution
in any one (or all) of these factors. In the insects there is a
general phyletic trend to decrease the number of instars and
increase the size increment at each larval molt [14,17]. The
largest of insects, the Goliath beetles of Africa, only have
three larval instars, so here evolution of large body size
from a small-bodied scarabaeid ancestor (all of which have
three larval instars) has clearly occurred by increasing the
size increment at each larval molt. In the Lepidoptera too,
to which Manduca belongs, the evolution of large body size
is accompanied by an increase in size increment, not an
increase in the number of larval instars.
The size increment at each molt (the growth ratio) is
determined by the amount of cell division and cell enlarge-
ment of the epidermis that occurs at the time of the molt
when the cuticle of the next instar is laid down. Evolution
of the growth ratio is presumably due to evolutionary
changes in the combined effects of cell multiplication and
cell enlargement.
The mechanism of body size determination in
Manduca
The initial mass of each larval instar is a constant multiple
of that of the previous instar (see below). This is a common
feature of insect growth and is referred to as Dyar’s rule. In
Manduca, the last (fifth) larval instar grows from a mass of
about 1.2 g to about 11 g, so almost 90% of the final mass
of the larva is gained during this single instar. Because most
of the body mass of Manduca accumulates during the last
larval instar, variation in the mechanisms that control
growth and size in the last larval instar will have a greater
effect on final body size than variation in the mechanisms
that operate in earlier instars.
It has been known for some time that the last larval instar
has a distinctive developmental physiology that differs
from that of the earlier instars [14]. In brief, in the last
larval instar (but not in the earlier instars), the secretion of
the prothoracicotropic hormone (PTTH) and the secretion
of ecdysteroids are inhibited by juvenile hormone (JH).
The titer of JH is high during the early portions of the
instar, but in about the middle of the instar secretion of JH
stops and the level of JH esterase (JHE), an enzyme that
inactivates JH in the hemolymph, rises [18-22]. The titer of
JH gradually declines, and when it has disappeared secre-
tion of PTTH and ecdysteroids is disinhibited. The actual
secretion of PTTH is controlled by a photoperiodic clock
and can only occur during a well defined ‘photoperiodic
gate’ [23,24], an 8 hour window of time that recurs each
day. In Manduca, PTTH secretion occurs during the first
photoperiodic gate after JH has disappeared from the
hemolymph [14,25]. PTTH stimulates the secretion of
ecdysteroids, and the initial rise of ecdysteroids causes the
larva to stop feeding, purge its gut contents, and initiate a
period of active ‘wandering’ in search of a suitable place to
pupate. This decision pathway for size determination is
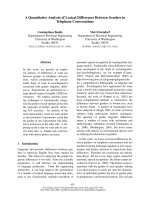
illustrated in Figure 1.
The critical weight is the weight at which the secretion of JH
stops, and this sets in motion a sequence of physiological
events that culminate in the cessation of growth and the ini-
tiation of metamorphosis. Once JH secretion stops, the sub-
sequent series of physiological events is independent of
further nutrition or growth. The critical weight can thus be
operationally defined as the weight at which the time to the
gut purge and initiation of wandering is independent of
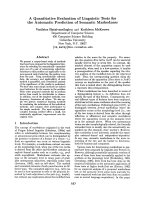
further feeding and growth (Figure 2). The value of this criti-
cal weight is determined by both genetic and environmental
factors, and the evolution of body size in Manduca has been
shown to be due, among other factors, to the evolution of
the critical weight [13]. The mechanism by which a larva
assesses its body size and its critical weight are not known
[14], but the critical weight appears to be a function of the
initial weight of the instar (see below).
The peak size a Manduca larva achieves in the final instar is
thus a function of five variables: the initial size of the instar,
the growth rate, the critical weight, the time required to
break down JH, and the timing of the photoperiodic gate for
PTTH secretion. There is genetic variation for each of these
physiological determinants ([26] and our unpublished
data); evolution of body size could therefore be due to
evolutionary changes in one or more of these factors [13].
Results
Parameters for normal growth
In our laboratory colony, larvae vary in their growth rate
and in the peak size they attain before purging their gut.
They purge on days 17 to 20 after hatching. The growth tra-
jectory of a single representative larva of Manduca is shown
in Figure 3. This individual purged its gut on the 18th day
after hatching from the egg. Growth stops periodically as the
larva molts from one instar to the next, and after day 18 the
mass declines as the larva purges its gut contents, enters the
wandering stage, and prepares for pupation. Overall growth
Journal of Biology 2006, Volume 5, Article 16 Nijhout et al. 16.3
Journal of Biology 2006, 5:16
during the feeding period is approximately exponential
(Figure 3b), as is typical for insects. Within each instar,
growth is also approximately exponential, but it is clear that
the exponent declines progressively from instar to instar.
Regression of the exponent value on instar number (Figure
3b inset) shows that the growth exponent declines approxi-
mately linearly from instar to instar. In any given instar the
value exponent is given by: exponent = 1.01 - 0.098*instar.
Thus, in the fifth instar the growth is described approxi-
mately by mass = W
0
*e
0.52*t
, where t is the time in days
from the beginning of the fifth instar and W
0
is the initial
mass of the instar.
Exponential size increase and the critical weight
Although the growth exponent decreases gradually from
instar to instar, the size increment from instar to instar is
constant. That is, the final mass of each is a constant multi-
ple of the final mass of the previous instar. As a conse-
quence, the mass of a larva at each larval molt increases
exponentially from instar to instar (Figure 4). The only
exception to this rule is the final mass of the last larval
instar, which is substantially larger than expected. Figure 4
illustrates that the predicted final mass of the fifth instar
16.4 Journal of Biology 2006, Volume 5, Article 16 Nijhout et al. />Journal of Biology 2006, 5:16
Figure 1
Flow chart for the mechanism that controls body size in Manduca.
During the last larval instar there are three physiological decision points
(diamonds) that control the timing of the cessation of growth. The
amount of growth in the intervals between these conditional events
determines the final size. PCG, growth prior to the critical weight;
during this period the larva achieves approximately half its final mass.
ICG, the interval to cessation of growth, which corresponds to the
delay period between attainment of the critical weight and the
secretion of prothoracicotropic hormone (PTTH) (see Figure 2).
Last larval
instar
Ye s
Ye s
Ye s
No
No
No
Passed
critical
weight?
JH cleared
from
hemolymph?
Photoperiodic
gate open?
Continue
growing
Continue
growing
Continue
growing
JH titers
decline
Secrete PTTH
and ecdysone
Stop feeding
Stop growing
Begin metamorphosis
ICG
PCG
Figure 2
Method for establishing the critical weight and the delay time for PTTH
secretion. Larvae are starved at various weights and the onset of
wandering is determined and compared with that of larvae of similar
weights that are allowed to continue feeding. The critical weight is the
smallest weight at which there is no difference between starved and
feeding larvae in the time required to initiate PTTH secretion and enter
the wandering phase. The delay time is the time between achieving the
critical weight and the actual secretion of PTTH, which corresponds to
the ICG in Figure 1. Thus at the critical weight a series of events are set
in motion that lead to PTTH secretion and that are not affected by
subsequent nutrition. The critical weight occurs in about the middle of
the growth phase of the fifth larval instar, so a larva can approximately
double its mass after passing the critical weight.
8
7
6
5
4
3
2
1
0
234
Critical weight
Weight (g)
Days to PTTH secretion
Delay
time
Feeding (control)
Starved
5678
should be about 5.4 g, on the basis of a projection from an
exponential regression on the masses of earlier instars.
Thus, if Manduca had six or more larval instars, we would
expect the fifth instar to molt to the sixth at a mass of about
5.4 g. The actual final mass of the fifth instar is about
11.5 g, about twice the expected mass.
Interestingly, the predicted mass at a presumptive fifth to
sixth instar molt (5.4 g) is very close to the critical weight
(approximately 5.3 g) for the strain in which these measure-
ments were made. We have also measured the critical
weights and growth coefficients for several other genetic
strains of Manduca that differ substantially in growth rate
and body size (Figure 5). We found that there is an almost
perfect linear relationship between the critical weight and
the expected final mass of the fifth instar predicted by the
size increments of earlier instars.
This finding suggests that the physiological changes initi-
ated at the critical weight are somehow related to those that
accompany a normal larval-larval molt. Moreover, this
finding shows that the critical weight is a simple multiple of
the mass of the larva at the beginning of the final
larval instar.
It is therefore possible to derive an equation that relates the
critical weight to the size increment and initial conditions.
In general, the final size of each of the first four instars is a
function of the size increment, and is given by the equation
final mass of instar = W
1
*e
D*instar
,(1)
where W
1
is the mass of the hatchling larva and D is the size
increment for the first four instars (= 1.66 in Figure 4). The
critical weight (CW) in the fifth instar can also be estimated
from the initial weight of the fifth larval instar (W
5
) as
follows:
CW = W
5
*e
D
. (2)
In the several genetic strains of Manduca we have examined,
W
5
varies from 0.85 g to 2.25 g, and D varies from 1.45 g to
1.85 g. Genetic and environmental variation in the values of
W
5
and D will have profound effects on the value of the crit-
ical weight and, by extension, the final weight of the larva.
Journal of Biology 2006, Volume 5, Article 16 Nijhout et al. 16.5
Journal of Biology 2006, 5:16
Figure 3
Growth trajectory of a typical larva. Growth occurs during five larval
instars, separated by brief periods of molting during which no growth
occurs. (a) Linear plot: the peak on day 18 is the maximum size the
larva attained and marks the time at which the larva stopped feeding
and growing. Decreasing mass after this time is due to the purge of gut
contents. (b) Semilogarithmic plot: dashed lines are exponential
regressions on the growth phases of each of the five larval instars. The
inset shows a plot of the exponents of the regressions in (b) showing a
linear decrease with instar (the regression is:
exponent = 1.01 - 0.098*instar; R
2
= 0.92).
12
10
8
6
4
2
0
10
0.1
0.01
0.001
0510
Age (days)
Mass (g) Mass (g)
1.0
0.9
0.8
0.7
Growth exponent
0.6
0.5
0.4
0123
Instar
456
15 20
1
(a)
(b)
Figure 4
Final sizes of the five larval instars of Manduca sexta. The size of the first
four instars increase exponentially, but the final size of the fifth instar is
about twice (10.75 g) what would be expected (5.39 g) from the
regression on the earlier instars. The regression is:
weight = 0.0014*e
1.66*instar
(R
2
= 0.999).
0.01
0123
Instar
456
Weight at end of instar (g)
0.1
1
10
10.75
5.39
y = 0.0014e
1.66x
R
2
= 0.999
Growth of the fifth larval instar
A mean growth curve for a cohort of fifth-instar larvae from
a laboratory colony of Manduca from ecdysis to the time of
the gut purge is shown in Figure 6. Clearly, the overall
growth during the fifth instar is not exponential but resem-
bles a rather flat sigmoid. The slowdown and cessation of
growth at the end of the instar are due to the secretion of
ecdysteroids, which cause the larval to stop feeding and
enter the wandering stage in preparation for pupation. The
low growth rate at the beginning of the instar reflects the
time necessary for the biochemical and physiological
processes of molting to cease and those for feeding and
growth to reactivate.
In order to derive an equation that describes growth during
the fifth instar it is useful to know what the trajectory
would look like in the absence of the influence of ecdy-
steroids, which can be thought of as prematurely terminat-
ing the growth phase. In the last larval instar, ecdysteroid
secretion is inhibited by JH, and when larvae are treated
with JH they continue to grow well beyond their normal
final size [25,27]. It is therefore possible to deduce the
shape of the uninterrupted growth trajectory by inhibiting
the secretion of ecdysone with exogenous JH. When a
topical application of 50 g methoprene (a stable JH
analog) is given on days 1 and 2 of the fifth instar,
ecdysone secretion is inhibited and the larva continues to
grow for at least a week beyond the time that growth would
normally have stopped. The growth trajectory of JH-treated
larvae is shown in Figure 7.
The overall growth curve of methoprene-treated larvae
shows a gradually increasing growth rate until they reach a
mass approximately equal to the critical weight (5.3 g for
this strain of Manduca), followed by a decreasing growth
rate above that weight. We assume that the integument
poses an increasing resistance to growth as the larva
increases in size, and that this accounts for the decreasing
growth rate as the larva gets bigger. It is likely that growth in
these larvae finally stopped at the maximal size allowed by
the stretch of the epicuticle.
The critical weight
The critical weight has an important role in controlling the
final size of the larva. In the last larval instar, the critical
weight marks the initiation of a dramatic change in physiol-
ogy. After reaching the critical weight, the level of JHE in the
hemolymph rises abruptly [21,22] and the JH titer gradually
drops to zero. Once JH has disappeared, the secretion of
PTTH and ecdysone are disinhibited. When ecdysone is
secreted the larva stops feeding and growth stops.
The mechanism by which a larva assesses its critical
weight is unknown at present, but the data presented
16.6 Journal of Biology 2006, Volume 5, Article 16 Nijhout et al. />Journal of Biology 2006, 5:16
Figure 5
Relationship between the empirically measured critical weight of a fifth-
instar larva and the predicted weight at which a fifth instar would have
molted to a sixth larval instar. The predicted weight is based on the
projected terminal weight of the last larval instar deduced from the
exponential increase from instar to instar (Dyar’s rule), as shown in
Figure 4. The fit to a slope of 1 is excellent.
9
Critical weight from growth coefficient (g)
8
7
y = 1.05x
R
2
= 0.997
6
5
4
3
2
1
0
01234
Empirical critical weight (g)
56789
Figure 6
Growth of a fifth-instar larva with a critical weight of 5.2 g. The vertical
dotted line is drawn through the time point at which the critical weight
is passed. The growth trajectory before this time is concave upward
and the trajectory after this time is concave downward, and the best-
fitting equations for each of these segments of the growth trajectory
are indicated.
12
10
8
6
4
2
0
012
y = 1.22e
0.60x
R
2
= 1
y = 7.9ln(x) - 1.85
R
2
= 1
Weight (g)
3
Age (days)
45
above show that it corresponds to the weight at which the
fifth instar larva would have molted to the next larval
instar, had it not been the final larval instar (see Figure
5). In addition, we have found that there is a simple
linear relationship between the critical weight and the
initial weight of the fifth instar larva across a broad range
of body sizes and genetic backgrounds (Figure 8). The
critical weights used to construct Figure 8 were deter-
mined using the method outlined in Figure 2, and show
that the critical weight is approximately 5.3 times the
initial weight of the instar, minus 0.8 g. This is in close
accord with the interpretation of Figure 4. The critical
weight thus has a simple linear relation to the initial
weight of the final instar larva, and variation in the initial
weight accounts for 95% of the variation in the critical
weight (Figure 8).
There are various mechanisms that could have this property.
What would be required is a measure or process that
changes with the mass of the larva and for which the larva
can measure the ratio between the current state and the state
at the beginning of the instar. Stretch reception in which the
length of the stretch receptor is set at the beginning of the
instar provides a plausible mechanism [28,29], as does the
prothoracic gland size measure described by [30].
A mathematical description of growth and size
determination
Growth before the critical weight
A model for growth and size determination must accurately
replicate both the normal growth trajectory of a larva and
the normal duration of the growth period. In other words,
the model must account for both the growth trajectory and
the decision point at which growth stops.
Growth is exponential until the critical weight is reached,
after which the growth rate declines gradually. Exponential
growth is described by
dW/dt = k*W, (3)
where W is the mass in g and k is the growth rate. Equation
(3) has a solution:
W(t) = W
5
*exp(k*t), (4)
where W(t) is the mass at time t, W
5
is initial weight at the
beginning of the fifth instar, and k is the growth exponent.
The growth exponent can be deduced from the size of the
larva at a given time by solving equation (4) for k:
k = ln(W(t)/W
5
)/t.(5)
Journal of Biology 2006, Volume 5, Article 16 Nijhout et al. 16.7
Journal of Biology 2006, 5:16
Figure 7
Growth trajectories of normal and JH-treated larvae of Manduca.
JH-treated larvae (open circles) received a topical application of 50 g
methoprene (a stable JH analog) when they reached a weight of 3 g and
again when they reached a weight of 6 g. Untreated larvae (filled circles)
ceased feeding, purged their gut and entered the wandering stage on
day 4. JH-treated larvae continued to feed for more than 2 weeks, but
stopped growing after about 10-12 days, indicating that there is a
physical limitation to the maximal size to which they can grow. Each
curve is the mean of five larvae.
18
16
Control
JH-treated
14
0246
Age (days in 5th instar)
Weight (g)
81012
12
10
8
6
4
2
0
Figure 8
Relationship between the mass of the larva at the beginning of the last
larval instar and the critical weight (CW), at which the decision to
initiate the endocrine events that lead to metamorphosis is made.
Each point is from a different genetic strain of Manduca that differs in
body size and development time (G.D., D.A.R. and H.F.N.,
unpublished observations). The regression is:
CW = 5.3*initial mass - 0.8 (R
2
= 0.95).
10
8
6
Critical weight (g)
4
2
0
0.6 0.8 1.0
y = 5.33x - 0.8
R
2
= 0.95
1.2
Initial mass of 5th instar (g)
1.4 1.6 1.8
Because the overall growth curve is a rather flat sigmoid
with the inflection point at around the critical weight (on
day 3 under our ‘standard’ conditions), the growth rate
between days 2 and 4 of the fifth instar larva is approxi-
mately linear. We have found that a close approximation
of the growth exponent, k, can be obtained from the
growth rate on day 3 and the initial weight of the instar.
This eliminates the need to obtain a long series of weight
measurements to determine the value of k. We begin by
establishing the relationship between the growth expo-
nent (k) and the growth rate (GR) on day 3 (Figure 9a).
The best fit to this relationship is given by k = 0.2*ln(GR)
+ C, where C is a constant that depends on the initial
weight of the fifth instar larva, which as shown in Figure
9b is given by C = 0.57*e
-0.54*W
5. Combining these two
equations gives:
k = 0.2*ln(GR) + 0.57*e
-0.54*W
5 .(6)
Equations (3) and (4) thus describe growth until the critical
weight is achieved. The time at which the critical weight is
reached (t
CW
) can be obtained by setting the left-hand side
of equation (4) to the value of the critical weight and
solving for t, which gives:
t
cw
= ln(CW/W
5
)/k (7)
Growth after the critical weight
As noted above, the critical weight also marks the point at
which the growth rate of the last instar larva changes from
exponentially increasing to gradually declining (see Figure
6). This implies that the growth exponent must decline as
the larva grows past its critical weight. The rate of decline of
the growth exponent can be derived empirically from the
growth trajectories of JH-treated larvae (Figure 10). We
found that the rate of this decline is the same in larvae with
different growth rates and different maximal sizes, and we
assume, therefore, that it is characteristic of the species,
rather than of a particular individual or genetic strain. After
the critical weight, the growth of a larva is therefore given by
dW/dt = k*d*W, (8)
where d describes the rate of decline of the exponent k. The
analysis in Figure 10 shows that d = 1.43*exp(-0.11*t). Sub-
stituting this formula for d into equation (8) and solving
the differential equation gives the following expression for
growth after the critical weight:
w(t) = CWe
-13ke
-11t
(9)
where CW is the critical weight and t is the time in days.
Duration of the growth period
In our strains of Manduca, ecdysis to the fifth instar occurs
between 2 hours and 6 hours after the lights are switched
on, on a cycle of 16 hours light and 8 hours dark (a 16L:8D
photoperiod), and feeding begins within an hour after
16.8 Journal of Biology 2006, Volume 5, Article 16 Nijhout et al. />Journal of Biology 2006, 5:16
Figure 9
Derivation of growth exponent from growth rate on day 3. (a) The
relationship between growth rate and growth exponent for larvae with
the same initial weight. The relationship is best fit by a logarithmic
regression where k = 0.2*ln(GR) + C, where C is a constant that depends
on the initial weight of the instar. In this regression the initial weight was
1.5 g, which gives C = 0.25. (b) The relationship between C and the
initial weight. An exponential regression gives the best fit. Substituting
the equation in (b) for the constant C in k = 0.2*ln(GR) + C gives
k = 0.2*ln(GR) + 0.57*e
-0.54*W
5. So k can be deduced from the initial
weight of the instar and the growth rate on the third day of the instar.
0.7
0.6
0.5
0.4
0.3
y = 0.20ln(x) + 0.25
R
2
= 0.9998
y = 0.57e
−0.54x
R
2
= 0.9998
y = 0.2ln(x) + C
0.2
0.0
0.1
0.2
0.3
0.4
0
0.0 0.5 1.0 1.5 2.0 2.5
1234
Growth rate day 3 (g/day)
Initial weight (g)
Growth exponentConstant (C)
567
(a)
(b)
ecdysis. So, for the purposes of the model, we assume that a
larva begins to grow 4 hours after lights-on. We define a day
as the interval between lights-off signals, and designate the
day on which growth begins as day 0 (zero).
The growth period ends with the secretion of PTTH and
ecdysone. During this period growth is partitioned between
the pre- and post-critical weight growth. The duration of
pre-critical-weight growth is given by Equation (7). The
duration of post-critical weight growth is determined by the
mechanism that controls PTTH secretion. PTTH secretion
can occur only during a well defined photoperiodic gate,
and in fact occurs during the first photoperiodic gate after
JH disappears from the hemolymph [14,25]. The mean time
required for these processes differs in different genetic
strains and must be determined by means of a critical
weight experiment, as outlined in Figure 2.
The photoperiodic gate for PTTH secretion is between 14
hours and 24 hours after lights-off [11]. Thus the interval
between the closing of a photoperiodic gate and the
opening of the next one is about 16 hours. A larva that
becomes competent to secrete PTTH just before a gate closes
will do so, but if a larva becomes competent to secrete PTTH
just after a gate closes it will continue to grow for an addi-
tional 16 hours, during which it can add an additional 1-2 g
of weight (depending on its growth rate).
Parameters of the model
The overall model thus consists of Equations (3) and (8)
and requires two parameters that relate to size and growth:
the initial mass of the fifth larval instar, W
5
(or the critical
weight, CW, which is a simple linear function of W
5
), and
the growth rate on day 3, GR (or the growth exponent, k,
which is related to GR as shown in Equation (6)). The
model also requires four parameters that relate to time: the
time at which growth starts, the mean time interval between
achieving the critical weight and PTTH secretion (called the
interval to cessation of growth, or ICG [12]), and the
opening and closing times of the photoperiodic gate. All
these parameters are empirically measurable and should be
characteristic of a given genetic strain. Changes in only three
of these parameters (GR, ICG and CW) have been shown to
fully account for the evolution of body size in a laboratory
strain of Manduca [13].
The model can be run on a computer by numerical integra-
tion of Equations (3) and (8), using time steps of one half
hour (or less) and keeping track of the time at which the
critical weight is attained (at which time Equation (8)
replaces Equation (3)), and the time at which photoperi-
odic gates open and close. Alternatively, the model can be
run by calculating the time for the critical weight and the
time of opening of the first gate after the ICG and substitut-
ing these values into Equations (4) and (9).
Tests and predictions of the models
Table 1 shows the parameter values and actual peak weights of
larvae of four different strains of Manduca, and Figure 11
shows the relationship between the actual peak weights of
these strains and their predicted peak weights using these para-
meter values. The model produces excellent predictions of the
sizes of genetic strains with different growth parameters.
In real life no two larvae will have exactly the same para-
meter values for the determinants of body size, because
these are affected by both genetic and environmental vari-
ation. We therefore examined the effect of introducing
variation in each of the parameters, by allowing them to
vary randomly with a mean given by the parameter values
for the H strain (Table 1) and a standard deviation (arbi-
trarily chosen) of 8% of the mean. Under these conditions,
the peak mass of the larvae is approximately normally dis-
tributed, but the time required to reach the peak mass is
multimodal (Figure 12). This is because the photoperiodic
gating of PTTH secretion leads to a periodic distribution of
the duration of the growth period. Interestingly, this has
no appreciable effect on the size frequency distribution. A
few animals reach their peak weight on the fourth day of
growth, the majority do so on the fifth day, and the
remainder on the sixth day. In each case a so-called ‘gating
bias’ [23] is evident: the first larvae to reach peak weight
do so relatively late in the gate, and for the subsequent
days the majority of larvae peak early in the gate. The
Journal of Biology 2006, Volume 5, Article 16 Nijhout et al. 16.9
Journal of Biology 2006, 5:16
Figure 10
Variation in growth rate constant. Empirical growth data for three
different strains: H (filled circles), B (triangles) and D (open circles),
shows that all have the same rate of decay of the growth constant.
1.2
1.0
0.8
0.6
0.4
0.2
0.0
34567
Age (days)
Growth constant
8910
y = 1.43e
−0.11x
R
2
= 0.998
reason for this is that if larvae become competent to secrete
PTTH while the gate is closed, they have to ‘wait’ until the
next gate opens, and will thus release PTTH and achieve
their peak weight very soon after the next gate opens. In this
simulation, most of the individuals in the last group of
larvae evidently became competent sometime during day 6
and therefore stopped growing (and thus reached their peak
weight) shortly after the gate opened.
Variation in food quality alters the growth rate without affect-
ing other parameters (G.D. and H.F.N., unpublished results);
how does it affect peak weight? The relationship between
growth rate and peak weight is illustrated in Figure 13a. The
‘sawtooth’ character of this relationship is due to the gating of
PTTH secretion. As the growth rate increases, the time of
PTTH secretion occurs progressively earlier in a gate, until the
beginning of that gate is reached after which all larvae secrete
PTTH at the beginning of the gate; then as growth rate
increases further there is an abrupt switch to the gate of the
previous day. Peak weight increases gradually with growth
rate but drops abruptly when larvae shift to an earlier gate,
after which the gradual increase continues. This kind of saw-
tooth relationship is seen in experimental data on larvae that
vary in growth rate (G.D., unpublished results).
As before, in real larvae all the other parameters of size regu-
lation vary among individuals, so in real life we should not
necessarily expect to observe the idealized relationships
shown in Figure 13a. Imposing normal random variation
(with standard deviations 8% of means, as before) on the
other parameters, using the T strain parameter values (from
Table 1), while varying growth rate systematically gives the
relationships shown in Figure 13b. Linear regression on the
simulated results in Figure 13b gives the following relation-
ship between growth rate and peak weight: peakweight =
growthrate*0.58 + 6.31. This is close to the empirically
observed relationship for this strain: peakweight =
growthrate*0.56 + 6.30. Using the H strain parameter
values we obtain the predicted relationship peakweight =
growthrate*0.90 + 8.32, whereas the empirical relation-
ship is peakweight = growthrate*1.03 + 8.23. Using the B
strain parameter values the model predicts the relationship
peakweight = growthrate*0.78 + 5.05, and the empirical rel-
ationship is peakweight = growthrate*1.07 + 4.19. Thus, the
model predicts the correct slope and intercepts of the linear
relationship between growth rate and peak weight very
accurately for the T and H strains, but not as accurately for
the B strain.
Body size and development time
The equations for the determination of body size are time-
dependent and therefore they also embody the relationship
between body size and development time (here we assume
development time to be equivalent to the duration of the
fifth larval instar). Development time and peak weight
interact in a complex way because development time is
determined, in part, by the time at which the critical weight
is reached [12], which depends on the growth rate; and the
growth rate also determines the amount of mass that is
added after the critical weight is passed. Figure 14 shows the
16.10 Journal of Biology 2006, Volume 5, Article 16 Nijhout et al. />Journal of Biology 2006, 5:16
Table 1
Parameter values for four genetic strains of Manduca used to
generate model results shown in Figure 11
Strain
Parameter B W H D
W
0
(g) 0.9 1.25 1.3 1.45
CW (g) 3.5 5.2 6.4 7.0
ICG 1.25 1.0 1.5 1.5
GR (g/day) 1.5 2.2 2.4 2.4
W(t) 3.4 4.7 5.5 6.1
t (days) 2.5 2.5 2.5 2.5
Peak weight (g) 5.9 7.7 10.2 10.8
SD 0.6 0.6 1.1 1.2
The average peak weight and standard deviation (SD) for each strain
are shown. W
0
, initial weight of fifth instar larvae; CW, critical weight;
ICG, interval to cessation of growth, that is, the interval between
attainment of the critical weight and the secretion of PTTH; GR, growth
rate; W(t), weight at time t (2.5 days in all cases reported here).
Figure 11
Predicted body sizes. Model predictions of peak weight of larvae of four
different genetic strains of Manduca that differ in their growth parameters.
‘Empirical data’ are from Table 1. Bars are standard deviations.
14
12
10
8
6
4
2
0
02468
Peak weight (g) - empirical data
Peak weight (g) - model predictions
10 12 14
y = 1.03x
R
2
= 0.99
relationship between peak weight and development time
under variation in the three fundamental parameters.
Covariance between body size and the components
of the mechanism
The mathematical model we have developed can be used to
predict how variation in the three fundamental determi-
nants of body size should affect variation of body size. To
do this we need to find the functional relationship between
peak weight and each of these three parameters. Because the
effect of each determinant on peak weight size is nonlinear,
and because the determinants interact with each other non-
linearly, there is no unique relationship between variation
in any one of them and the peak weight size.
The relationship between any given parameter and peak
weight depends on the specific values at which the other
parameters are held constant. Therefore, body size cannot
be expressed as a simple mathematical function of the three
fundamental parameters, but the relationship between body
size and each parameter must be found by solution or
numerical simulation of the generative equations. It is pos-
sible to compute the peak weight that corresponds to any
combination of values of the three fundamental parameters
(as was done in Figures 12-14). The three parameters can be
used as the orthogonal axes of a three-dimensional volume
in which each location gives the body size for a specific
triplet of parameter values. Such a volume is illustrated in
Figure 15. Such a graphical representation illustrates the
complexity and context dependency of the relationship
between any given parameter and body size.
Journal of Biology 2006, Volume 5, Article 16 Nijhout et al. 16.11
Journal of Biology 2006, 5:16
Figure 12
Simulation of population variation in body size and development time.
One thousand individuals were generated with small amounts of
random variation in all parameter values of the model. (a) Frequency
distribution of peak sizes; (b) frequency distribution of times at which
peak size was reached and wandering stage began. Hatched areas are
photoperiodic gates.
60
50
40
30
FrequencyFrequency
20
10
0
0
0 6 12 18 0 6 12 18 0 6 12
50
100
150
200
250
300
678910
Mass (g)
Time (h)
11 12 13
(a)
(b)
Figure 13
Model predictions of the effect of growth rate on body size.
(a) Predicted effect of variation in growth rate on peak size;
(b) predicted effect of variation in growth rate on peak size in the
presence of a small amount of random variation in all other parameter
values. Variation in the generating parameters masks the sawtooth
character of the ‘ideal’ relationship. The line is a linear regression.
10
8
6
4
2
10
8
6
4
2
0.5 1.0 1.5 2.0
Growth rate (g/day)
Peak weight (g)
2.5 3.0
y = 0.58x = 6.30
3.5
(a)
(b)
Discussion and conclusions
Three fundamental parameters
Body size in insects is determined by the mechanism that
controls the secretion of ecdysone at the end of larval life.
Ecdysone secretion causes the larva to stop feeding and
prepare for metamorphosis. No further growth is possible
and the size the larva has achieved at the time ecdysone is
secreted fully determines the body size of the adult. Our
quantitative analysis of the processes that lead to the
secretion of ecdysone produced a simple mathematical
model that predicts the correct body size and the correct
relationship between growth rate and body size for diverse
genetic strains of Manduca over a broad range of para-
meter values.
Although the mechanism that controls the secretion of
ecdysone is complex and has many steps, its properties are
determined by two parameters that relate to size and
growth (the initial weight or the critical weight, and the
growth rate), and three parameters that relate to time.
These are: the time required to eliminate JH and derepress
PTTH and ecdysone secretion (the ICG); and the times of
opening and closing of the photoperiodic gate for PTTH
secretion. Of these, the photoperiodic gate appears to be
identical for all strains we have examined so far (G.D.,
D.A.R. and H.F.N., unpublished results), which means that
only three fundamental parameters control variation in
body size in response to genetic and environmental vari-
ation: the growth rate, the critical weight and the ICG.
These three parameters are the same ones that were shown
to be responsible for evolutionary changes in body size
[13] and for phenotypic plasticity of body size [11] in a
laboratory colony of Manduca.
Our analysis has given new insight into the properties of
the critical weight. Until now, the critical weight was
known only as an empirical measure of the point at which
development becomes independent of nutrition, a point
that corresponds to the time at which JHE in the
hemolymph rises and JH is cleared. Our analysis shows
that there is a simple linear relation between the critical
weight and the initial weight of the instar, showing that the
critical weight is a relative measure that depends on the
prior growth history of the larva and the growth increment
at each molt, which determine the initial size of the final
larval instar. Moreover, the critical weight corresponds to
the weight at which a larva would have molted to the next
instar (had it not been in the final instar), which indicates
that there is an as yet undiscovered regulatory mechanism
that determines the size at which a larva-to-larva molt will
occur, and that this mechanism is somehow related to the
critical weight .
The control of body size
So what ‘controls’ body size? Many investigators working
at the molecular level have argued that insulin signaling is
somehow in control, because if insulin signaling is dis-
rupted, size regulation goes awry. It is clear from the struc-
ture of the mechanism we describe here, however, that
insulin must have some intermediate role within one of
the components of the mechanism, because we did not
need to account for insulin explicitly. It is likely that
insulin has a critical role in stimulating cellular growth and
proliferation, and its function is therefore probably part of
the growth-rate parameter in our mechanism. Insulin sig-
naling also affects the synthesis of JH in Drosophila [31]
and may therefore have an effect on body size regulation
via this mechanism as well. The growth rate has a strong
influence on body size (Figure 13, and see Equations (4)
and (9)) because it affects how much mass accumulates
between the critical weight and the secretion of PTTH and
ecdysone. During this period the larva can more than
double its mass, depending on its growth rate. In dis-
cussing Figure 13 we assumed that variation in growth rate
was due to variation in nutrient intake, and insofar as
nutrients exert their cellular effect by modulating insulin
signaling, variation in the growth rate can be considered
functionally equivalent to variation in insulin signaling. Of
course there are many other variables that affect the growth
rate, such as temperature and the availability of micro-
nutrients and vitamins, and all these factors must interact
in some way. It should therefore eventually be possible to
16.12 Journal of Biology 2006, Volume 5, Article 16 Nijhout et al. />Journal of Biology 2006, 5:16
Figure 14
Relationship between body size and development time. Variation was
introduced by allowing growth rate, critical weight and the ICG to
vary with a standard deviation of 10% of the mean values of strain B in
Table 1. The line is a linear regression on the data from 20,000
individuals (circles, many of which overlap in this plot).
10.00
9.00
8.00
7.00
6.00
5.00
4.00
4.00 5.00 6.00 7.00 8.00
Peak weight (g)
Development time (days)
9.00 10.00 11.00
y = 0.48x + 3.26
R
2
= 0.59
write a more detailed mathematical description of the
growth rate parameter that takes all these molecular and
cellular interactions into account. In the meantime we can
account for the effects of insulin signaling alone by assum-
ing a specific (for example linear) relationship between
insulin signaling and growth rate.
It should be clear that there is no single locus of ‘control’
of body size. In a complex mechanism it is possible to
disrupt any number of components and affect the
outcome, but that should not be construed to imply that
one of those components somehow controls the outcome.
Body size is a system property and results from the inter-
play of many equally important components. In this case
we identified three fundamental parameters. Each of these
parameters, in turn, is a complex system with many sub-
components and long causal chains of interactions that
establish their particular value in any one individual. It
should therefore eventually be possible to develop a more
detailed model with mathematical expressions for the
growth rate as a function of nutrition and insulin signal-
ing, and of the ICG as a function of JH synthesis, seques-
tration and catabolism.
Plasticity of body size
We can now give a mechanistic interpretation to our previ-
ous results [11], which showed that plasticity of body size
in response to diet quality is due to variation in growth rate
and critical weight, whereas plasticity of size in response to
temperature is due to variation in growth rate and the ICG.
The effect of diet quality is manifested as variation in the
growth rate, as noted above. In earlier instars the growth
rate affects the size at which the larva molts, and larvae
feeding on a poor-quality diet molt to each instar at a
slightly smaller size than larvae feeding on a better diet [32].
Hence the size of the larva at the outset of the fifth instar
will be affected by diet quality, and this, in turn, affects the
critical weight.
Temperature has a direct effect on the rate of biochemical
reactions. High temperature increases the growth rate and
also increases the rate at which JH decays during the ICG,
and this shortens the ICG. In insects there is an inverse rel-
ationship between body size and environmental tempera-
ture [33], and in Manduca this relationship is explained by
the interaction between the effects of temperature on
growth rate and the length of the ICG [12].
Journal of Biology 2006, Volume 5, Article 16 Nijhout et al. 16.13
Journal of Biology 2006, 5:16
Figure 15
Body size as a simultaneous function of the three fundamental parameters. The three parameters describe a volume of parameter space in which
body size is depicted on a color scale. The two panels show different views of the same graph. The cutout is made to illustrate some of the data
within the volume. The sawtooth-like discontinuities arise from the photoperiodic gating of PTTH and ecdysone secretion (see Figure 12a for a one-
dimensional representation). ICG, the interval to cessation of growth.
3.4
4.4
0.04
0.035
0.03
0.025
0.02
0.015
0.01
0.04
Growth exponent, k (h)
Growth exponent, k (h)
0.035
0.03
0.025
Critical weight (g)
Critical weight (g)
0.02
0.015
0.01
13 23 33 43 53
56789101112131415
ICG (h) ICG (h)
Body size (g)
5 6 7 8 9 101112131415
Body size (g)
63 13 23 33 43 53 63
5.4
6.4
7.4
3.4
4.4
5.4
6.4
7.4
Evolution of body size
Because the mathematical model defines the relationships
between the underlying developmental parameters and
final body size, it can be used to predict how the fundamen-
tal parameters should change under selection on body size.
Figure 15 represents a three-dimensional phenotypic land-
scape [34,35] for body size. The mean and variance of a
population can be depicted as a volume within the parame-
ter space of Figure 15 and the gradient along each parameter
axis can be calculated. Given a specific assumption about
the nature of genetic variability for each parameter, evolu-
tion on such a landscape can be calculated using the
methods outlined in [35].
Broader applicability of the model
It is worth considering whether the mechanism we have
uncovered in Manduca is applicable to other insects. Various
authors, working mainly with Drosophila, have suggested
that the control of body size resides at the level of insulin
and signaling through the pathway involving phosphoinosi-
tide 3-kinase and target of rapamycin (TOR) [2,9,36], activ-
ity of the small GTPase Ras in the prothoracic glands [37],
an antagonistic action between insulin and ecdysone [8],
and the relative size of the prothoracic gland [30]; and that
the control of body size must somehow depend on mecha-
nisms that regulate cell size or cell number [38]. Most of
this work was done using artificial genetic constructs that
disrupt or enhance specific molecular pathways in specific
tissues, and it has therefore been difficult to deduce how
these proposed mechanisms interact and exactly how they
play out in the normal regulation of growth and body size.
Surely these molecular events are important parts of the
complex network of interactions that establish final body
size, but it is difficult to see how they can be in ‘control’ in
the traditional meaning of the term. As noted above, body
size regulation is a system property and in order to under-
stand the system it is unhelpful to assume that control
resides at any one point in the nexus of interactions.
With the exception of the recent work of Mirth et al. [30],
previous studies on Drosophila have described growth and
body size in qualitative, not quantitative terms. Hence it has
been difficult to deduce whether the mechanism of size reg-
ulation in Drosophila and Manduca have anything in
common. By carefully quantifying growth and body size,
Mirth et al. [30] were able to show that Drosophila has a criti-
cal weight that is physiologically similar to that of Manduca
and the mechanism we describe here for body size regula-
tion in Manduca may therefore apply to Drosophila as well.
The principal difference is that starvation in Drosophila can
accelerate the onset of the PTTH and ecdysone secretion and
the wandering phase. This is likely to be an adaptation to
food exhaustion in a species that has little or no ability to
find a new food resource, as has been described in the
beetle Onthophagus [39]. This effect of starvation can be
quantified and can be used to develop a Drosophila-specific
variant of our model for size regulation.
Materials and methods
We focused on events in the last larval instar because 90%
of the increase in mass occurs during this developmental
stage, and because all the processes that affect final body
size occur during the last larval instar. We derived differen-
tial equations that describe growth under normal and
experimental conditions and, wherever possible, solved
these equations so that they expressed the various features
of the mechanisms of growth and size determination as
functions of the fundamental underlying variables. We
tested the resulting mathematical description by examining
whether it accurately describes growth and size regulation
under various aberrant or extreme genetic and environmen-
tal conditions that were not considered in developing the
model. Numerical simulation of the mathematical model
was done using Matlab (The Mathworks).
Several strains of Manduca were used to establish the para-
meter values for growth and size regulation. Unless other-
wise mentioned, most of the growth data were obtained
from the wild-type strain obtained by hybridizing labora-
tory strains obtained from University of Washington, Uni-
versity of Arizona and North Carolina State University,
designated strain H. Other strains used were the black larval
strain, a recessive mutation in the JH-regulatory pathway
that approximately halves body size, designated strain B; a
strain produced by selection for large body size and long
development time, designated strain D; and a strain that
had been recently collected from the wild, whose parame-
ters for growth and size regulation were originally measured
in 1972 (see [13]) and which is designated here as strain W.
Acknowledgements
We thank Julia Bowsher, Anna Keyte, Kevin Preuss, Alexandra Tobler
and Yuichiro Suzuki for critical comments on a draft of this article. This
work was supported by grants IBN-0212621 and IBN-0315897 from the
National Science Foundation.
References
1. Brogiolo W, Stocker H, Ikeya T, Rintelen F, Fernandez R, Hafen E:
An evolutionarily conserved function for the Drosophila
insulin receptor and insulin-like peptides in growth
control. Curr Biol 2001, 11:213-221.
2. Oldham S, Stocker H, Laffargue M, Wittwer F, Wymann M, Hafen E:
The Drosophila insulin/IGF receptor controls growth and
size by modulating PtdlnsP
3
levels. Development 2002,
129:4103-4109.
3. Nijhout HF: The control of body size in insects. Dev Biol
2003, 261:1-9.
16.14 Journal of Biology 2006, Volume 5, Article 16 Nijhout et al. />Journal of Biology 2006, 5:16
4. De Moed GH, De Jong G, Scharloo W: Environmental effects
on body size variation in Drosophila melanogaster and its
cellular basis. Genet Res 1997, 70:35-43.
5. Azevedo RBR, French V, Partridge L: Temperature modulates
epidermal cell size in Drosophila melanogaster. J Insect Physiol
2002, 48:231-237.
6. Johnston LA, Gallant P: Control of growth and organ size in
Drosophila. BioEssays 2002, 24:54-64.
7. Edgar BA, Nijhout HF: Growth and cell cycle control in
Drosophila. In: Cell Growth: Control of Cell Size. Edited by Hall MN,
Raff M, Thomas G. Cold Spring Harbor: Cold Spring Harbor Labo-
ratory Press; 2004:23-83.
8. Colombani J, Bianchini L, Layalle S, Pondeville E, Dauphin-Villemant C,
Antoniewski C, Carre C, Noselli S, Leopold P: Antagonistic
actions of ecdysone and insulins determine final size in
Drosophila. Science 2005, 310:667-670.
9. Neufeld TP: Body building: regulation of shape and size by
PI3K/TOR signaling during development. Mech Dev 2003,
120:1283-1296.
10. Ikeya T, Galic M, Belawat P, Nairz K, Hafen E: Nutrient-
dependent expression of insulin-like peptides from neuro-
endocrine cells in the CNS contributes to growth
regulation in Drosophila. Curr Biol 2002, 12:1293-1300.
11. Davidowitz G, D’Amico LJ, Nijhout HF: The effects of environ-
mental variation on a mechanism that controls insect
body size. Evol Ecol Res 2004, 6:49-62.
12. Davidowitz G, Nijhout HF: The physiological basis of reaction
norms: the interaction among growth rate, duration of
growth and body size. Integr Comp Biol 2004, 44:443-449.
13. D’Amico LJ, Davidowitz G, Nijhout HF: The developmental
and physiological basis of body size evolution in an insect.
Proc Biol Sci 2001, 268:1589-1593.
14. Nijhout HF: Insect Hormones. Princeton: Princeton University
Press; 1994.
15. Wolfgang WJ, Riddiford LM: Cuticular morphogenesis during
continuous growth of the final instar larva of a moth. Tissue
Cell 1981, 13:757-772.
16. Bennet-Clark HC: The relation between epicuticular folding
and the subsequent size of the insect. J Insect Physiol 1965,
9:43-46.
17. Williams CM: Growth in insects. In: Insect biology in the Future.
Edited by Locke M, Smith DS. New York: Academic Press;
1980:369-383.
18. Hammock BD: Regulation of juvenile hormone titer:
degradation. In: Comprehensive Insect Physiology, Biochemistry, and
Pharmacology. Volume 7. Edited by Kerkut GA, Gilbert LI. New
York: Pergamon Press; 1985:431-472.
19. Hammock BD, Roe RM: Analysis of juvenile hormone
esterase activity. Methods Enzymol 1985, 111:487-494.
20. Baker FC, Tsai LW, Reuter CC, Schooley DA: In vivo fluctu-
ations of JH, JH acid, and ecdysteroid titer, and JH
esterase activity, during development of fifth stadium
Manduca sexta. Insect Biochem 1987, 17:989-996.
21. Jesudason P, Venkatesh K, Roe RM: Haemolymph juvenile
hormone esterase during the life cycle of the tobacco
hornworm, Manduca sexta (L.). Insect Biochem 1990,
20:593-604.
22. Browder MH, D’Amico LJ, Nijhout HF: The role of low levels of
juvenile hormone esterase in the metamorphosis of
Manduca sexta. J Insect Sci 2001, 1:11.
23. Truman JW: Physiology of insect rhythms: I. Circadian
organization of the endocrine events underlying the
moulting cycle of larval tobacco hornworms. J Exp Biol 1972,
57:805-820.
24. Truman JW, Riddiford LM: Physiology of insect rhythms:
3. The temporal organization of the endocrine events
underlying pupation of the tobacco hornworm. J Exp Biol
1974, 60:371-382.
25. Nijhout HF, Williams CM: Control of moulting and meta-
morphosis in the tobacco hornworm, Manduca sexta (L.):
cessation of juvenile hormone secretion as a trigger for
pupation. J Exp Biol 1974, 61:493-501.
26. Davidowitz G, Roff DA, Nijhout HF: A physiological perspec-
tive on the response of body size and development time
to simultaneous directional selection. Integr Comp Biol 2005,
45:525-531.
27. Rountree DB, Bollenbacher WE: The release of prothoraci-
cotropic hormone in the tobacco hornworm, Manduca
sexta, is controlled intrinsically by juvenile hormone. J Exp
Biol 1986, 120:41-58.
28. Nijhout HF: Stretch-induced moulting in Oncopeltus
fasciatus. J Insect Physiol 1979, 25:277-282.
29. Nijhout HF: Abdominal stretch reception in Dipetalogaster
maximus (Hemiptera: Reduviidae). J Insect Physiol 1984,
30:629-633.
30. Mirth C, Truman JW, Riddiford LM: The role of the pro-
thoracic gland in determining critical weight for meta-
morphosis in Drosophila melanogaster. Curr Biol. 2005,
15:1796-1807.
31. Tu M-P, Yin C-M, Tatar M: Mutations in insulin signaling
pathway alter juvenile hormone synthesis in Drosophila
melanogaster. Gen Comp Endocrinol 2005, 142:347-356.
32. Nijhout HF: A threshold size for metamorphosis in the
tobacco hornworm, Manduca sexta. Biol Bull 1975,
149:214-225.
33. Atkinson D, Sibly RM: Why are organisms usually bigger in
colder environments? Making sense of a life history
puzzle. Trends Ecol Evol 1997, 12:235-239.
34. Rice SH: The evolution of canalization and the breaking of
Von Baer’s laws: modeling the evolution of development
with epistasis. Evolution 1998, 52:647-656.
35. Rice SH: Evolutionary Theory: Mathematical and Conceptual Foun-
dations. Sunderland: Sinauer; 2004.
36. Oldham S, Bohni R, Stocker H, Brogiolo W, Hafen, E: Genetic
control of size in Drosophila. Philos Trans R Soc Lond B Biol Sci
2000, 355:945-952.
37. Caldwell PE, Walkiewicz M, Stern M: Ras activity in the
Drosophila prothoracic gland regulates body size and
developmental rate via ecdysone release. Curr Biol 2005,
15:1785-1795.
38. Conlon I, Raff M: Size control in animal development. Cell
1999, 96:235-244.
39. Shafiei M, Moczek AP, Nijhout HF: Food availability controls
the onset of metamorphosis in the dung beetle Onthopha-
gus taurus (Coleoptera: Scarabeidae). Physiol Entomol 2001,
26:173-180.
Journal of Biology 2006, Volume 5, Article 16 Nijhout et al. 16.15
Journal of Biology 2006, 5:16