Báo cáo sinh học: "Growth control of the eukaryote cell: a systems biology study in yeas" ppt
Bạn đang xem bản rút gọn của tài liệu. Xem và tải ngay bản đầy đủ của tài liệu tại đây (721.34 KB, 25 trang )
BioMed Central
Open Access
Research article
Growth control of the eukaryote cell: a systems biology study in
yeast
Juan I Castrillo1Ô, Leo A Zeef1Ô, David C Hoyle2Ô, Nianshu Zhang1,
Andrew Hayes1, David CJ Gardner1, Michael J Cornell1,3, June Petty1,
Luke Hakes1, Leanne Wardleworth1, Bharat Rash1, Marie Brown4,
Warwick B Dunn6, David Broadhurst4,6, Kerry O’Donoghue5,
Svenja S Hester5, Tom PJ Dunkley5, Sarah R Hart4, Neil Swainston6,
Peter Li6, Simon J Gaskell4,6, Norman W Paton3,6, Kathryn S Lilley5,
Douglas B Kell4,6 and Stephen G Oliver1,6
Addresses: 1Faculty of Life Sciences, Michael Smith Building, University of Manchester, Oxford Road, Manchester M13 9PT, UK.
2Northwest Institute for Bio-Health Informatics (NIBHI), School of Medicine, Stopford Building, University of Manchester, Oxford Road,
Manchester M13 9PT, UK. 3School of Computer Science, Kilburn Building, University of Manchester, Oxford Road, Manchester M13 9PL, UK.
4School of Chemistry, Manchester Interdisciplinary Biocentre, University of Manchester, 131 Princess St, Manchester M1 7DN, UK.
5Cambridge Centre for Proteomics, Department of Biochemistry, University of Cambridge, Downing Site, Cambridge CB2 1QW, UK.
6Manchester Centre for Integrative Systems Biology, Manchester Interdisciplinary Biocentre, University of Manchester, 131 Princess St,
Manchester M1 7DN, UK.
ÔThese
authors contributed equally to this work.
Correspondence: Stephen G Oliver. E-mail:
Published: 30 April 2007
Received: 21 July 2006
Revised: 20 November 2006
Accepted: 7 February 2007
Journal of Biology 2007, 6:4
The electronic version of this article is the complete one and can be
found online at />
© 2007 Castrillo et al.; licensee BioMed Central Ltd.
This is an Open Access article distributed under the terms of the Creative Commons Attribution License ( />which permits unrestricted use, distribution, and reproduction in any medium, provided the original work is properly cited.
Abstract
Background: Cell growth underlies many key cellular and developmental processes, yet a
limited number of studies have been carried out on cell-growth regulation. Comprehensive
studies at the transcriptional, proteomic and metabolic levels under defined controlled
conditions are currently lacking.
Results: Metabolic control analysis is being exploited in a systems biology study of the
eukaryotic cell. Using chemostat culture, we have measured the impact of changes in flux
(growth rate) on the transcriptome, proteome, endometabolome and exometabolome of the
yeast Saccharomyces cerevisiae. Each functional genomic level shows clear growth-rateassociated trends and discriminates between carbon-sufficient and carbon-limited conditions.
Genes consistently and significantly upregulated with increasing growth rate are frequently
Journal of Biology 2007, 6:4
4.2 Journal of Biology 2007,
Volume 6, Article 4
Castrillo et al.
/>
essential and encode evolutionarily conserved proteins of known function that participate in
many protein-protein interactions. In contrast, more unknown, and fewer essential, genes are
downregulated with increasing growth rate; their protein products rarely interact with one
another. A large proportion of yeast genes under positive growth-rate control share
orthologs with other eukaryotes, including humans. Significantly, transcription of genes
encoding components of the TOR complex (a major controller of eukaryotic cell growth) is
not subject to growth-rate regulation. Moreover, integrative studies reveal the extent and
importance of post-transcriptional control, patterns of control of metabolic fluxes at the level
of enzyme synthesis, and the relevance of specific enzymatic reactions in the control of
metabolic fluxes during cell growth.
Conclusions: This work constitutes a first comprehensive systems biology study on growthrate control in the eukaryotic cell. The results have direct implications for advanced studies
on cell growth, in vivo regulation of metabolic fluxes for comprehensive metabolic engineering,
and for the design of genome-scale systems biology models of the eukaryotic cell.
Background
Metabolic control analysis [1] is a conceptual and mathematical formalism that models the relative contributions of
individual effectors in a pathway to both the flux through
the pathway and the concentrations of intermediates within
it. To exploit metabolic control analysis in an initial systems
biology analysis of the eukaryotic cell, two categories of
experiments are required. In category 1, flux is changed and
the impact on the levels of the direct and indirect products
of gene action is measured. In category 2, the levels of individual gene products are altered, and the impact on the flux
is measured. In this category 1 study, we have measured the
impact of changing the flux on the transcriptome, proteome, and metabolome of Saccharomyces cerevisiae. In this
whole-cell analysis, flux equates to growth rate.
Cell growth (the increase in cell mass through macromolecular synthesis) requires the synthesis of cellular components
in precise, stoichiometric quantities, and must be subject to
tight coordinate control [2-6]. Cell growth underpins many
critical cellular and developmental processes, yet comprehensive studies on growth rate and its control have lagged
behind those on cell-cycle progression [7,8], cell proliferation [4,6] and coupling between cell growth and division
[9,10]. A limited number of studies in batch (flask) cultures
in complex media have been reported for the important
model eukaryote Saccharomyces cerevisiae. These showed that
the coordinate expression of ribosomal protein genes with
growth rate appeared regulated almost entirely at the transcriptional level [11-13]. However, these batch studies
could not separate growth rate from nutritional effects [14].
Chemostat cultures in defined media constitute an adequate
alternative, allowing the study of physiological patterns
under controlled environmental conditions [14-17]. However, the majority of chemostat studies have mainly focused
on the characterization of environmental responses at a
single growth rate [18-20], and so the mechanisms involved
in the regulation of growth-rate-related genes are still poorly
understood. Previous investigations have been confined to
the RNA level; however, an increasing number of studies
demonstrate the importance of post-transcriptional (translational and post-translational) mechanisms [21-24]. This
evidence for control being exerted at multiple levels emphasizes the need to extend metabolic control analysis to
include the concept of modular control [25].
Comprehensive high-throughput analyses at the levels of
mRNAs, proteins, and metabolites, and studies on gene
expression patterns are required for systems biology studies
of cell growth [4,26-29]. Although such comprehensive data
sets are lacking, many studies have pointed to a central role
for the target-of-rapamycin (TOR) signal transduction
pathway in growth control. TOR is a serine/threonine kinase
that has been conserved from yeasts to mammals; it integrates signals from nutrients or growth factors to regulate cell
growth and cell-cycle progression coordinately [3,30-33].
We have studied the control of the yeast transcriptome, proteome, and metabolome in a manner that allows the separation of growth-rate effects from nutritional effects, and
have paid particular attention to the role of the rapamycinsensitive TOR complex 1 (TORC1) [32] in mediating
growth-rate control. Both the concepts and the data generated by these experiments should provide a useful foundation for the construction of dynamic models of the yeast cell
in systems biology [26-28].
Journal of Biology 2007, 6:4
/>
Journal of Biology 2007,
Results and discussion
Growth-rate effects revealed at all ‘omic’ levels
We wished to study the impact of growth rate on the total
complement of mRNA molecules, proteins, and metabolites in S. cerevisiae, independent of any nutritional or other
physiological effects. To achieve this, we carried out our
analyses on yeast grown in steady-state chemostat culture
under four different nutrient limitations (glucose, ammonium, phosphate, and sulfate) at three different dilution
(that is, growth) rates (D = µ = 0.07, 0.1, and 0.2/hour,
equivalent to population doubling times (Td) of 10 hours,
7 hours, and 3.5 hours, respectively; µ = specific growth
rate defined as grams of biomass generated per gram of
biomass present per unit time). We then looked for
changes that correlated with growth rate under all four
nutrient-limiting conditions, using principal components
analysis (PCA; see Materials and methods). Trends that
appear in all four nutrient-limited series, including carbonlimited cultures with equivalent glucose concentrations,
cannot be attributed to variations in residual substrate
concentrations (for example, different levels of glucose
repression). Instead, they must be due to intrinsic growthrate-related processes.
Gene expression at the mRNA level was investigated by transcriptome analysis using Affymetrix hybridization arrays.
Proteomic studies were performed using isotope tags for
multiplexed relative and absolute quantification (iTRAQ)
[34,35]. In this case, the four tags and labeling schema
applied (see Materials and methods) allowed us to test and
compare the proteomes of cells grown at µ = 0.1/hour (Td =
7 hours) with those of cells grown at µ = 0.2/hour (Td =
3.5 hours) for all four nutrient limitations. We were able to
detect and quantify a significant proportion of the yeast
proteome (around 700 proteins per nutrient-limiting condition; 1,358 proteins in total; see Materials and methods).
For the metabolome, which is the closest genomic level to
the cell’s phenotype [36,37], gas chromatography coupled
to time-of-flight mass spectrometry (GC/TOF-MS) was used
to analyze the complement of intracellular and extracellular
metabolites, that is, the endo- and the exometabolomes
[38,39].
Volume 6, Article 4
Castrillo et al. 4.3
yeast cells are well-adapted to growth under carbon-limited
conditions and are able to adjust the individual fluxes
through their metabolic network to regulate overflow
metabolism whatever overall flux is imposed by the external
supply of carbon substrate. This result is congruent with our
data from category 2 experiments (D. Delneri and S.G.O.,
unpublished work) in which we have examined the effect
that reducing the copy number of individual genes in
diploid cells has on flux by performing competition experiments, in chemostat cultures, between yeast strains heterozygous for individual gene deletions.
For all three levels of ‘omic analysis, the data show a clear
distinction between carbon-limited and carbon-sufficient
cells (Figure 1). Once the data from the carbon-limited
steady states have been excluded, both the endometabolome and the exometabolome data from all three carbonsufficient cultures show a clear and consistent growth-rate
trend (compare Figure 1c,e with d,f). In addition, for the
endometabolome data, the second principal component
separates the ammonium-limited cells from those grown
under phosphate and sulfate limitation (Figure 1d).
Figure 1a shows that the transcriptome data from nitrogenlimited cells at the lowest growth rate studied (0.07/hour)
do not obey the general growth-rate trend. Uniquely among
all the cultures that we analyzed, cells from these cultures
had a pseudohyphal, rather than a budding, growth pattern;
these data should allow us to define those genes whose
expression is specifically associated with filamentous
growth. We did not examine the proteome at µ = 0.07/hour
and so do not know whether this difference is reflected at
the protein level. However, the proteomic data from all
steady-state cultures at µ = 0.1/hour and 0.2/hour show the
same clear discrimination between carbon-limited and
carbon-sufficient cells and the same growth-rate-associated
trend as was found with the metabolome and transcriptome
data. The fact that all ‘omes’ studied display a growth-rateassociated trend suggests a multilevel control underlying
global regulation of cell growth, and we now examine these
levels in some detail.
Growth-rate control at the transcriptional level
Principal components analyses (PCA) of transcriptome,
proteome, and endo- and exometabolome data showed
clear growth-rate-associated trends for all omic levels
(Figure 1). In the case of the endo- and exometabolomes,
these trends are clearly revealed after independent analysis
of the carbon-limited and carbon-sufficient datasets (see
Figure 1d,f). This is because, in contrast to all other nutrient-limited steady states, the endo- and exometabolomic
profiles from cells in glucose-limited steady-state cultures
showed no clear growth-rate trend. We infer from this that
Hybridization-array technology was used to determine how
the levels of gene transcripts changed with both flux
(growth rate) and nutrient environment. While the transcriptomes of cells grown under each of the four nutrientlimiting conditions have their own characteristics (see
Additional data files 1 (Figures S1 and S2), 2 (Tables S1 and
S2), and 3), there is a common qualitative and quantitative
response to increasing growth rate that is independent of
the specific nutrient limitation (see Figure 1a, and Additional data file 1 (Figures S3 and S4)).
Journal of Biology 2007, 6:4
4.4 Journal of Biology 2007,
Volume 6, Article 4
Castrillo et al.
/>
Transcriptome
100
75
PC2 - 13%
N
0.07
(b)
P
50
0.20
25
0
−25
N 0.07
C
0.07
−75
0.20
0.20
20
N
P
10
0
C
S
−10
−20
0.10
−50
40
30
S
0.10
PC2 - 20.9%
(a)
Proteome
−30
−40
0.20
−100 −50
0
50
PC1 - 19.2%
0.10
0.10
−100 −80 −60 −40 −20 0
PC1 - 57.8%
100 150
20 40
Endometabolome
(c)
(d)
20
15
15
N
PC2 - 21.7%
PC2 - 15.2%
5
0
−5
−10
−20
N
0.07
10
10
−15
20
5
0
−5
P
−10
S
−15
C
P
S
0.20
0.10
0.07
0.10
0.20
−20
−25
−25
−30 −20 −10 0 10 20 30 40
PC1 - 22.5%
−30 −20 −10 0 10 20 30
PC1 - 26.2%
Exometabolome
10
PC2 - 16%
5
(f)
N P
S
15
0
−5
−10
C
P
S
5
0.20
0
−5
−10
−15
0.10
0.07
−15
−20
−30 −20 −10
0
PC1 - 27.3%
N
10
PC2 - 12%
(e)
10
−30 −20 −10
0
PC1 - 34.7%
10
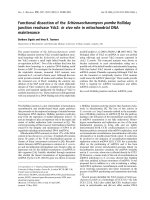
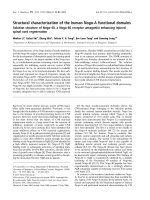
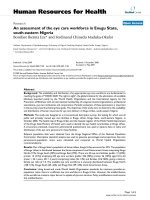
Figure 1
Principal components analyses (PCA) of steady-state chemostat cultures. The x and y axes represent the two main principal components (PC1,
PC2), the groups responsible for the majority of the variance in each global dataset (see Materials and methods). PCA and growth-rate trends
(dashed lines) at the (a) transcriptome (mRNA) level and (b) proteome level. (c,e) PCA and trends at the (c) endometabolome and (e)
exometabolome level, respectively. (d,f) Same as (c) and (e) for carbon-sufficient chemostat series (N-, P- and S- limited series; see text for
explanation). Each symbol represents a culture condition, colored as follows: red, carbon (C) limitation; blue, nitrogen (N) limitation; yellow,
phosphate (P) limitation; green, sulfate (S) limitation. The symbol shape indicates the specific growth rate, µ, of the culture: ovals, µ = 0.07/h;
triangles, µ = 0.1/h; rectangles, µ = 0.2/h. The circle round the blue ovals includes chemostat series exhibiting pseudohyphal growth (see text). As a
test of reproducibility, for each nutrient-limiting condition, one of the three µ = 0.07/h exometabolome samples was analyzed in triplicate.
Journal of Biology 2007, 6:4
/>
Journal of Biology 2007,
We performed an analysis of covariance (ANCOVA) in
order to identify those genes whose transcription was significantly and consistently upregulated or downregulated with
growth rate in all four nutrient-limitation conditions
studied (see Additional data file 1 (Figure S3)). These genes
were ranked by estimates of false discovery rate (FDR), in
this case the q-value [40] of the ANCOVA model (obtained
from the p-value, after multiple testing correction; see Additional data file 4), which represents the relative significance
in the (condition-independent) change in gene expression
with growth rate. Taking these q-values, we applied a cut-off
of 5% (q = 0.05 [40]; see Materials and methods). This produced a set of 493 genes whose expression is significantly
upregulated with increasing growth rate (q < 0.05; see also
Additional data file 4), and 398 genes that exhibited significant and concomitant downregulation with increasing
growth rate, independent of the culture conditions (see
Additional data files 1 (Figure S4) and 2 (Tables S3 and S4)).
Essential genes, that is, genes whose deletion results in a
failure to grow on rich glucose-containing medium [41,42],
are statistically overrepresented in the list of genes significantly upregulated with growth rate (161 out of 493
(32.6%); the fraction of all yeast genes that are essential is
around 17%), whereas they are significantly underrepresented in the downregulated list (22 out of 398 (5.5%,
again compared to 17%)). The proportion of essential open
reading frames (ORFs) in the downregulated set (5.5%) is
significantly different from the proportion of essential ORFs
that we find not to be subject to growth-rate control
(16.8%). In fact the fraction of essential ORFs in this nongrowth-regulated set is indistinguishable from the proportion of all yeast ORFs that are essential to growth (16.6%).
Despite the fact that genes that are downregulated with
increasing growth rate are rarely essential on rich medium
[41,42], the central role of all growth-regulated genes in cell
growth is confirmed by independent studies on deletion
mutants. This applies to both the essential and the nonessential genes in both the up- and downregulated sets
(Figure 2a). Thus, null mutations in many of the genes that we
have identified as growth-regulated have been reported to
either be lethal or produce a severe growth defect (84.0% in
the upregulated set; 64.6% in the downregulated set) [41,42]
(see Additional data file 2 (Tables S3 and S4)). In all, our
studies have revealed the importance of nonessential genes
whose expression is growth-rate regulated in determining
whether yeast can grow at normal rates. This applies to genes
whose expression is downregulated with increasing growth
rate, as well as those under positive growth-rate regulation.
From all these studies, a significant number of genes (891;
15% of the protein-encoding genes in the genome) have
Volume 6, Article 4
Castrillo et al. 4.5
their transcript levels determined by growth rate (Figure 2a).
While many of these genes (198, 22.2%) correspond to
ORFs of so far unknown function (Figure 2a; see also Additional data file 2 (Tables S3 and S4)), according to
Affymetrix (12 July 2006) and Gene Ontology (GO) annotations [43], an examination of the functions determined by
the remainder is instructive. Using two different GO analysis
tools (GoMiner [44] and GenMAPP [45]; see Additional
data files 1 (Figures S5-S16) and 2 (Tables S5-S11)) we
showed that the 435 genes of known function that are
upregulated with growth rate (see Figure 2a and Additional
data files 1 (Figure S4) and 2 (Table S3)) include a significant proportion whose products are involved in the biological processes of translation initiation, ribosome biogenesis
and assembly, protein biosynthesis, RNA metabolism,
nucleobase, nucleoside, nucleotide and nucleic acid metabolism, nucleus import and export and proteasome function
(see Additional data files 1 (Figures S5 and S11) and 2
(Tables S3 and S5)). The corresponding analysis of GO molecular functions for the same gene set showed the following
to be overrepresented: translation initiation factor activity
and nucleic acid (RNA) binding, structural constituent of
ribosome activity, ligase activity forming aminoacyl-tRNAs
and DNA-directed RNA polymerase activity (see Additional
data files 1 (Figures S6 and S12) and 2 (Table S6)). At the
level of cellular components, GO studies indicated that the
most representative upregulated processes occur in a variety
of subcellular compartments (cytosol, exosome, and nucleus)
and complexes (for example, eukaryotic translation initiation
complexes, nucleolus, ribosome subunits, and the proteasome core complex; see Additional data files 1 (Figures S7
and S13) and 2 (Table S7)). For a comprehensive analysis of
processes upregulated with increasing growth rate, see Additional data file 5.
GO analysis of the set of 258 genes of known function
whose transcription was significantly downregulated with
increasing growth rate (see Figure 2a and Additional data
files 1 (Figure S3) and 2 (Table S4)) shows that a high
proportion of these genes correspond to the following biological processes: response to external stimulus, cell communication and signal transduction, autophagy, homeostasis,
response to stress, vesicle recycling within Golgi (see Additional data files 1 (Figures S8 and S14) and 2 (Table S9)).
The most overrepresented GO molecular function categories
for this gene set correspond to a variety of catalytic, signal
transduction, transcription regulator, and transport activities. These include receptor signaling protein activity,
protein kinases, phosphotransferase, oxidoreductase and
ATPase activity coupled to transmembrane movement of
ions, and phosphorylation mechanisms (see Additional
data files 1 (Figures S9 and S15) and 2 (Table S10)). At the
level of cellular component, downregulated processes occur
Journal of Biology 2007, 6:4
4.6 Journal of Biology 2007,
Volume 6, Article 4
Castrillo et al.
/>
(a)
(b)
Genes upregulated with increasing growth rates (493 total)
75%
435
64.1%
2284 ORFs
493 ORFs
397
Non-annotated
ORFs
Upregulated
with growth rate
58
258
51.5%
39%
Non-annotated
ORFs
140
% of yeast proteins
conserved in Homo sapiens
% of yeast proteins
conserved in 5 eukaryotic 398 ORFs
model organisms:
Downregulated
- Arabidopsis thaliana
with growth rate
- Ashbya gossypii
- Caenorhabditis elegans
- Drosophila melanogaster
- Homo sapiens
249
Downregulated
by rapamycin
treatment
1848 ORFs
Upregulated by
rapamycin
treatment
Genes downregulated with increasing growth rates (398 total)
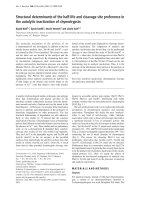
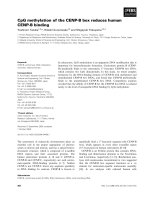
Figure 2
Cell-growth regulation of gene expression at the transcriptional level. (a) Groups of genes significantly upregulated (main red block) and
downregulated (main green block) with growth rate irrespective of the nutrient-limiting condition, and their conservation in eukaryotes. The smaller
blocks to the right represent the percentages of conserved orthologous proteins in Homo sapiens alone and in five model eukaryotic organisms [52].
The number of non-annotated open reading frames (ORFs) in up- and downregulated lists (that is, ORFs/genes of unknown function Affymetrix
annotation 12 July 2006) is included. (b) Target-of-rapamycin (TOR) regulation at the transcriptional level. Genes upregulated and downregulated
with growth rate are indicated by red and green circles, respectively. Groups of genes whose transcription is significantly downregulated by
rapamycin treatment are indicated by the blue circle; those upregulated by the purple circle. Overlapping areas indicate groups of specific growthrelated genes whose expression is significantly affected by rapamycin at the transcriptional level.
at the level of the plasma membrane, the vacuole, and the
repairosome (see Additional data files 1 (Figures S10 and S16)
and 2 (Table S11)). Although essential genes are underrepresented in this list (22 out of 398; see Additional data
file 2 (Table S4) and the Saccharomyces Genome Database
[42]), the fact that 64.6% of the downregulated genes have
been reported to result in growth defects or inviability in
gene deletion studies (see Additional data file 2 (Table S4)
and [42]) points to a crucial role of these genes in growthrelated processes that has yet to be elucidated. All of the 22
essential genes in this set are of known function, but only
11 of them have been reported previously as being directly
related to cell growth and maintenance. For a comprehensive analysis of the role of most relevant downregulated
processes regulating cell growth at the transcriptional level,
see Additional data file 5.
Genes that are downregulated with increasing growth rate
are probably involved in maximizing the efficient utilization of cellular resources at each different growth rate and
culture condition, particularly when nutrients are scarce.
Our data indicate that this is a poorly understood aspect of
the cell’s economy since a significant number of these genes
(140/398; 35.2%) are of as-yet-undetermined function. This
is despite the fact that nutrient scarcity is likely to be a
common circumstance in the organism’s natural environment [46]. Among the genes of known function that are
upregulated at low growth rates are those involved in mobilization and storage of available resources at the level of the
vacuole (see Additional data file 1 (Figure S20)). Another
interesting example of genes that are upregulated at low
growth rates are those involved in autophagy (see Additional data file 1 (Figure S21)). Autophagy is a major system
Journal of Biology 2007, 6:4
/>
Journal of Biology 2007,
of bulk degradation of cellular components. It participates
in the coordinate degradation of cytoplasmic components,
including proteins, large complexes and organelles whose
turnover is important in the control of cell growth.
Autophagy mediates the shrinkage of the ribosome pool,
thus slowing cell growth when nutrients are limiting [47].
Autophagy in yeast has been reported to be a TOR-mediated
response to nutrient starvation [48], and we have demonstrated previously the induction of autophagy genes in stationary phase [19]. Autophagy genes are well conserved
from yeast to mammals, suggesting that it is a fundamental
activity of eukaryotic cells, being implicated in processes
such as homeostasis, development and differentiation [47].
Other genes that are upregulated at low growth rates are
those encoding specific transcriptional repressors whose
action results in the activation of alternative routes for the
assimilation of substrates and/or as an adaptation to the
environment.
In all, the data on the downregulated genes present a picture
of the yeast cell at low growth rates activating pathways
involved in the response to external stimuli, maintenance of
homeostasis, vacuolar transport and storage, and autophagy;
the whole being directed towards a more efficient use of
scarce resources. Finally, we have found that genes that were
annotated previously as being involved in ‘response to stress’
[42,49,50] are upregulated at low growth rates. Moreover, we
have confirmed these findings at the proteome level (see proteomic studies (Table 1)). This demonstrates that a large part
of what others have termed the ‘generalized stress response’
may more properly be viewed as a slow-growth response.
Cell-growth-related genes subjected to
transcriptional control encode a core protein
machinery conserved among all eukaryotes
A high percentage of the proteins encoded by the up- and
downregulated genes are highly conserved in a variety of
‘model’ eukaryotes (Ashbya gossypii, Caenorhabditis elegans,
Arabidopsis thaliana, Drosophila melanogaster and Homo
sapiens) [51,52], which points to the existence of an essentially conserved ‘core’ protein machinery governing cell
growth in the Eukarya. Thus, 75% of the protein products of
yeast genes upregulated with growth rate have orthologs in
humans, whereas 52% of the downregulated set have human
orthologs (which is not significantly different to the figure
of 48% for all S. cerevisiae proteins [51]; see Figure 2a and
Additional data file 2 (Tables S3 and S4)). Many of these
proteins are built into complex machines [53]. Proteins
encoded by the upregulated genes participate in a large
number of interactions with each other (876 interactions as
compared with 287 expected by chance), whereas those
encoded by the downregulated genes rarely interact with
Volume 6, Article 4
Castrillo et al. 4.7
one another (89 compared with the 193 expected by chance;
see Additional data files 2 (Tables S12 and S13) and 4).
TOR control of cell growth at the transcriptional level
The TOR signal transduction pathway is a central controller
of the eukaryotic cell, sensing cellular environment and
linking nutrient assimilation with translation initiation and
ribosomal protein synthesis to control cell growth
[3,4,33,54-56]. Many genes responsible for central growth
processes (for example, translation initiation, ribosome biogenesis, autophagy, stability of biosynthetic components)
are regulated at the transcriptional level (see Additional data
file 2 (Tables S3 and S4)) and are under the direct or indirect
control of TOR [32,33] (see Additional data file 1 (Figure
S22)). The exact mechanisms by which the TOR pathway
controls these processes are not known, but appear to be
mediated (at least, in part) by GATA-type, zinc-finger and
forkhead transcription factors [32,33,57-60]. We decided to
test the generality of the hypothesis that TOR, more specifically the TOR signaling branch that mediates temporal
control of cell growth (TORC1) complex [32], is the major
regulator of yeast gene expression in response to nutrient
availability, and hence of growth rate [3,31-33]. To do this,
we examined the impact of rapamycin, a specific inhibitor of
the TORC1 complex [32], and widely used to elicit the TOR
control response [32,61], on the yeast transcriptome [14].
The results of this examination should be approached with
caution for two reasons. First, few inhibitors are completely
specific in their action and thus our analysis is likely to be
complicated by side-effects of rapamycin on processes other
than TOR action. Second, as the addition of the inhibitor
would necessarily disturb the steady state of a chemostat
culture, we performed this experiment in batch. We have
shown previously that the use of batch culture introduces a
number of confounding variables to transcriptome analyses
that are avoided by the use of chemostats [14,19]. Thus, it
may be predicted that the rapamycin-inhibition experiment
would show more genes affected than were found to be
subject to growth-rate control in our chemostat studies.
This, indeed, proved to be the case (Figure 2b). Remarkably,
the rapamycin and growth-rate data showed more than
70% of growth-rate-regulated genes to be members of the
TOR-responsive sets. We found 397 growth-rate upregulated
genes to be downregulated by rapamycin, and 249 genes
downregulated by growth rate were upregulated in response
to the drug. Thus, 646 growth-rate-regulated genes (72.5%)
appear to be specifically controlled by TOR (Figure 2b; see
also Additional data files 1 (Figure S23) and 2 (Tables S15
and S16)). Our studies are also in good agreement with previous transcriptional studies on the effect of rapamycin on
yeast cultures, showing a characteristic global response, with
translational initiation, aminoacyl-tRNA synthetases, RNA
Journal of Biology 2007, 6:4
4.8 Journal of Biology 2007,
Volume 6, Article 4
Castrillo et al.
polymerases, ribosome biogenesis and proteasome subunits
among the most significantly affected biological processes
(see Figure 2b and Additional data file 2 (Tables S15-S17)
and [61,62]). These are key processes in which our sets of
growth-rate-regulated genes are involved
In our results, none of the genes specifying the components
of the TORC1 complex [32,63] appears significantly regulated at the level of transcription (see Additional data file 1
(Figures S24 and S25)), in agreement with previously
reported studies (SGD; ORF expression connection studies
[42]). Evidence is accumulating that post-transcriptional
mechanisms play an important role in the global regulation
of cell growth [24,64,65] (see also the section on translational control, below). As an example, many genes reported
to be involved in control of cell size or coordination
between cell growth and division [9] do not appear regulated at the transcriptional level (see Additional data files 2
(Tables S3 and S4) and 5), showing that it is important to
extend these studies to the proteomic level.
Proteomic signatures of growth-rate change
Most global gene-expression studies have been entirely at
the transcriptome level and often assume that changes in
transcript levels should correlate with changes at the protein
level. However, there is ample evidence that this is a dangerous assumption [21-24,65-69]. We extended our study to
the proteome level using iTRAQ [34,35], covering a significant proportion of the yeast proteome (around 700 proteins
per nutrient-limiting condition; 1,358 in total; see Materials
and methods). For example, we examined the differences in
protein levels (proteomic signatures) between cells growing
at µ = 0.1/hour and those growing at 0.2/hour under carbon
limitation (Figure 3 and Additional data file 2 (Table S18)),
and found a number of proteins and biological processes to
be significantly up- and downregulated under these conditions (Table 1 and Additional data file 2 (Tables S19 and
S20)). Remarkably, as with the transcriptome profiles, these
proteomic signatures appear to be characteristic for each
nutrient-limiting condition, but there is also a common
pattern that represents the proteomic response to a growthrate shift from µ = 0.1 to 0.2/hour (see Figure 3a and Additional data files 1 (Figure S26) and 2 (Tables S18 and S21)).
Relative changes in proteome levels of proteins participating
in relevant biological processes are shown in Figure 3b.
Again, in common with the transcriptome data, most of the
changes in protein levels lie in a range between a less than
twofold decrease and a less than twofold increase (Figure 3a
and Additional data file 1 (Figure S26)). Similar analyses
(that is, ANOVA) to those performed on the transcriptome
data can be applied to identify groups of proteins that are
consistently and significantly up- or downregulated with
growth rate (see Additional data file 4).
/>
Among the groups of proteins whose levels appear consistently up- or downregulated with growth irrespective of the
specific nutrient limitation (see Figure 3 and Additional
data files 1 (Figure S26) and 2 (Tables S22 and S23)) are
proteins of the translational machinery (for example, translation initiation and elongation factors, ribosomal proteins,
aminoacyl-tRNA synthetases), enzymes involved in methionine and methyl cycle metabolism, and regulatory enzymes
of amino-acid and other relevant biosynthetic pathways.
Selected groups of proteins are marked in color in Figure 3a.
As a relevant example, proteomic studies reveal different
responses in the levels of the two S-adenosylmethionine
synthetases, Sam1p and Sam2p (see Figure 3a and Additional data file 1 (Figure S26)). This, and the fact that the
SAM2 gene was significantly upregulated at the transcriptional level (Additional data file 2 (Table S3)), are in accordance with previous reports [70].
Finally, nutrient-independent changes in levels of metabolic
enzymes (see Figure 3a; the most relevant are included in
Additional data file 2 (Table S24)) with growth rate will be
of particular importance for the elucidation of the yeast
cell’s strategies for the control of central metabolic fluxes
during cell growth, and for the identification of groups of
metabolic enzymes consistently up- and downregulated at
the protein level (for example, amino-acid biosynthetic
enzymes; Table 2). These studies have direct implications
for the design of new comprehensive metabolic engineering
strategies, and will be discussed in the section below on
metabolic control, where (for example) the role of the
Sam1p and Sam2p isoenzymes is considered.
Proteome-transcriptome correlations
Because our transcriptome and proteome data had been
obtained from the same samples of cells from chemostat
cultures in steady state at growth rates of both 0.1 and
0.2/hour, and as these data had been normalized and statistically analyzed in the same way, we were able to make a
realistic determination of the congruence between the level
of any gene transcript and its cognate protein product(s).
Example results are presented in Figure 4 for the glucoselimited steady states. Overall, the correlation coefficients (r)
for each nutrient-limiting condition (C, N, P and S limitation) lie between 0.4 and 0.7, indicating only a moderate
global congruence between transcript and protein levels
(see Additional data file 6), in agreement with some previous studies [65-69,71]. The fact that mRNA changes do not
generally correlate with protein changes suggests a widespread role for post-transcriptional mechanisms in the
control of yeast’s growth rate (see below). Most transcripts
show a relative change in their level, between both growth
rates of 0.1/hour and 0.2/hour, that is within a twofold
range up and down, and the same is true for their cognate
Journal of Biology 2007, 6:4
/>
(a)
Journal of Biology 2007,
Castrillo et al. 4.9
6
5.5
a
i
5
Upregulation
Volume 6, Article 4
iii
c
b
ii
4.5
4
3.5
3
Cp a1 p
2.5
A l d6 p
Gap1p
Cpa2p
2
1.5
A co 2 p
L eu1 p G l n1 p
Il v 3 p
M dh 2 p L ys4 p
E cm 1 7 p
Mes1p
Ser3 p
Sdh2p
Sdh1p
Sui 3p
Eno2p Sam2p
Sl a2p
1
U ra1 p
Rp l 6 ap A do 1 p
R pl 33 ap
1
1.5
Downregulation
2
2.5
3
Erg1p
Ydl124wp
Eno1p
Gsc2p
3.5
4
Sam1p
Ypr127wp
Ymr090wp
A rg8p
Zps1p
Rpn3p
Zrt3p
Idh1p
Fmo1p
Ero1p
Adh4p
Erg27p
Tdh1p
Gre2p
4.5
5
Hxt3p
5.5
6
ORFs sorted by biological process
(b)
Relative change
in protein expression
([protein]0.2/ [[protein]0.1)
2.0
1.5
1.0
0.5
1
2
3
4
5
6
7
Biological processes
8
9
10
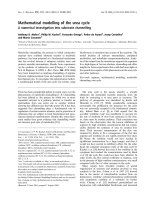
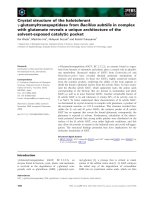
Figure 3
Gene-expression signatures at the protein level. (a) The graph shows the pattern of relative changes (fold change) in protein levels with a shift in
growth rate (µ) from 0.1 to 0.2/h (doubling time, Td = 6.9 to 3.5 h) under conditions of carbon limitation (663 proteins in total). ORFs were sorted
by biological process [42]. i, Methionine biosynthesis; ii, protein biosynthesis; iii, ubiquitin-dependent protein catabolism. Red, upregulated protein
expression; green, downregulated. Selected groups of proteins whose levels are consistently upregulated or downregulated with growth
independently of culture condition are labeled in the appropriate color. (b) Box-plot of relative changes in protein expression from growth rate 0.1
to 0.2/h of proteins of representative biological processes (>10 proteins identified per process). 1, Cell wall organization and biogenesis; 2, endoplasmic reticulum (ER) to Golgi transport; 3, ergosterol biosynthesis; 4, glycolysis; 5, methionine biosynthesis and methionine metabolism; 6, protein
biosynthesis; 7, protein folding; 8, purine nucleotide, purine base and pyrimidine base biosynthesis; 9, regulation of transcription; 10, ubiquitindependent protein catabolism. Open and solid dots indicate presence of outliers that lie more than 3 or 1.5 times the interquartile range, respectively.
Journal of Biology 2007, 6:4
4.10 Journal of Biology 2007,
Volume 6, Article 4
Castrillo et al.
/>
Table 1
Groups of relevant biological processes regulated at the protein-expression level
Biological process
Upregulated
Cellular biosynthesis (81)
Amino-acid and derivative metabolism (33)
Translation (42)
Macromolecule biosynthesis (48)
tRNA aminoacylation (9)
Ribosome biogenesis and assembly (22)
Purine nucleotide metabolism (8)
Sulfur metabolism (8)
Organic-acid biosynthesis (4)
Regulation of protein metabolism (6)
rRNA processing (8)
Downregulated
Cellular carbohydrate metabolism (19)
Coenzyme metabolism (14)
Response to stress (27)
Response to stimulus (31)
Cellular macromolecule catabolism (17)
Vacuole organization and biogenesis (6)
Transport (35)
Cellular lipid metabolism (11)
Homeostasis (7)
Proteins (examples)
p-value (GO studies)
Ser3p, Cpa1p, Lia1p Rpl10p
Gln1p, Leu1p, Lys4p
Rpl6ap, Mes1p, Sui3p, Fun12p
Mdh2p, Rpl3p, Mes1p, Ths1p
Mes1p, Cdc60p, Ded81p
Nug1p, Rpl30p, Nop58p, Yf3p
Ade17p, Ade1p, Hpt1p
Ecm17p, Met10p, Trx2p, Sam2p
Ald6p,Fas1p, Fas2p
Asc1p, Cap2p, Rpl30p
Nug1p, Has1p, Utp10p
1.1E-29
2.6E-21
4.8E-13
5.7E-12
9.7E-9
3.2E-7
3.8E-6
2.2E-5
3.6E-4
1.2E-3
1.8E-2
Gre2p, Tsl1p, Tps1p, Eno1p
Pan5p, Mdh3p, Npt1p
Pol30p, Hsp104p, Rvs161p
Lap3p, Akr1p, Ycf1p, Fet3p
Skp1p, Pre3p, Rpn3p, Kar2p
Sec17p, Tpm1p, Vtc2p, Vtc3p
Pet9p, Sar1p, Fet3p, Hxt3p
Ncp1p, Erg1p, Erg27p. Lem3p
Skp1p, Ahp1p, Vma5p, Zrt3p
2E-7
5.8E-7
9.8E-7
1.1E-5
2.3E-4
3.6E-4
1.1E-3
7.7E-3
2E-2
Groups of relevant biological processes regulated at the protein expression level from growth rates 0.1 to 0.2/h under carbon limitation are shown
here. Proteins significantly upregulated or downregulated with increasing growth rate (relative fold-changes greater than 20%, 141 proteins) from
iTRAQ studies were analyzed by GO studies (GO tool, SGD Term Finder [42]). Numbers of proteins obtained per biological process are included in
brackets. Full lists of results, including genes significantly regulated at the protein expression level, for each biological process are provided in
Additional data file 2 (Tables S19 and S20).
Table 2
Amino-acid biosynthetic enzymes with protein levels consistently up- and downregulated with growth rate under all nutrientlimiting conditions
Enzymes
Amino-acid biosynthetic pathway
Arginine
Homocysteine, cysteine, methionine, and sulfur compounds
Upregulated
Downregulated
Aco1p, Aco2p,Cpa1p, Cpa2p
Arg1p, Arg8p
Ecm17p, Met10p, Met13p,Sam2p, Met6p, Ado1p
Sam1p
Glutamine
Gln1p
Leucine, isoleucine, valine
Lysine
Ilv3p, Leu1p
Aco1p, Aco2p, Lys2p, Lys4p
Aco1p, aconitase; Aco2p, putative aconitase isozyme; Ado1p; adenosine kinase; Arg1p, arginosuccinate synthetase; Arg8p, acetylornithine
aminotransferase; Cpa1p, small subunit of carbamoyl phosphate synthetase; Cpa2p, large subunit of carbamoyl phosphate synthetase; Ecm17p, sulfite
reductase beta subunit; Gln1p, glutamine synthetase; Ilv3p, dihydroxyacid dehydratase; Leu1p, isopropylmalate isomerase; Lys2p, alpha aminoadipate
reductase; Lys4p, homoaconitase; Met6p, methionine synthase; Met10p, sulfite reductase alpha subunit; Met13p, methylenetetrahydrofolate
reductase isozyme; Sam1p, S-adenosylmethionine synthetase isozyme; Sam2p, S-adenosylmethionine synthetase isozyme.
Journal of Biology 2007, 6:4
/>
Journal of Biology 2007,
(a)
Volume 6, Article 4
Castrillo et al. 4.11
(b)
4
6
3
1
0
−4
−3
−2
−1
−1
0
1
2
3
4
ADH4 , ARG8, DPR1,
ENO1, ERG1, ERG27,
ERO1, FET3, FET5,
−2
FMO1, GRE2, HXT 3,
IDH1, MCD4, PRB1, TDH1,
YMR09 0W, YPR127W, −3
ZPS1, ZRT1, ZTR3
(C0.2/C0.1)p
Log2 (C0.2/C0.1)p
5
ACO2, ADO1, CPA1,
GLN1, LEU1, SDH2,
SER3, URA 1
2
4
3
2
1
0
0
−4
Log2 (C0.2/C0.1)t
1
2
3
4
(C0.2/C0.1)t
5
6
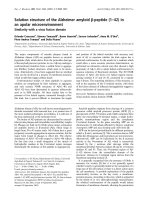
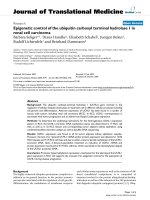
Figure 4
Integration of proteome and transcriptome studies. Proteome-transcriptome correlations are determined by the relative changes in protein levels
versus relative changes in transcriptional levels from µ = 0.1 to 0.2/h under conditions of carbon limitation. (a) Log2 correlations with the most
relevant outliers (cases in which changes in transcript levels do not result in comparable changes at the protein level) named. (b) Correlations
between relative changes in natural values. The lines with y/x slope 0.5, 1 and 2 respectively allow to delimit groups of protein/transcript pairs that
are correlated (y/x ratio >1) and anti-correlated (y/x ratio <1), and their limits (majority of them with y/x ratios within 0.5 and 2; [0.5 < y/x ratio < 2]).
proteins. However, there are a number of transcript-protein
pairs that are significant outliers, cases in which changes in
transcript levels do not result in comparable changes at the
protein level (for example, ADH4/Adh4p and ADO1/Ado1p
in Figure 4); examples of these outliers are shown more
clearly in Figure 5, and are discussed in the following section.
Growth-rate-associated changes in translational
control efficiencies
A number of post-transcriptional mechanisms might be
involved in modulating the cellular concentration of a given
protein relative to that of the mRNA species that encodes it.
These include mRNA recruitment from the nucleus and pbodies, polyadenylation states, level of polysomal occupancy per transcript, and rates of protein degradation
[21-24,72-74]. To encompass all of these mechanisms of
translational control and quantify their overall effect, we
define the effective ‘translational control efficiency’
(Trlc Effi) of a given messenger RNA in terms of its P/R ratio
[proteini]/[mRNAi] (see Materials and methods and Additional data file 7), and show that the ratio of relative change
in the level of a protein to the relative change in its cognate
mRNA (obtainable from proteome-transcriptome studies;
see above) is equal numerically to the ratio of relative
changes in translational control efficiencies between the two
conditions studied (see Materials and methods and Additional data file 7).
By this means, and on a genome-wide scale, we can quantify the relative changes in the overall translational control
efficiencies of mRNA molecules corresponding to a shift
from µ = 0.1 to 0.2/hour (that is, a doubling in specific
growth rate). The results are presented in Figure 5 (for just
the carbon-limited steady state) and in Additional data
file 8. The pattern of changes suggests that the translational
control efficiencies of particular mRNAs are modulated
selectively in order to fine-tune protein activities and metabolic fluxes of relevant biological processes during cell
growth (Figure 5a,b). The pattern of changes in translational
control efficiencies is dependent on the specific nutrientlimiting condition, with most transcripts showing a less
than twofold change (up or down) in their translational
efficiencies, but a few undergo much larger relative changes
(Figure 5a, see also Additional data files 1 (Figure S27) and 8).
This metric of the relative change in translational control
efficiency allowed us to make a quantitative estimate of the
relative contribution of post-transcriptional control mechanisms to a change in growth rate. For each nutrient-limiting
condition, more than 35% of all transcripts were found to
Journal of Biology 2007, 6:4
4.12 Journal of Biology 2007,
(a)
Volume 6, Article 4
Castrillo et al.
/>
5
4.5
i
ii
iii
Upregulation
4
HSP26
3.5
3
2.5
2
CPA1
MDH2
ACO2
CPA2
OM45 ECM17ALD5
GLN1
LPD1
LEU1 HOM3
1.5
SER3
RHR2
SDH1
ADO1 URA1 NUG1 SDH2
RPL6A
SMC3
1
1
Downregulation
1.5
2
2.5
ISW1
YLR
179C
MLC1
TWF1
YHI9
ERG1
ARG8
SAM1
CKI1
ZRT1 TUB1
ENO1
ADH4
MNP1
PRE8
PRE5
CDC33
YCF1
SSA2
DPP1 TEF DDI1
4
FMO1 FUR1
RPN3
ERO1
VTC3
3
GRE2
3.5
4
TDH1
ERG27
ZPS1
4.5
HXT3
5
ORFs sorted by biological process
Relative change in translational
control efficiency from (µ) 0.1 to 0.2 h−1
(b)
1.6
1.4
1.2
1.0
0.8
0.6
0.4
1
2
3
4
5
6
7
Biological processes
8
9
10
Figure 5
Cell-growth regulation of gene expression at the translational level. Translational control. (a) Patterns of relative changes in translational control
efficiencies from growth rate (µ) 0.1 to 0.2/h, under conditions of carbon-limitation. ORFs sorted by biological process [42]. i, Methionine
biosynthesis; ii, protein biosynthesis; iii, ubiquitin-dependent protein catabolism. Selected groups of transcripts whose translational control efficiency
is consistently up- or downregulated with growth independently of culture condition are marked in bold. Red, upregulation; green, downregulation.
(b) Box-plot of relative changes in translational control efficiencies from growth rate (µ) 0.1 to 0.2/h of transcripts in representative biological
processes (>10 proteins identified per process). 1, Cell wall organization and biogenesis; 2, ER to Golgi transport; 3, ergosterol biosynthesis;
4, glycolysis; 5, methionine biosynthesis and methionine metabolism; 6, protein biosynthesis; 7, protein folding; 8, purine nucleotide, purine base and
pyrimidine base biosynthesis; 9, regulation of transcription; 10, ubiquitin-dependent protein catabolism. Open and solid dots indicate presence of
outliers that lie more than 3 or 1.5 times the interquartile (IQR) range, respectively.
Journal of Biology 2007, 6:4
/>
Journal of Biology 2007,
change their translational efficiency to a significant (greater
than 20%) extent. Further studies, including analysis of
post-translational modifications across the proteome (for
example, phosphorylation and glycosylation), will provide
a more complete picture of the role of post-transcriptional
control during cell growth.
From all these data, we were able to extract groups of transcripts whose translational control efficiencies are consistently up- or downregulated with growth rate, irrespective of
the limiting nutrient. Transcripts in this category include
those encoding components of the translational machinery,
enzymes subject to covalent or allosteric regulation that are
involved in amino acid and other biosynthetic pathways,
and regulatory proteasome subunits. Selected cases are
marked in bold in Figure 5a and summarized in Additional
data file 2 (Table S25). As an interesting example, the relative
level of the transcript of CPA1 (encoding the small subunit
of the multimeric enzyme carbamoyl phosphate synthetase
(CPSase) in the arginine biosynthetic pathway) does not
change with growth rate (see Additional data file 2 (Table
S3)), but the overall efficiency with which this mRNA is
translated goes up significantly with growth rate (see Figure
5a, and Additional data file 8). Although CPSase activity has
been found to be subject to regulation at the transcriptional,
translational and metabolic levels [75-78], under the specific
conditions tested (synthetic medium under nutrient-limited
conditions, with ammonium as sole nitrogen source), it
appears to be regulated mainly at the translational level.
Growth-rate control at the level of the metabolome
How are the metabolic fluxes characteristic of an increase
in the rate of biomass accumulation actually controlled?
To what extent are these fluxes regulated by gene expression (enzyme expression levels) or by metabolic regulation? To answer these questions, the quantitative
proteomic data must be integrated with those on the
metabolome. This is, without doubt, the most difficult
challenge in data integration that exists in functional
genomics or systems biology. To a large extent, it is
because the metabolome, in contrast to the transcriptome
and the proteome, has no simple, direct connection to the
genome [79]. We have recently developed statistical
approaches with which to integrate transcriptome data
with those for a small number of key metabolites (for
example, glucose, ethanol, CO2) [80], but we have yet to
extend this to the entire metabolome. This is a field in
which many different strategies are likely to be required
and, indeed, are starting to be developed - for instance,
metabolic network topology [81].
In the current study, we used the ANOVA analysis applied to
the iTRAQ proteomic data to identify proteins whose levels
Volume 6, Article 4
Castrillo et al. 4.13
were consistently up- or down- regulated with growth rate
(see Figure 3 and Additional data file 2 (Tables S22-S24)).
This analysis highlighted two growth-related metabolic
processes: the coupling of carbon and nitrogen fluxes
towards the synthesis of amino acids, for example, glutamine and arginine (Figure 6); and the flux of methionine
and S-adenosylmethionine (SAM through the methyl cycle
[82,83] (Figure 7).
Coupling of carbon and nitrogen fluxes towards amino-acid
biosynthesis
In a synthetic medium with ammonium as sole nitrogen
source, the cell must synthesize all its amino acids de novo.
This implies an efficient coupling of carbon and nitrogen
fluxes from 2-oxoglutarate, increasing metabolic fluxes
through glutamate dehydrogenase and glutamine synthetase towards the synthesis of all necessary amino acids
(Figure 6) [84]. 2-Oxoglutarate, considered to be one of the
12 basic precursor metabolites [85], is primarily synthesized
in the mitochondrion through the tricarboxylic acid cycle
(TCA). In our studies, we found Aco1p (aconitase) and
Aco2p (a putative aconitase isoenzyme with 55% aminoacid sequence identity to Aco1p [86]) to be the TCA cycle
enzymes that were most significantly upregulated at the
level of protein expression (see Figure 6 and Additional data
file 2 (Table S22)). This points to an increase in flux
towards cis-aconitate and isocitrate (note that Aco1p participates in two consecutive steps in the TCA cycle). At the same
time, our endometabolome studies showed that the steadystate levels of citrate, the initial substrate for aconitase, fell
with increasing growth rate (see Additional data file 2
(Table S26)).
Significant upregulation at the level of protein expression
towards increasing TCA fluxes was also found at the level of
succinate dehydrogenase, the enzyme complex coupling
oxidation of succinate to the transfer of electrons to
ubiquinone. Both Sdh1p and Sdh2p (the flavoprotein and
iron-sulfur subunits of the succinate dehydrogenase
complex) were significantly upregulated with growth rate
(q = 0.051 and 0.046, respectively). Once again, metabolome studies showed a decrease in the in vivo steady-state
levels of the corresponding substrate, succinate, at higher
growth rates (see Additional data file 2 (Table S26)).
Among the enzymes responsible for the supply of 2-oxoglutarate in the cytosol, Idp2p (NADP-isocitrate dehydrogenase) and Odc1p (one of two isoforms of the mitochondrial
2-oxoglutarate transporter [87]) were not detected in our
proteomic analyses and the transcriptional patterns of their
cognate genes were not in the growth-rate-regulated set
(q for IDP2 = 0.13; q for ODC1 = 0.32; no clear trends with
growth rate). However, ODC2, which encodes the other
Journal of Biology 2007, 6:4
4.14 Journal of Biology 2007,
Volume 6, Article 4
Castrillo et al.
/>
Glucose
NH4+
Glucose
transporter
NH4+ transporter
NH4+
Aco2p
Aco1p
Cpa1p
Gln1p
Gdh1p
Cpa2p
Sdh1p
Odc1p
TCA cycle
2-oxoglutarate
Glutamate
2-oxoglutarate
Glutamine
Arginine
Odc2p
Sdh2p
Gdh2p
Idp2p
Glt1p
Purines
Isocitrate
Pyrimidines
Mitochondria
Amino acids
TOR
Amino acids
Gat1p
Gln3p
Rtg3p
Rtg1p
Figure 6
Integration of proteome and metabolic control to show regulation of carbon and nitrogen metabolic fluxes at the protein (enzyme) level. Shown
here are the coupling of carbon and nitrogen fluxes at the level of glutamate dehydrogenase (Gdh1p, Gdh2p) and glutamine synthetase (Gln1p), the
regulation of arginine biosynthesis at the carbamoyl phosphate synthetase (Cpa1p, Cpa2p) level and amino-acid biosynthesis, and amino-acid sensing
by TOR. Selected proteins with levels consistently upregulated (red) with growth independently of culture conditions are shown. Enzymes
responsible for the cytosolic 2-oxoglutarate pool: Aco1p and Aco2p, aconitase and putative aconitase isoenzyme; Odc1p and Odc2p, mitochondrial
2-oxoglutarate transporters; Idp2p, NADP-specific isocitrate dehydrogenase. Enzyme subunits coupling the oxidation of succinate to the transfer of
electrons to ubiquinone: Sdh1p and Sdh2p, succinate dehydrogenase, flavoprotein, and iron-sulfur protein subunits, respectively. Metabolic diagram
from [42, 91, 92] and drawn using Cell Designer [136] and Adobe Illustrator [137].
isoform of the mitochondrial transporter, Odc2p, is consistently and significantly upregulated with growth rate at both
the mRNA (q = 0.05) and protein (q = 0.12) levels. This
demonstrates the importance of mitochondrial transport in
the regulation of amino acid biosynthesis and represents a
first example of the differential regulation of two enzyme
isoforms (with 61% amino-acid sequence identity) with
growth rate (see below).
In addition to increased levels of Odc2p, our proteomic
data also demonstrate that the levels of glutamine synthetase (Gln1p) as well as the small and large carbamoylphosphate synthase subunits (Cpa1p and Cpa2p) are
upregulated with growth rate (see Figure 3a and Additional
data files 1 (Figure S26) and 2 (Table S27)). These are
important regulatory enzymes whose expression and activity have been reported to be tightly regulated at the transcriptional, translational, post-translational and metabolic
levels [75-78,84,88-90]. The endometabolome data showed
no significant growth-rate-associated change in the steadystate 2-oxoglutarate and glutamine levels, with only glutamate exhibiting a decrease in its intracellular level (see
Additional data file 2 (Table S26)). Glutamate is one of
several metabolites sensed by TOR, which regulates the
activity and localization of the Gat1p (Nil1p) transcription
factor, which (in turn) mediates nitrogen catabolite repression in response to intracellular glutamate (see Figure 6)
[91,92].
Journal of Biology 2007, 6:4
/>
Journal of Biology 2007,
Volume 6, Article 4
Sulfur uptake
Redox metabolism
C1 metabolism
SO42-
GT
Castrillo et al. 4.15
THF
Polyglutamylation
Met10p
CYS
MET7
METTHF
Ecm17p
Met13p
S2−
Glutamate
CT
MTHPTGLUT
OAHS
ATP
HCYS
Adenosine
Met6p
AMP
Sah1p
Ado1p
Mes1p
SAH
ADP
Methyl
cycle
MET
Met-tRNA
Translation
Protein biosynthesis
Sam2p
Sam1p
MTA
cycle
SAM
Methyltransferases
MTA
Methylations
Biotin
D-SAM
Polyamines
Figure 7
Integration of proteome and metabolic control to show regulation of sulfur and C1 (folate) metabolic fluxes at the protein (enzyme) level. Selected
proteins with levels consistently upregulated (red) or downregulated (green) with growth independently of culture conditions are shown. Sulfur, C1
metabolism, methyl cycle, methionine and S-adenosylmethionine (SAM) fluxes towards methylation of proteins, rRNAs and tRNAs, and protein
biosynthesis are shown here. Metabolic pathways and enzymes are from [42,82,103-105] and the diagram is drawn with Cell Designer [136] and
Adobe Illustrator [137]. Reverse methionine biosynthetic pathways [83] have been omitted for clarity. Metabolite abbreviations: THF,
tetrahydrofolate; METTHF, 5,10-methylenetetrahydrofolate; MTHPTGLUT, 5-methyltetrahydropteroyltriglutamate (donor of the terminal methyl
group in methionine biosynthesis); GT, glutathione; CYS, cysteine; CT, cystathionine; OAHS, O-acetylhomoserine; HCYS, homocysteine; MET,
methionine; SAM, S-adenosylmethionine; SAH, S-adenosylhomocysteine; D-SAM, decarboxylated S-adenosylmethionine; MTA, methylthioadenosine.
Metabolic steps (genes/enzymes): Met10p, sulfite reductase alpha subunit; Ecm17p, sulfite reductase beta subunit; MET7, folylpolyglutamate
synthetase (Met7p not detected; the relevance of polyglutamylation in the C1 metabolism branch was demonstrated at the transcriptional level (see
text)); Met13p, methylenetetrahydrofolate reductase isozyme; Met6p, methionine synthase; Mes1p, methionyl-tRNA synthetase; Sam1p,
S-adenosylmethionine synthetase isozyme; Sam2p, S-adenosylmethionine synthetase isozyme. Sah1p, S-adenosyl-L-homocysteine hydrolase; Ado1p,
adenosine kinase.
Metabolic fluxes towards methionine and S-adenosylmethionine
S-adenosylmethionine (AdoMet or SAM), the methyl donor
for the majority of methyltransferase reactions [93,94] is
one of the most connected metabolites in the cell, after ATP.
It participates in a myriad of biochemical processes in different subcellular compartments (for example, cytosol,
Journal of Biology 2007, 6:4
4.16 Journal of Biology 2007,
Volume 6, Article 4
Castrillo et al.
nucleus, and mitochondria) [82,83,95]. How is the synthesis of this central metabolite regulated and its internal fluxes
appropriately distributed?
At the metabolic level, yeast cells have been reported to
contain at least two separate SAM pools, with different
turnover rates, a labile cytosolic pool and a more stable
organellar (mainly vacuolar) pool [96]. We detected SAM
(together with low levels of cystathionine, cysteine and glutathione - this last confirming negligible oxidative stress) in
our steady-state endometabolome samples (see Additional
data file 2 (Table S28)), but we cannot determine how it is
partitioned between the organellar and cytosolic compartments. Nonetheless, our results show that gross SAM levels
do change with growth rate in a manner that is specific for
each of the different nutrient limitations examined.
Saccharomyces cerevisiae contains two S-adenosylmethionine
synthetase genes, responsible for the synthesis of SAM from
methionine, SAM1 and SAM2. The protein products of these
two genes are 92% identical [70,82]. Sam1p is the most
abundant isoenzyme and is localized in the cytoplasm
[97,98]. It is a highly interconnected protein and interacts
with proteins involved in a number of central metabolic
processes (for example, multimeric enzymes in glycolysis/gluconeogenesis and amino acid biosynthetic pathways; Pfk1p,
Pfk2p, Gpm1p, His4p, Trp2p, Trp3p, and proteasome subunits; Rpn1p, Rpn2p), nuclear pore proteins (for example,
Kap95p, Kap104p, Kap123p, Crm1p, Mtr10p, Nup2p), mitochondrial proteins (for example, Mpm1p, Mis1p, Mdj1p),
vacuolar proteins and proteins involved in vacuolar protein
sorting (for example, Vps13p, Vps1p, Vth2p, Vma6p). These
interactions have been extracted from the BioGRID database
of curated interactions [99] and the paper by Gavin and
coworkers [100]. On the other hand, Sam2p has no clear subcellular localization [97,98] and is rarely associated with
other proteins [99,100]. No specific functions have so far
been assigned to these two isoenzymes in S. cerevisiae [82].
We find that SAM2 mRNA levels are significantly upregulated
with growth rate (see Additional data file 2 (Table S3)),
whereas the SAM1 transcript shows no significant upregulation with increasing growth rate, confirmed by quantitative
real-time PCR (QRT-PCR). More pertinently, our proteomic
studies under all four nutrient-limiting conditions show that
the increase in growth rate from µ = 0.1 to 0.2/hour entails an
increase in the levels of a number of enzymes (for example,
Ado1p, Met13p, Met6p, Sam2p) involved in methionine and
SAM biosynthesis, and these results have been confirmed by
two-dimensional difference gel electrophoresis [101,102]
(see Materials and methods). In contrast, the levels of Sam1p
actually fall with increasing growth rate (Figure 7, and Additional data files 1 (Figure S29) and 2 (Tables S23 and S25)).
/>
Increased fluxes through C1 (folate) metabolism towards
synthesis of 5-methyltetrahydropteroyltriglutamate, the donor
of the terminal methyl group in methionine synthesis
[42,103,104] were demonstrated by significant upregulation of MET7 (q for MET7 = 0.042), encoding folylpolyglutamate synthetase (FPGS), which is responsible for
polyglutamylation of folate coenzymes [103-105], and
upregulated levels of methylenetetrahydrofolate reductase,
Met13p (see Figure 7 and Additional data file 2 (Table S22)).
Here, it is noteworthy that S. cerevisiae cells possess only one
methionine synthetase, Met6p, which functions without
cobalamin as a cofactor [42,103,104]. These results show
the relevance of controlled fluxes of glutamate in methionine and SAM synthesis and point to the existence of close
interrelations between the carbon, nitrogen and sulfur
central metabolic pathways. The complete picture is one
where an increase in growth rate involves the mobilization
of C1 and sulfur metabolism towards increasing synthesis
of SAM and proteins (see Figure 7).
We analyzed the growth-rate response of transcripts encoding methyltransferases and found those responsible for the
methylation of rRNA (for example, NOP1, NOP2, SPB1 and
DIM1) and tRNA (for example, NCL1, TRM1, TRM3, TRM7,
TRM8) to be overrepresented in the group of genes whose
transcription is significantly upregulated with growth rate
(q < 0.09; from the ANCOVA analysis). Control of rRNA and
tRNA synthesis (including rRNA and tRNA methylation) is
closely tied to cell growth [106]. From reports in the literature, we have calculated that more than 2,000 methylation
events per second are required just for the de novo synthesis
of rRNA [107,108]. Thus, high growth rates will generate a
high demand for SAM simply to sustain the methylation of
rRNAs and tRNAs, let alone the requirements associated with
the methylation of the GpppN termini of capped mRNAs
[109]. Our data indicate that the increasing levels of Sam2p
are most likely to satisfy this demand at high growth rates,
thus associating Sam2p with the high-turnover pool of SAM.
In contrast, Sam1p may have the main responsibility for the
redistribution of SAM between the different subcellular
organelles. A definitive attribution of the division of responsibility for the production of this key metabolite between the
two isoenzymes must await more advanced studies involving
selective labeling and in vivo imaging.
The above examples show that integration of transcriptomic, proteomic, and metabolomic studies can provide
detailed information about cellular strategies to direct metabolic fluxes toward the supply of intermediates required to
sustain cell growth. However, a key question remains unanswered: how is the control of metabolic flux shared between
regulation at the level of gene expression (that is, enzyme
expression levels) and regulation at the level of metabolism
Journal of Biology 2007, 6:4
/>
Journal of Biology 2007,
C P
Carbon flux
Volume 6, Article 4
Castrillo et al. 4.17
C P
Bat2p
Leu2p
Leucine
2-oxoisocaproate
3-isopropylmalate
C P
Leu1p
Protein synthesis
Pyruvate
2-isopropylmalate
TOR
Leucine
2-oxoisocaproate
Bat1p
C P
Ilv2p
2
Pyruvate
C P
C P
C P
C P
Ilv3p
Ilv5p
2-acetolactate
2,3-dihydroxyisovalerate
Ilv6p
Leu4p
2-oxoisovalerate
2-isopropylmalate
Leu9p
Mitochondria
Figure 8
Multiple enzyme regulation in the metabolic control of the leucine biosynthetic pathway at the protein level. In vivo relative changes in enzyme levels
from µ = 0.1 to 0.2/h, under carbon- (C) and phosphate- (P) limiting conditions are indicated by the lengths of the gray and white bars next to each
enzyme. Their position under or above the baseline indicates downregulation or upregulation, respectively. Leucine biosynthesis diagram and
nomenclature from [42]; diagram drawn with Cell Designer [136] and Adobe Illustrator [137]. Enzymes consistently upregulated under both
conditions are marked in red. Metabolic steps (enzymes): Ilv2p, acetolactate synthase; Ilv6p, regulatory subunit of acetolactate synthase; Ilv5p,
acetohydroxyacid reductoisomerase; Ilv3p, dihydroxyacid dehydratase; Leu4p, 2-isopropylmalate synthase (main isozyme); Leu9p, 2-isopropylmalate
synthase (minor isozyme); Leu1p, isopropylmalate isomerase; Leu2p, 3-isopropylmalate dehydrogenase; Bat1p, mitochondrial branched-chain aminoacid aminotransferase; Bat2p, cytosolic branched-chain amino-acid aminotransferase.
itself, where individual intermediates can alter enzyme
activity? In Figure 8, we show the impact of a change in
growth rate (from 0.1 to 0.2/hour, in carbon- and phosphate-limited chemostat cultures) on the relative levels of
the enzymes involved in the biosynthesis of leucine, an
amino acid that has been reported as an upstream regulator
of the TOR pathway [31].
These data show that, within a particular metabolic
pathway, some enzymatic steps may be selectively regulated
at the level of enzyme production (for example, Ilv3p,
Leu1p), whereas others exhibit negligible regulation at the
protein level (for example, Ilv5p). Our results support the
‘hierarchical’ control concept encompassed by regulation
analysis theory [110] that has been used previously to
explain the control of glycolysis in yeast [111,112]. What is
now required is some convenient approach that will permit
a global, systematic integration of metabolome data with
those of transcriptomics and proteomics, rather than the
case-by-case analysis that we have presented here.
The above examples show that integration of transcriptomic, proteomic, and metabolomic studies can provide
detailed information on cellular strategies for control of
metabolic fluxes. They have revealed the existence of differentially regulated isoenzymes, which make complementary
contributions to metabolic flux at different growth rates.
This integrative approach, and the information obtained
from it, opens the way for systems biology to exploit new
theories (such as regulation analysis theory [110]) that
derive from the concepts of metabolic control analysis.
They also suggest novel strategies for the comprehensive
Journal of Biology 2007, 6:4
4.18 Journal of Biology 2007,
Volume 6, Article 4
Castrillo et al.
metabolic engineering of yeast, one of the great workhorses
of both ancient and modern biotechnology.
Conclusions
The principle of multilevel regulation in metabolic control
analysis has been explored in a systems biology study of the
eukaryotic cell. We have measured the impact of changes in
growth rate on the transcriptome, proteome, and endo- and
exometabolomes of the yeast S. cerevisiae. Each level shows
clear growth-rate-associated trends and also discriminates
between different nutrient-limiting conditions.
Characteristic signatures at the transcriptomic, proteomic,
and exo- and endo-metabolomic levels reveal groups of
growth-regulated genes, proteins and biological processes
controlled at different levels, with specific outliers characteristic for each nutrient-limiting condition. A large proportion
of the growth-regulated yeast genes share protein orthologs
with other eukaryotes, including humans, which points to
the existence of an essentially conserved core protein
machinery governing cell growth in Eukarya. A high proportion (72.5%) of these growth-regulated genes appear to be
targets for the TORC1 signaling pathway and participate in
a high number of protein-protein interactions.
Our studies emphasize the importance of TOR as a central
controller that integrates not only the sensing of nutritional
status, but also the response of all aspects of gene expression, including transcription, translation and protein stability [3,31,32,55,113]. One relevant design rule [114]
elucidated by this study and data from our category 2 experiments (D. Delneri and S.G.O., unpublished work) is that
major controllers of eukaryotic cell growth (such as TOR),
are not themselves subject to growth-rate control at the transcriptional level. This appears to be a general trend in
biology. This, and the fact that genome-wide studies aimed to
extract all genes regulated under one condition fail to detect
genes known to make a significant phenotypic contribution
in the same condition [41,115,116], points to the need for
incorporation of new integrative strategies in order to identify
groups of genes controlled at different regulatory levels.
At the gene-expression level, comprehensive integration of
quantitative proteome and transcriptome data reveals the
widespread extent and importance of post-transcriptional
mechanisms in growth-rate control, specific for each nutrient-limiting condition, and suggests that the translational
efficiencies of particular mRNAs are modulated selectively
in order to fine-tune protein activities and metabolic fluxes
during cell growth. Our studies open the way towards the
dissection of the contribution of transcriptional and translational control of gene expression in genome-wide studies.
/>
Control of metabolic fluxes at the level of enzyme concentration is demonstrated by the integration of quantitative proteomic and metabolome studies. The regulation
of metabolic flux appears as a dynamic process, involving
distributed control at the transcriptional, translational
and post-translational levels, and fine-tuning at the level
of the metabolites themselves [117,118]. This would
appear to be one of the sources of the intrinsic adaptability and distributed robustness of the eukaryotic cell,
allowing it to adapt to short- and long-term environmental changes [119].
In all, the results reveal a multilevel, fine regulation of gene
expression and metabolic fluxes during cell growth. Our
results have direct implications in advanced studies on cell
growth, in vivo regulation of metabolic fluxes for comprehensive metabolic engineering, and the design of genomescale systems biology models of the eukaryotic cell.
Materials and methods
Yeast strain and experimental strategy
The diploid Saccharomyces cerevisiae strain FY1679
(MATa/MATα ura3-52/ura3-52 leu2-1/+trp1-63/+his3-D200/
+ho::kanMX4/ho::kanMX4 was used for all the experiments.
Conditions for chemostat cultivation in a mineral medium
under C, N, P and S nutrient limitation have been described
previously [14,120] and are given in Additional data file 4).
For the rapamycin study, a culture growing at mid-exponential phase was divided into two. Rapamycin (200 ng/ml)
was added to one half, and the drug’s solvent to the other,
as the control. Samples were taken at 0, 1, 2 and 4 h after
treatment (see Additional data file 4).
Transcriptional studies
Biomass was harvested and total RNA extracted as previously
described [14]. For growth-rate dependence studies, the
microarray experimental design consisted of four nutrientlimiting conditions grown at three growth rates. These 12
conditions were analyzed in quadruplicate using Affymetrix
Yeast Genome S98 GeneChip oligonucleotide arrays
(Affymetrix, Santa Clara, CA). For the rapamycin study,
samples were analyzed in duplicate using YG_S98 arrays
(Affymetrix). Arrays that passed outlier data-quality assessment using dChip software [121] were normalized with
RMAExpress [122]. For each probe set the coefficient of variation (CV) was calculated for each condition (%CV = (standard deviation/mean) × 100). The mean CV (variance in
transcriptional studies) was calculated, being in the range
between 2.4-3.9% in all cases. The data were submitted in
MIAME-compliant format to the ArrayExpress public repository [123] under accession numbers E-MEXP-115 (growthrate studies) and E-MAXD-4 (rapamycin studies).
Journal of Biology 2007, 6:4
/>
Journal of Biology 2007,
Statistical analyses (PCA, t-tests, ANOVA/ANCOVA and
false-discovery rate estimation) to identify significantly regulated genes were performed with Matlab (MathWorks,
Natick, MA) [124], Q-value [40], GeneSpring (Agilent Technologies, Santa Clara, CA) [125] and maxdView software
(available from [126]); see Additional data file 4 for details.
Transcriptome results were validated by comparison of the
patterns of gene expression of genes from equivalent
chemostat experiments using an independent macroarray
technique [19] and, in addition, triplicate analyses of eight
genes were performed by QRT-PCR.
Proteome studies
Yeast were grown in chemostat culture as described above.
Cycloheximide (final concentration 100 µg/ml) was added
to 1-liter steady-state chemostat cultures. Cells (10 × 80 ml)
were harvested and centrifuged at 5,000 rpm for 5 minutes
at 4°C. The pellet was resuspended in 1 ml ice-cold doubledistilled water and transferred to a 1.5-ml microcentrifuge
tube. Cells were repelleted by centrifugation at 10,000 rpm,
the supernatant discarded, and the yeast pellet frozen in dry
ice and stored at -80°C.
Isotope tags for multiplexed relative and absolute quantification
(iTRAQ) of proteins
Protein samples were precipitated as follows. Chilled acetone
(1.8 ml) was added to a 300 µl sample. The tubes were
inverted three times and left at -20°C for 4 h. Precipitated
proteins were pelleted by a 10 minute centrifugation at
3,000 rpm, and resuspended in iTRAQ labeling buffer (8 M
urea, 2% Triton X100, 0.1% SDS and 25 mM triethyl
ammonium bicarbonate (TEAB) pH 8.5). Protein concentration was determined using the detergent-compatible BCA
protein assay (Pierce, Rockford, IL).
Each sample (100 µg protein) was then reduced (4 mM
Tris(2-carboxyethyl) phosphine (TCEP), 20°C, 1 h) and cysteines blocked (8 mM methyl methanethiosulfonate (MMTS),
20°C 10 minutes). Samples were then diluted with 50 mM
TEAB (pH 8.5) such that the final urea concentration was
below 1 M, digested with trypsin (1:20) overnight at 37°C
(Promega, Madison, WI; 2.5 µg added at 0 and 1 h) and
lyophilized using a Savant AES2010 speed vacuum system.
Volume 6, Article 4
Castrillo et al. 4.19
reagent and incubated for 1 h at 20°C. Residual reagent was
quenched by adding 100 µl water and incubating for a
further 15 minutes at 20°C. The samples belonging to the
iTRAQ comparisons were then pooled (pooled standard)
and lyophilized.
Cation exchange chromatography
Cation exchange fractionation of the iTRAQ samples was
carried out on a BioLC HPLC system (Dionex, Sunnyvale,
CA) using a polysulphoethyl A column (PolyLC, Columbia,
MD; 2.1 × 200 mm, 5 µm, 300 Å). The three lyophilized
iTRAQ-labeled pools were resuspended in 6 ml 20% vol/vol
acetonitrile (ACN), 10 mM KH2PO4-H3PO4 pH 2.7, loaded
and washed isocratically for 60 minutes at a flow rate of
200 µl/minute to remove the urea, detergents, and excess
reagents. Peptides were eluted using a linear gradient of 30125 mM KCl (20% vol/vol ACN, 10 mM KH2PO4-H3PO4
pH 2.7) over 70 minutes at a flow rate of 200 µl/minute.
Fractions were collected at 2-minute intervals, lyophilized
and resuspended in 70 µl 2% ACN, 0.1% trifluoroacetic
acid. Fractions 13-36 (collected between 65 mM and
105 mM KCl) from each iTRAQ experiment (72 fractions in
total) were analyzed by liquid chromatography followed by
tandem mass spectrometry (LC-MS/MS).
LC-MS/MS analysis
Peptides were separated and analyzed using an Ultimate
Plus nano-LC system (Dionex) coupled to a QSTAR XL
quadrupole TOF hybrid mass spectrometer (Applied Biosystems, Foster City, CA). Samples (60 µl) were loaded onto an
Acclaim PA C16 pre-column (5 mm ì 300 àm internal
diameter, Dionex) at 20 µl/minute and washed with 0.1%
formic acid (FA; also at 20 µl/minute) for 25 minutes to
desalt the samples. Peptides were then eluted onto a
PepMap C18 analytical column (15 cm ì 75 àm internal
diameter, Dionex) at 150 nl/minute and separated using a
165 minute gradient of 5-32% ACN (0.1% FA). The QSTAR
XL was operated in information-dependent acquisition
(IDA) mode, in which a 1 second TOF-MS scan from 4001,600 m/z was performed, followed by 3 second product
ion scans from 100-1,580 m/z on the two most intense
doubly (2+) or triply (3+) charged ions.
MS data analysis and protein quantification
Three separate iTRAQ labeling experiments were carried out
such that each sample corresponding to a nutrient limitation and growth rate was labeled once. In each experiment
one of the iTRAQ tags was used to label a pooled sample
comprising equal amounts of each sample analyzed within
the experiment (see Additional data file 1 (Figure S28) for
the iTRAQ labeling scheme). Each lyophilized sample was
resuspended in 100 µl labeling buffer (0.25 M TEAB, 75%
ethanol), added to one unit of the corresponding iTRAQ
Mass spectrometry data files were processed using the
wiff2DTA software to generate centroided and uncentroided
peak lists [127]. Mascot version 2.0.01 (Matrix Science,
London, UK) was used to search centroided peak lists
against the Saccharomyces Genome Database protein database (latest release). The following modifications were used:
fixed, iTRAQ (K), iTRAQ (N-term), MMTS (C); variable, oxidation (M), iTRAQ (Y). The MS tolerance was 0.2 Da and
the MS/MS tolerance 0.5 Da. Each peak list was also
Journal of Biology 2007, 6:4
4.20 Journal of Biology 2007,
Volume 6, Article 4
Castrillo et al.
searched against a reversed version of the database in order
to determine the false identification rate. Mascot peptide
score thresholds of 29 for all three experiments resulted in
false identification rates of less than 1% for proteins with at
least two peptides. iTRAQ reporter ion ratios were calculated from the uncentroided peak lists using i-Tracker
[35,128]. Normalized reporter ion areas were calculated as
follows: normalized area A = area A/(area A + area B + area
C + area D).
The Genome Annotating Proteomic Pipeline (GAPP) system
[129] was used to parse peptide identification and scoring
information from the Mascot output files and link these to
the quantification data in a relational database (MySQL
version 4.0, MySQL, Uppsala, Sweden). Peptides were quantified if at least three of the four reporter ion peaks were
above a threshold of 15 counts and if they had a Mascot
score of at least 20. In addition, only peptides that were
unique to a single identified protein were quantified. After
application of this strategy, we were able to quantify a significant proportion of the yeast proteome (around 700 proteins per nutrient-limiting condition; 584 common to all
nutrient-limiting conditions; 1,358 unique proteins in
total). The global coefficient of variance of the proteomics
data was calculated using replicate pools and never
exceeded 13%. Proteomics (iTRAQ) results were validated
by two-dimensional difference gel electrophoresis [101,102],
confirming clear growth-rate trends at the global level (by
PCA) and consistent trends in patterns of expression of representative relevant proteins (for example, Aco1p, Cpa2p,
Rpl5p, Met6p, Sam2p, Ado1p) (data not shown). Proteomic
data are in the process of being submitted to the PRIDE proteomics repository [130].
Metabolome studies
Sampling, quenching, and efficient extraction for endoand exometabolome analyses of hundreds of intra- and
extracellular metabolites, including the main glycolytic
intermediates, nucleotides, pyridine nucleotides, and
organic acids (for example, pyruvate, citrate, and succinate)
were carried out as described previously [131]. Direct
quenching of the culture was performed by fast sampling
of a volume of culture equivalent to 30 mg dry weight
[131]; extracts and culture supernatants were stored at 80°C. Samples were prepared for MS immediately before
the analysis was carried out.
GC/TOF-MS analysis
Two different sample types were analyzed, endometabolome and exometabolome. Endometabolome samples
(typically 200 µl) were spiked with 4 µl internal standard
solution (2.22 mg/ml [2H2]malonic acid, 1.92 mg/ml
[2H5]glycine and 0.61 mg/ml [13C6]glucose dissolved in
/>
water) and lyophilized using a Speedvac concentrator
vacuum system SPD111V connected to a Micromodulyo
Freeze Dryer (ThermoLife Sciences, Basingstoke, UK).
Exometabolome samples (1,000 µl) were spiked with 20 µl
internal standard solution and lyophilized as previously
described. Dried samples were derivatized as follows; 100 µl
of 20 mg/ml O-methylhydroxylamine solution was added
and heated at 40°C for 90 minutes followed by addition of
100 µl N-acetyl-N-(trimethylsilyl)-trifluoroacetamide and
heating at 40°C for 120 minutes. The final solution was
spiked with 20 µl retention index solution (0.6 mg/ml
n-decane, n-dodecane, n-pentadecane, n-nonadecane, n-docosane dissolved in hexane).
All samples were analyzed on an Agilent 6890 gas chromatograph coupled to a LECO Pegasus III time-of-flight
mass spectrometer (LECO, St Joseph, MI) using the manufacturer’s software (ChromaTOF version 2.12) and a DB-50
GC column (Supelco, Gillingham, UK; 30 m ì 0.25 mm ì
0.25 àm film thickness). The instrument conditions are
detailed in Additional data file 2 (Table S30). In the ChromaTOF software the S/N threshold was set at 10, baseline
offset at 1.0, data points for averaging at 7, and peak width
at 2.5. The TOF mass spectrometer can collect spectra at up
to 500 Hz and uses sophisticated but proprietary deconvolution software to discriminate overlapping peaks on the
basis of their mass spectra. Initial processing of raw data was
undertaken using LECO ChromaTOF v2.12 software to construct a data matrix (metabolite peak versus sample number)
using response ratios (peak area metabolite/peak area
[2H2]malonic acid) to calculate the relative amount of each
metabolite in each sample. For each metabolite peak for
each set of three biological replicates, the CV was calculated
as follows: %CV = (standard deviation/mean) × 100. The
mean CV for replicate analytical analyses (n = 3) was 24.6%
for all analyses undertaken, with 62% of these analyses
having a CV less than 20% and 38.04% having one less
than 10%. Although this shows precision to be less robust
than for targeted analyses, this is appropriate in metabolic
profiling, where many hundreds of metabolites are detected
in short analysis times.
Metabolite peaks were initially identified by searches on a
commercially available mass spectral library [NIST/EPA/
NIH (02)] (US National Institute of Standards and Technology, the Environmental Protection Agency and the National
Institutes of Health; 2002) and libraries prepared by one of
us (W.B.D.). For a peak to be identified required a similarity
and reverse match score of greater than 700. Metabolite
identification was confirmed by the analysis of pure chemical standards in identical conditions to the sample analysis.
Identification was confirmed if the retention time (±5 s)
and mass spectra (similarity and reverse matches greater
Journal of Biology 2007, 6:4
/>
Journal of Biology 2007,
than 750) of metabolite peak in sample and standard were
equivalent. A list of profiled metabolites will be available
on request at the Manchester Centre for Integrative Systems
Biology website [132] after all metabolomic data are structured and annotated in a machine-usable form for efficient
data management (MeMo [133]) towards the implementation of a standard metabolomics framework [134].
Volume 6, Article 4
Castrillo et al. 4.21
it follows that the Ratio[( / )p/( / )tr]i is numerically equal
to the ratio of translational control efficiencies i, from condition 1 to condition 2:
Ratio[( / )p/( / )tr]i = (Trlc Eff)2/(Trlc Eff)1 =
(Ratio Trlc Eff)i (3)
See also Additional data file 7.
Analysis of GC/MS raw data and metabolite levels
Within a GC/MS-based data matrix composed of response
ratios (peak area-metabolite/peak area-internal standard),
zero (or not detected) values can be obtained for any given
metabolite peak caused by either of the following reasons:
the metabolite is not present or is present at a concentration
below the limit of detection; or the metabolite cannot be
resolved from others in the chromatograph by the deconvolution software. In these cases, the following procedure was
used to improve data structure for further univariate analysis techniques. If two of three replicates were zero values
and the third replicate was a non-zero value, the third (nonzero) replicate was replaced with zero. If two of three replicates were non-zero values and the third replicate was a zero
value, the zero value for the third replicate was replaced
with the mean of the other two replicates.
Relative changes in translational control efficiencies are
obtained from microarray and proteomic studies. These
compare relative changes in gene expression of the same
individual transcript (or protein) between two different
growth rates. In these one-to-one comparisons, systematic
errors due to, for example, different labeling or hybridization efficiencies are minimized. Moreover, we have sought
to reduce all sources of systematic error and a summary of
the strategies applied is included below. Despite all these
precautions, translational control efficiencies will always be
dependent on the accuracy of the techniques used to determine relative changes in gene expression. To evaluate these
data, one must take into account the CV obtained for each
independent technique used. These are provided above.
Minimization of systematic error
Determination of relative changes in translational control efficiencies
To encompass all mechanisms involved in translational
control and to quantify its global effect, we define the translational control efficiency of each mRNAi (Trlc Effi) as the
effective translation of each transcript into protein (encompassing synthesis and degradation processes; net P/R ratio
(protein/mRNA) as follows:
Trlc Effi = ([Proteini]/([mRNAi]) (see also Additional data file 7).
From protein-transcriptome correlation studies we can
define the ratio of relative changes in protein versus transcript levels (ratio[( / )p/( / ) tr]) as:
Ratio [( / )p/( / )tr]i =
([Proteini]2/[Proteini]1)/([mRNAi]2/[mRNAi]1) (1)
Thus, as an example, when applied to relative changes
between two growth rates, for example, 0.2 versus 0.1/h:
Ratio[( / )p/( / )tr]i =
[(Proteini 0.2/Proteini 0.1)/(Transcripti 0.2/Transcripti 0.1)]i =
([Proteini] 0.2/[Proteini] 0.1)/([mRNAi] 0.2/[mRNAi] 0.1)
From here, as Equation (1) can be rearranged as:
Ratio[( / )p/( / )tr]i =
([Proteini]2/([mRNAi]2)/([Proteini]1/[mRNAi]1) (2)
We sought to minimize sources of systematic error, first by
careful experimental design (see above) and the application
of the following strategies: use of steady-state chemostat cultures ensuring carefully controlled environmental conditions at each constant growth rate [14-17]; avoidance of
prolonged cultivation studies (that is, keeping to below 60
generations) to eliminate risks of strain variability and/or
mutational effects; fast sampling and growth-arrest methods
avoiding environmental disturbances for proper transcriptome, proteome and metabolome analyses; for each omic
analysis, all samples were processed by the same specialist
researcher; careful analytical strategies and normalization
methods (see Additional data file 4).
Additional data files
The following additional data are available with this paper
online. Additional data file 1 contains additional figures.
Additional data file 2 contains additional tables. Additional
data file 3 contains the legends for the additional figures
and tables. Additional data file 4 contains supplementary
methods, including data analysis and processing for PCA,
transcriptome, proteome and metabolome data analyses
and integrative studies, statistical analyses on omic datasets,
GO studies, and analysis of protein-protein interactions.
Additional data file 5 includes additional studies on transcriptional control of cell growth. Additional data file 6
contains proteome-transcriptome correlations. Additional
Journal of Biology 2007, 6:4
4.22 Journal of Biology 2007,
Volume 6, Article 4
Castrillo et al.
data file 7 contains the main concepts of translational control
efficiency and translational control. Additional data file 8 contains global patterns of relative changes in translational
control efficiencies. The whole article (with links to the additional documents) will also be available at the Manchester
Centre for Integrative Systems Biology website [132].
Acknowledgements
This work was supported by grants from BBSRC’s Investigating Gene
Function Initiative to SGO, SJG and NWP for COGEME (Consortium
for the Functional Genomics of Microbial Eukaryotes) [135] and to KSL,
by BBSRC Project Grants to SGO and DBK (including a studentship to
MB), and a grant from the Wellcome Trust to SGO. LAZ and LW were
supported by the Wellcome Trust. LH was supported by a CASE Studentship from BBSRC and AstraZeneca. We thank Michael Wilson
(Computer Science, Manchester) for assistance with submission of
expression data to the ArrayExpress repository. We also thank Roy
Goodacre (Chemistry, Manchester) and Pinar Pir (Faculty of Life Sciences, Manchester) for helping in the management and processing of the
metabolome data. Julie Howard (Biochemistry, Cambridge) is thanked
for assistance in generating and analyzing protein MS data, and Conrad
Bessant and Ian Shadforth (Cranfield University, UK) for their assistance
on the GAPP and i-Tracker proteomics data analysis. This is a contribution from the Centre for the Analysis of Biological Complexity (CABC;
Faculty of Life Sciences, Manchester) and the Manchester Centre for
Integrative Systems Biology [132].
References
1.
2.
3.
4.
5.
6.
7.
8.
9.
10.
11.
12.
13.
Kacser H, Burns JA: The control of flux. Symp Soc Exp Biol 1973,
27:65-104.
Warner JR: The economics of ribosome biosynthesis in
yeast. Trends Biochem Sci 1999, 24:437-440.
Fingar DC, Blenis J: Target of rapamycin (TOR): an integrator of nutrient and growth factor signals and coordinator
of cell growth and cell cycle progression. Oncogene 2004, 23:
3151-3171.
Hall MN, Raff M, Thomas G (Eds): Cell Growth: Control of Cell Size.
Monograph 42. New York: Cold Spring Harbor Laboratory Press;
2004.
Jorgensen P, Tyers M, Warner JR: Forging the factory: ribosome synthesis and growth control in budding yeast. In Cell
Growth: Control of Cell Size. Monograph 42. Edited by Hall MN, Raff
M, Thomas G. New York: Cold Spring Harbor Laboratory Press;
2004:329-370.
Manning BD, Cantley LC: Sizing up a growing field. Nature
2004, 431:128-129.
Hartwell LH, Weinert TA: Checkpoints: controls that ensure
the order of cell cycle events. Science 1989, 246:629-634.
Spellman PT, Sherlock G, Zhang MQ, Iyer VR, Anders K, Eisen MB,
Brown PO, Botstein D, Futcher B: Comprehensive identification of cell cycle-regulated genes of the yeast Saccharomyces cerevisiae by microarray hybridization. Mol Biol Cell
1998, 9:3273-3297.
Jorgensen P, Nishikawa JL, Breitkreutz BJ, Tyers M: Systematic
identification of pathways that couple cell growth and division in yeast. Science 2002, 297:395-400.
Jorgensen P, Tyers M: How cells coordinate growth and division. Curr Biol 2004, 14:R1014-R1027.
Mager WH, Planta RJ: Coordinate expression of ribosomal
protein genes in yeast as a function of cellular growth
rate. Mol Cell Biochem 1991, 104:181-187.
Kraakman LS, Griffioen G, Zerp S, Groeneveld P, Thevelein JM,
Mager WH, Planta RJ: Growth-related expression of ribosomal protein genes in Saccharomyces cerevisiae. Mol Gen
Genet 1993, 239:196-204.
Planta RJ: Regulation of ribosome synthesis in yeast. Yeast
1997, 13:1505-1518.
/>
14. Hayes A, Zhang N, Wu J, Butler PR, Hauser NC, Hoheisel JD, Lim
FL, Sharrocks AD, Oliver SG: Hybridization array technology
coupled with chemostat culture: Tools to interrogate
gene expression in Saccharomyces cerevisiae. Methods 2002,
26:281-290.
15. van Uden N: Yield and maintenance analysis in the chemostat; a tool for metabolic studies of growing cells. Arch
Mikrobiol 1968, 62:34-40.
16. Hoskisson PA, Hobbs G: Continuous culture - making a
comeback? Microbiology 2005, 151:3153-3159.
17. Ferenci T: A cultural divide on the use of chemostats. Microbiology 2006, 152:1247-1248.
18. Boer VM, de Winde JH, Pronk JT, Piper MD: The genome-wide
transcriptional responses of Saccharomyces cerevisiae
grown on glucose in aerobic chemostat cultures limited
for carbon, nitrogen, phosphorus, or sulfur. J Biol Chem 2003,
278:3265-3274.
19. Wu J, Zhang N, Hayes A, Panoutsopoulou K, Oliver SG: Global
analysis of nutrient control of gene expression in Saccharomyces cerevisiae during growth and starvation. Proc Natl
Acad Sci USA 2004, 101:3148-3153.
20. Kolkman A, Daran-Lapujade P, Fullaondo A, Olsthoorn MM, Pronk
JT, Slijper M, Heck AJ: Proteome analysis of yeast response
to various nutrient limitations. Mol Syst Biol 2006, 2:
2006.0026.
21. Beilharz TH, Preiss T: Translational profiling: the genomewide measure of the nascent proteome. Brief Funct Genomic
Proteomic 2004, 3:103-111.
22. Arava Y, Wang Y, Storey JD, Liu CL, Brown PO, Herschlag D:
Genome-wide analysis of mRNA translation profiles in
Saccharomyces cerevisiae. Proc Natl Acad Sci USA 2003, 100:
3889-3894.
23. Arava Y, Boas FE, Brown PO, Herschlag D: Dissecting eukaryotic translation and its control by ribosome density
mapping. Nucleic Acids Res 2005, 33:2421-2432.
24. Mata J, Marguerat S, Bähler J: Post-transcriptional control of
gene expression: a genome-wide perspective. Trends
Biochem Sci 2005, 30:506-514.
25. Kahn D, Westerhoff HV: Control theory of regulatory cascades. J Theor Biol 1991, 153:255-285.
26. Kitano H: Systems biology: a brief overview. Science 2002,
295:1662-1664.
27. Nurse P: Systems biology: understanding cells. Nature 2003,
424:883.
28. Castrillo JI, Oliver SG: Metabolomics and systems biology in
Saccharomyces cerevisiae. In Fungal Genomics. The Mycota.
Volume XIII. Edited by Esser K. Berlin: Springer-Verlag; 2006:3-18.
29. Kell DB: Metabolomics, modelling and machine learning in
systems biology: towards an understanding of the languages of cells. The 2005 Theodor Bucher Lecture. FEBS J
2006, 273:873-894.
30. Bjornsti MA, Houghton PJ: The TOR pathway: a target for
cancer therapy. Nat Rev Cancer 2004, 4:335-348.
31. Guertin DA, Kim D-H, Sabatini DM: Growth control through
the mTOR network. In Cell Growth: Control of Cell Size. Monograph 42. Edited by Hall MN, Raff M, Thomas G. New York: Cold
Spring Harbor Laboratory Press; 2004:193-234.
32. Loewith R, Hall MN: TOR signalling in yeast: Temporal and
spatial control of cell growth. In Cell Growth: Control of Cell Size.
Monograph 42. Edited by Hall MN, Raff M, Thomas G. New York:
Cold Spring Harbor Laboratory Press; 2004:139-165.
33. Thomas G, Sabatini DM, Hall MN (Eds): TOR: target of
rapamycin. Curr Top Microbiol Immunol 279. New York: SpringerVerlag; 2004.
34. Ross PL, Huang YN, Marchese JN, Williamson B, Parker K, Hattan
S, Khainovski N, Pillai S, Dey S, Daniels S, et al.: Multiplexed
protein quantitation in Saccharomyces cerevisiae using
amine-reactive isobaric tagging reagents. Mol Cell Proteomics
2004, 3:1154-1169.
35. Shadforth IP, Dunkley TP, Lilley KS, Bessant C: i-Tracker: for
quantitative proteomics using iTRAQ. BMC Genomics 2005,
6:145.
Journal of Biology 2007, 6:4
/>
Journal of Biology 2007,
36. Oliver SG: From gene to screen with yeast. Curr Opin Genet
Dev 1997, 7:405-409.
37. Allen J, Davey HM, Broadhurst D, Heald JK, Rowland JJ, Oliver SG,
Kell DB: High-throughput classification of yeast mutants
for functional genomics using metabolic footprinting. Nat
Biotechnol 2003, 21:692-696.
38. Kell DB, Brown M, Davey HM, Dunn WB, Spasic I, Oliver SG:
Metabolic footprinting and systems biology: the medium
is the message. Nat Rev Microbiol 2005, 3:557-565.
39. Nielsen J, Oliver S: The next wave in metabolome analysis.
Trends Biotechnol 2005, 23:544-546.
40. Storey JD: A direct approach to false discovery rates. J R Stat
Soc Ser B 2002, 64:479-498.
41. Giaever G, Chu AM, Ni L, Connelly C, Riles L, Veronneau S, Dow
S, Lucau-Danila A, Anderson K, Andre B, et al.: Functional profiling of the Saccharomyces cerevisiae genome. Nature 2002,
418:387-391.
42. Saccharomyces Genome Database (SGD) [http://www.
yeastgenome.org]
43. Ashburner M, Ball CA, Blake JA, Botstein D, Butler H, Cherry JM,
Davis AP, Dolinski K, Dwight SS, Eppig JT, et al.: Gene ontology:
tool for the unification of biology. The Gene Ontology
Consortium. Nat Genet 2000, 25:25-29.
44. GoMiner tool [ />45. GenMAPP tool []
46. Ferenci T: Regulation by nutrient limitation. Curr Opin Microbiol 1999, 2:208-213.
47. Ohsumi Y: Autophagy: reversing cell growth. In Cell Growth,
Control of Cell Size. Monograph 42. Edited by Hall MN, Raff M,
Thomas G. New York: Cold Spring Harbor Laboratory Press;
2004:413-429.
48. Kamada Y, Sekito T, Ohsumi Y: Autophagy in yeast: a TORmediated response to nutrient starvation. Curr Top Microbiol
Immunol 2004, 279:73-84.
49. Gasch AP, Spellman PT, Kao CM, Carmel-Harel O, Eisen MB,
Storz G, Botstein D, Brown PO: Genomic expression programs in the response of yeast cells to environmental
changes. Mol Biol Cell 2000, 11:4241-4257.
50. Gasch AP, Werner-Washburne M: The genomics of yeast
responses to environmental stress and starvation. Funct
Integr Genomics 2002, 2:181-192.
51. Balakrishnan R, Christie KR, Costanzo MC, Dolinski K, Dwight SS,
Engel SR, Fisk DG, Hirschman JE, Hong EL, Nash R, et al.: Fungal
BLAST and model organism BLASTP best hits: new comparison resources at the Saccharomyces Genome Database (SGD). Nucleic Acids Res 2005, 33 (Database Issue):
D374-D377.
52. SGD model organism BLASTP best hits [http://db.
yeastgenome.org/cgi-bin/bestHits]
53. Krogan NJ, Cagney G, Yu H, Zhong G, Guo X, Ignatchenko A, Li J,
Pu S, Datta N, Tikuisis AP, et al.: Global landscape of protein
complexes in the yeast Saccharomyces cerevisiae. Nature
2006, 440:637-643.
54. Barbet NC, Schneider U, Helliwell SB, Stansfield I, Tuite MF, Hall
MN: TOR controls translation initiation and early G1 progression in yeast. Mol Biol Cell 1996, 7:25-42.
55. Dorrello NV, Peschiaroli A, Guardavaccaro D, Colburn NH,
Sherman NE, Pagano M: S6K1- and βTRCP-mediated degradation of PDCD4 promotes protein translation and cell
growth. Science 2006, 314:467-471.
56. Li H, Tsang CK, Watkins M, Bertram PG, Zheng XF: Nutrient
regulates Tor1 nuclear localization and association with
rDNA promoter. Nature 2006, 442:1058-1061.
57. Kuruvilla FG, Shamji AF, Schreiber SL: Carbon- and nitrogenquality signaling to translation are mediated by distinct
GATA-type transcription factors. Proc Natl Acad Sci USA 2001,
98:7283-7288.
58. Marion RM, Regev A, Segal E, Barash Y, Koller D, Friedman N,
O’Shea EK: Sfp1 is a stress-and nutrient-sensitive regulator
of ribosomal protein gene expression. Proc Natl Acad Sci USA
2004, 101:14315-14322.
59. Martin DE, Soulard A, Hall MN: TOR regulates ribosomal
protein gene expression via PKA and the Forkhead transcription factor FHL1. Cell 2004, 119:969-979.
Volume 6, Article 4
Castrillo et al. 4.23
60. Schawalder SB, Kabani M, Howald I, Choudhury U, Werner M,
Shore D: Growth-regulated recruitment of the essential
yeast ribosomal protein gene activator Ifh1. Nature 2004,
432:1058-1061.
61. Hardwick JS, Kuruvilla FG, Tong JK, Shamji AF, Schreiber SL:
Rapamycin-modulated transcription defines the subset of
nutrient-sensitive signalling pathways directly controlled
by the Tor proteins. Proc Natl Acad Sci USA 1999, 96:1486614870.
62. Preiss T, Baron-Benhamou J, Ansorge W, Hentze MW: Homodirectional changes in transcriptome composition and
mRNA translation induced by rapamycin and heat shock.
Nat Struct Biol 2003, 10:1039-1047.
63. Reinke A, Anderson S, McCaffery JM, Yates J 3rd, Aronova S, Chu
S, Fairclough S, Iverson C, Wedaman KP, Powers T: TOR
complex 1 includes a novel component, Tco89p
(YPL180w), and cooperates with Ssd1p to maintain cellular integrity in Saccharomyces cerevisiae. J Biol Chem 2004,
279:14752-14762.
64. Daran-Lapujade P, Jansen ML, Daran JM, van Gulik W, de Winde
JH, Pronk JT: Role of transcriptional regulation in controlling fluxes in central carbon metabolism of Saccharomyces
cerevisiae. A chemostat culture study. J Biol Chem 2004, 279:
9125-9138.
65. Tian Q, Stepaniants SB, Mao M, Weng L, Feetham MC, Doyle MJ,
Yi EC, Dai H, Thorsson V, Eng J, et al.: Integrated genomic and
proteomic analyses of gene expression in mammalian
cells. Mol Cell Proteomics 2004, 3:960-969.
66. Gygi SP, Rochon Y, Franza BR, Aebersold R: Correlation
between protein and mRNA abundance in yeast. Mol Cell
Biol 1999, 19:1720-1730.
67. Pradet-Balade B, Boulme F, Beug H, Mullner EW, Garcia-Sanz JA:
Translation control: bridging the gap between genomics
and proteomics? Trends Biochem Sci 2001, 26:225-229.
68. Greenbaum D, Jansen R, Gerstein M: Analysis of mRNA
expression and protein abundance data: an approach for
the comparison of the enrichment of features in the cellular population of proteins and transcripts. Bioinformatics
2002, 18:585-596.
69. Greenbaum D, Colangelo C, Williams K, Gerstein M: Comparing
protein abundance and mRNA expression levels on a
genomic scale. Genome Biol 2003, 4:117.
70. Thomas D, Surdin-Kerjan Y: The synthesis of the two Sadenosyl-methionine synthetases is differently regulated
in Saccharomyces cerevisiae. Mol Gen Genet 1991, 226:224-232.
71. Griffin TJ, Gygi SP, Ideker T, Rist B, Eng J, Hood L, Aebersold R:
Complementary profiling of gene expression at the transcriptome and proteome levels in Saccharomyces cerevisiae. Mol Cell Proteomics 2002, 1:323-333.
72. Brengues M, Teixeira D, Parker R: Movement of eukaryotic
mRNAs between polysomes and cytoplasmic processing
bodies. Science 2005, 310:486-489.
73. Ciechanover A: Proteolysis: from the lysosome to ubiquitin
and the proteasome. Nat Rev Mol Cell Biol 2005, 6:79-87.
74. Pratt JM, Petty J, Riba-Garcia I, Robertson DH, Gaskell, SJ, Oliver
SG, Beynon RJ: Dynamics of protein turnover, a missing
dimension in proteomics. Mol Cell Proteomics 2002, 1:579-591.
75. Messenguy F, Feller A, Crabeel M, Pierard A: Control-mechanisms acting at the transcriptional and post-transcriptional levels are involved in the synthesis of the arginine
pathway carbamoylphosphate synthase of yeast. EMBO J
1983, 2:1249-1254.
76. Fang P, Wang Z, Sachs MS: Evolutionarily conserved features
of the arginine attenuator peptide provide the necessary
requirements for its function in translational regulation. J
Biol Chem 2000, 275:26710-26719.
77. Gaba A, Jacobson A, Sachs MS: Ribosome occupancy of the
yeast CPA1 upstream open reading frame termination
codon modulates nonsense-mediated mRNA decay. Mol
Cell 2005, 20:449-460.
78. Zhang Z, Dietrich FS: Identification and characterization of
upstream open reading frames (uORF) in the 5’ untrans-
Journal of Biology 2007, 6:4
4.24 Journal of Biology 2007,
79.
80.
81.
82.
83.
84.
85.
86.
87.
88.
89.
90.
91.
92.
93.
94.
95.
96.
97.
98.
99.
100.
101.
Volume 6, Article 4
Castrillo et al.
lated regions (UTR) of genes in Saccharomyces cerevisiae.
Curr Genet 2005, 48:77-87.
Oliver SG: Functional genomics: lessons from yeast. Philos
Trans R Soc Lond B Biol Sci 2002, 357:17-23.
Pir P, Kirdar B, Hayes A, Onsan ZY, Ulgen KO, Oliver SG: Integrative investigation of metabolic and transcriptomic
data. BMC Bioinformatics 2006, 7:203.
Patil KR, Nielsen J: Uncovering transcriptional regulation of
metabolism by using metabolic network topology. Proc Natl
Acad Sci USA 2005, 102:2685-2689.
Thomas D, Surdin-Kerjan Y: Metabolism of sulfur amino acids
in Saccharomyces cerevisiae. Microbiol Mol Biol Rev 1997, 61:
503-532.
Thomas D, Becker A, Surdin-Kerjan Y: Reverse methionine
biosynthesis from S-adenosylmethionine in eukaryotic
cells. J Biol Chem 2000, 275:40718-40724.
Magasanik B, Kaiser CA: Nitrogen regulation in Saccharomyces cerevisiae. Gene 2002, 290:1-18.
Csete M, Doyle J: Bow ties, metabolism and disease. Trends
Biotechnol 2004, 22:446-450.
Purnelle B, Coster F, Goffeau A: The sequence of a 36 kb
segment on the left arm of yeast chromosome X identifies 24 open reading frames including NUC1, PRP21
(SPP91), CDC6, CRY2, the gene for S24, a homologue to
the aconitase gene ACO1 and two homologues to chromosome III genes. Yeast 1994, 10:1235-1249.
Palmieri L, Agrimi G, Runswick, MJ, Fearnley IM, Palmieri F,
Walker JE: Identification in Saccharomyces cerevisiae of two
isoforms of a novel mitochondrial transporter for 2oxoadipate and 2-oxoglutarate. J Biol Chem 2001, 276:19161922.
Mitchell AP, Magasanik B: Three regulatory systems control
production of glutamine synthetase in Saccharomyces cerevisiae. Mol Cell Biol 1984, 4:2767-2773.
Bender DA: Amino Acid Metabolism. 2nd edition. Chichester: John
Wiley & Sons; 1985.
Hinnebusch AG: General and pathway-specific regulatory
mechanisms controlling the synthesis of amino acid
biosynthetic enzymes in Saccharomyces cerevisiae. In The
Molecular and Cellular Biology of the Yeast Saccharomyces: Gene
Expression. Edited by Jones EW, Pringle JR and Broach JR. New
York: Cold Spring Harbor Laboratory Press; 1992:319-414.
Stanbrough M, Rowen DW, Magasanik B: Role of the GATA
factors Gln3p and Nil1p of Saccharomyces cerevisiae in the
expression of nitrogen-regulated genes. Proc Natl Acad Sci
USA 1995, 92:9450-9454.
Crespo JL, Powers T, Fowler B, Hall MN: The TOR-controlled
transcription activators GLN3, RTG1, and RTG3 are regulated in response to intracellular levels of glutamine. Proc
Natl Acad Sci USA 2002, 99:6784-6789.
Chen X, Blumenthal R M: S-Adenosylmethionine-dependent Methyltransferases: Structures and Functions. Singapore: World Scientific
Publishing; 1999.
Clarke SG, Tamanoi F: Protein Methyltransferases. The Enzymes.
Volume 24. San Diego: Elsevier/Academic Press; 2006.
Loenen WA: S-Adenosylmethionine: jack of all trades and
master of everything? Biochem Soc Trans 2006, 34:330-333.
Farooqui JZ, Lee HW, Kim S, Paik WK: Studies on compartmentation of S-adenosyl-L-methionine in Saccharomyces
cerevisiae and isolated rat hepatocytes. Biochim Biophys Acta
1983, 757:342-351.
Kumar A, Agarwal S, Heyman JA, Matson S, Heidtman M, Piccirillo
S, Umansky L, Drawid A, Jansen R, Liu Y, et al.: Subcellular localization of the yeast proteome. Genes Dev 2002, 16:707-719.
Yeast GFP fusion localization database [http://yeastgfp.
ucsf.edu]
BioGRID database []
Gavin AC, Aloy P, Grandi P, Krause R, Boesche M, Marzioch M,
Rau C, Jensen LJ, Bastuck S, Dumpelfeld B, et al.: Proteome
survey reveals modularity of the yeast cell machinery.
Nature 2006, 440:631-636.
Ünlü M, Morgan ME, Minden JS: Difference gel electrophoresis: a single gel method for detecting changes in protein
extracts. Electrophoresis 1997, 18:2071-2077.
/>
102. Karp NA, Kreil DP, Lilley KS: Determining a significant
change in protein expression with DeCyder during a pairwise comparison using two-dimensional difference gel
electrophoresis. Proteomics 2004, 4:1421-1432.
103. Cherest H, Thomas D, Surdin-Kerjan Y: Polyglutamylation of
folate coenzymes is necessary for methionine biosynthesis
and maintenance of intact mitochondrial genome in Saccharomyces cerevisiae. J Biol Chem 2000, 275:14056-14063.
104. Suliman HS, Sawyer GM, Appling DR, Robertus JD: Purification
and properties of cobalamin-independent methionine synthase from Candida albicans and Saccharomyces cerevisiae.
Arch Biochem Biophys 2005, 441:56-63.
105. Shane B, Cichowicz DJ: Folylpoly-gamma-glutamate synthetases: properties and regulation. Adv Exp Med Biol 1983,
163:149-165.
106. White RJ: Control of rRNA and tRNA production is closely
related to cell growth. In Cell Growth; Control of Cell Size. Monograph 42. Edited by Hall MN, Raff M, Thomas G. New York: Cold
Spring Harbor Laboratory Press; 2004:371-412.
107. Lowe TM, Eddy SR: A computational screen for methylation
guide snoRNAs in yeast. Science 1999, 283:1168-1171.
108. Tschochner H, Hurt E: Pre-ribosomes on the road from the
nucleolus to the cytoplasm. Trends Cell Biol 2003, 13:255-263.
109. Schwer B, Saha N, Mao X, Chen HW, Shuman S: Structure-function analysis of yeast mRNA cap methyltransferase and
high-copy suppression of conditional mutants by AdoMet
synthase and the ubiquitin conjugating enzyme Cdc34p.
Genetics 2000, 155:1561-1576.
110. ter Kuile BH, Westerhoff HV: Transcriptome meets metabolome: hierarchical and metabolic regulation of the glycolytic pathway. FEBS Lett 2001, 500:169-171.
111. Rossell S, van der Weijden CC, Kruckeberg AL, Bakker BM, Westerhoff HV: Hierarchical and metabolic regulation of glucose
influx in starved Saccharomyces cerevisiae. FEMS Yeast Res
2005, 5:611-619.
112. Rossell S, van der Weijden CC, Lindenbergh A, van Tuijl A,
Francke C, Bakker BM, Westerhoff HV: Unraveling the complexity of flux regulation: a new method demonstrated for
nutrient starvation in Saccharomyces cerevisiae. Proc Natl
Acad Sci USA 2006, 103:2166-2171.
113. Powers T, Dilova I, Chen, CY, Wedaman K: Yeast TOR signaling: a mechanism for metabolic regulation. Curr Top Microbiol Immunol 2004, 279:39-51.
114. Di Ventura B, Lemerle C, Michalodimitrakis K, Serrano L: From
in vivo to in silico biology and back. Nature 2006, 443:527-533.
115. Lee W, St Onge RP, Proctor M, Flaherty P, Jordan MI, Arkin AP,
Davis RW, Nislow C, Giaever G: Genome-wide requirements
for resistance to functionally distinct DNA-damaging
agents. PLoS Genet 2005, 1:e24.
116. Murata Y, Homma T, Kitagawa E, Momose Y, Sato MS, Odani M,
Shimizu H, Hasegawa-Mizusawa M, Matsumoto R, Mizukami S, et
al.: Genome-wide expression analysis of yeast response
during exposure to 4 degrees C. Extremophiles 2006, 10:117128.
117. Fell D: Understanding the Control of Metabolism. London: Portland
Press; 1997.
118. Hornberg JJ, Binder B, Bruggeman FJ, Schoeberl B, Heinrich R,
Westerhoff HV: Control of MAPK signalling: from complexity to what really matters. Oncogene 2005, 24:5533-5542.
119. Wagner A: Robustness and Evolvability in Living Systems. Princeton
Studies in Complexity. Princeton, NJ: Princeton University Press;
2005.
120. Baganz F, Hayes A, Marren D, Gardner DCJ, Oliver SG: Suitability of replacement markers for functional analysis studies
in Saccharomyces cerevisiae. Yeast 1997, 13:1563-1573.
121. dChip software []
122. RMAExpress software [ />123. ArrayExpress public repository [ />arrayexpress]
124. Matlab software []
125. GeneSpring software []
126. maxdView software [ />
Journal of Biology 2007, 6:4
/>
Journal of Biology 2007,
127. Boehm A, Galvin R, Sickmann A: Extractor for ESI quadrupole
TOF tandem MS data enabled for high throughput batch
processing. BMC Bioinformatics 2004, 5:162.
128. i-Tracker
software
[ />itracker.htm]
129. Genome Annotating Proteomic Pipeline (GAPP) system
[o]
130. PRIDE proteomics repository [ />131. Castrillo JI, Hayes A, Mohammed S, Gaskell SJ, Oliver SG: An
optimised protocol for metabolome analysis in yeast using
direct infusion electrospray mass spectrometry. Phytochemistry 2003, 62:929-937.
132. Manchester Centre for Integrative Systems Biology
[ />133. Spasic I, Dunn WB, Velarde G, Tseng A, Jenkins H, Hardy N,
Oliver SG, Kell DB: MeMo: a hybrid SQL/XML approach to
metabolomic data management for functional genomics.
BMC Bioinformatics 2006, 7:281.
134. Jenkins H, Hardy N, Beckmann M, Draper J, Smith AR, Taylor J,
Fiehn O, Goodacre R, Bino RJ, Hall R, et al.: A proposed framework for the description of plant metabolomics experiments and their results. Nat Biotechnol 2004, 22:1601-1606.
135. Consortium for the Functional Genomics of Microbial
Eukaryotes, COGEME [ />136. Cell Designer []
137. Adobe Illustrator [ />
Journal of Biology 2007, 6:4
Volume 6, Article 4
Castrillo et al. 4.25