Báo cáo sinh học: "A global analysis of genetic interactions in Caenorhabditis elegans" doc
Bạn đang xem bản rút gọn của tài liệu. Xem và tải ngay bản đầy đủ của tài liệu tại đây (3.52 MB, 27 trang )
Research article
A global analysis of genetic interactions in Caenorhabditis elegans
Alexandra B Byrne*
†
, Matthew T Weirauch
‡
, Victoria Wong*,
Martina Koeva
‡
, Scott J Dixon*
†
, Joshua M Stuart
‡
and Peter J Roy*
†
Addresses: *Department of Medical Genetics and Microbiology, The Terrence Donnelly Centre for Cellular and Biomolecular Research, 160
College St, University of Toronto, Toronto, ON, M5S 3E1, Canada.
†
Collaborative Program in Developmental Biology, University of
Toronto, Toronto, ON, M5S 3E1, Canada.
‡
Department of Biomolecular Engineering, 1156 High Street, Mail Stop SOE2, University of
California, Santa Cruz, CA 95064, USA.
Correspondence: Peter J Roy. Email: ; Joshua M Stuart. Email:
Open Access
Abstract
Background: Understanding gene function and genetic relationships is fundamental to our
efforts to better understand biological systems. Previous studies systematically describing
genetic interactions on a global scale have either focused on core biological processes in
protozoans or surveyed catastrophic interactions in metazoans. Here, we describe a reliable
high-throughput approach capable of revealing both weak and strong genetic interactions in
the nematode Caenorhabditis elegans.
Results: We investigated interactions between 11 ‘query’ mutants in conserved signal trans-
duction pathways and hundreds of ‘target’ genes compromised by RNA interference (RNAi).
Mutant-RNAi combinations that grew more slowly than controls were identified, and genetic
interactions inferred through an unbiased global analysis of the interaction matrix. A network
of 1,246 interactions was uncovered, establishing the largest metazoan genetic-interaction
network to date. We refer to this approach as systematic genetic interaction analysis (SGI).
To investigate how genetic interactions connect genes on a global scale, we superimposed the
SGI network on existing networks of physical, genetic, phenotypic and coexpression
interactions. We identified 56 putative functional modules within the superimposed network,
one of which regulates fat accumulation and is coordinated by interactions with bar-1(ga80),
which encodes a homolog of β-catenin. We also discovered that SGI interactions link distinct
subnetworks on a global scale. Finally, we showed that the properties of genetic networks are
conserved between C. elegans and Saccharomyces cerevisiae, but that the connectivity of
interactions within the current networks is not.
Conclusions: Synthetic genetic interactions may reveal redundancy among functional
modules on a global scale, which is a previously unappreciated level of organization within
metazoan systems. Although the buffering between functional modules may differ between
BioMed Central
Journal of Biology 2007, 6:8
Published: 26 September 2007
Journal of Biology 2007, 6:8
The electronic version of this article is the complete one and can be
found online at />Received: 4 June 2007
Revised: 31 July 2007
Accepted: 17 August 2007
© 2007 Byrne et al.; licensee BioMed Central Ltd.
This is an Open Access article distributed under the terms of the Creative Commons Attribution License ( />which permits unrestricted use, distribution, and reproduction in any medium, provided the original work is properly cited.
Background
A basic premise of genetics is that the biological role of a
gene can be inferred from the consequence of its disruption.
For many genes, however, genetic disruption yields no
detectable phenotype in a laboratory setting. For example,
approximately 66% of genes deleted in Saccharomyces
cerevisiae have no obvious phenotype [1]. A similar fraction
of genes in Caenorhabditis elegans is also expected to be
phenotypically wild type [2-4]. Elucidating the function of
these genes therefore requires an alternative approach to
single gene disruption.
One way to uncover biological roles for phenotypically
silent genes is through genetic modifier screens. Genetic
modifiers are traditionally identified through a random
mutagenesis of individuals harboring one mutant gene
followed by a screen for second-site mutations that either
enhance or suppress the primary phenotype (reviewed in
[5]). Modifying genes identified in this way clearly partici-
pate in the regulation of the process of interest, yet often
have no detectable phenotype on their own [6-10]. Thus,
forward genetic modifier screens are a useful but indirect
approach to ascribe function to genes that otherwise have
no phenotype.
An elegant approach called synthetic genetic array (SGA)
analysis was devised to systematically analyze the pheno-
typic consequences of double mutant combinations in
S. cerevisiae [11]. With SGA, a ‘query’ deletion strain is
mated to a comprehensive library of the nonessential
deletion strains [1] through a mechanical pinning process.
Resulting double-mutant combinations typically have
growth rates indistinguishable from single-mutant controls.
However, some deletion pairs produce a ‘synthetic’ sick or
lethal phenotype not shared by either single mutant, indi-
cating a genetic interaction. The revelation that most non-
essential genes synthetically interact with several partners
from different pathways [11,12] was a major biological
insight, as it suggests that many genes have multiple
redundant functions and provides a satisfying explanation
for the apparent lack of phenotype for the majority of gene
disruptions. Other SGA-related techniques have been
devised to investigate interactions with essential genes [13]
and to mine the consequences of interactions in great detail
[14]. An alternative approach to SGA has been developed to
create double mutants en masse by transforming the entire
deletion library in liquid with a transgene that targets a
query gene for deletion [15].
Synthetic interactions can reveal several classes of genetic
relationships. First, disrupting a pair of genes that belong to
parallel pathways that regulate the same essential process
may reveal a ‘between-pathway’ interaction. Second,
compromising a pair of genes that act either at the same
level of the pathway or are ancillary components at different
levels of the pathway may reveal a ‘within-pathway’
interaction. Finally, each gene of an interacting pair may act
in unrelated processes that collapse the system when
compromised together through poorly understood mecha-
nisms, revealing an ‘indirect’ interaction [16]. We note that
as the cell may function by coordinating collections of gene
products that work together as discrete units, called
molecular machines or functional modules [17,18], these
‘indirect interactions’ may actually reveal redundancy
between previously unrecognized functional modules. To
investigate which model best describes an interaction in
yeast, physical-interaction data have been mapped onto
synthetic genetic-interaction networks [11,12,16,19]. This
type of analysis suggests that between-pathway models
account for roughly three and a half times as many synthetic
genetic interactions compared with ‘within-pathway’ models.
Although the tools that accompany S. cerevisiae as a model
system make it ideal for genome-wide analyses of genetic
interactions in a single-celled organism, we wanted to apply
a similar systematic approach towards a global under-
standing of genetic interactions in an animal. There is,
however, no comprehensive collection of mutants, null or
otherwise, in any animal model system. Notwithstanding
this, several features make the nematode worm
Caenorhabditis elegans uniquely suited among animal model
systems to systematically investigate genetic interactions in
a high-throughput manner. First, the worm has only a three-
day life cycle. Second, animals can be easily cultured in
multiwell-plate format, making the preparation of large
numbers of samples economical. Third, around 99.8% of
the individuals within a population are hermaphrodites.
Strains therefore propagate during an experiment without
the need for human intervention. Fourth, genes can be
specifically targeted for reduction-of-function through RNA
interference (RNAi) by feeding [20]. A library of Escherichia
coli strains has been generated in which each strain
expresses double-stranded (ds) RNA whose sequence corres-
ponds to a particular worm gene. Upon ingesting the E. coli,
the dsRNAs are systemically distributed and target a
particular gene for a reduction-of-function by RNAi [21].
RNAi-inducing bacterial strains targeting over 80% of the
8.2 Journal of Biology 2007, Volume 6, Article 8 Byrne et al. />Journal of Biology 2007, 6:8
species, studying these differences may provide insight into the evolution of divergent form
and function.
20,604 protein-coding genes of C. elegans have been
generated [3,22]. Another useful feature of the worm is the
large collection of publicly available mutants representing
most of the conserved pathways that control development
in all animals [23]. Together, these features make C. elegans
a unique whole-animal model to systematically probe
genetic interactions in a high-throughput fashion.
Here, we describe a novel approach towards a global
analysis of genetic interactions in C. elegans. Our approach
is called systematic genetic interaction analysis (SGI) and
relies on targeting one gene by RNAi in a strain that carries a
mutation in a second gene of interest. The SGI approach is
similar in principle to that used by Fraser and colleagues
(Lehner et al. [24]), but with four key differences. First,
Lehner et al. investigated interactions in liquid culture,
whereas we carried out all experiments on the solid agar
substrate commonly used by C. elegans geneticists. Second,
rather than score population growth in a binary manner, we
used a graded scoring scheme to measure population
growth. Third, rather than test all potential interactions in
side-by-side duplicates [24], we performed all experiments
in at least three independent replicates in a blind fashion.
Finally, we used a global analysis of our data to identify
interacting gene pairs in an unbiased fashion. Using SGI
analysis, we identified 1,246 interactions between 461
genes, which is the largest genetic-interaction network
reported to date.
We present several lines of evidence showing that the SGI
network meets or exceeds the quality of other large-scale
interaction datasets. Analysis of the SGI network reveals
new functions for both uncharacterized and previously
characterized genes, as well as new links between well-
studied signal transduction pathways. We integrated the
SGI network with other networks and found that
synthetic genetic interactions typically bridge different
subnetworks, revealing redundancy between functional
modules [18]. Finally, we provide evidence that the
properties of the C. elegans synthetic genetic network are
conserved with S. cerevisiae, but the network connectivity of
the interactions differs between the two systems. Thus, SGI
analysis not only reveals novel gene function, but also
contributes to our understanding of genetic-interaction
networks in an animal model system.
Results
Constructing the SGI network
To better understand how genes regulate animal biology on
a global scale, we systematically tested genetic interactions
between 11 ‘query’ genes (Table 1) and 858 ‘target’ genes
(see Additional data file 1). Ten of the query genes belong
to one of six signaling pathways specific to metazoans,
including the insulin, epidermal growth factor (EGF),
fibroblast growth factor (FGF), Wingless (Wnt), Notch, and
transforming growth factor beta (TGF-β) pathways (see
Table 1). The 11th query gene, clk-2, is a member of the
DNA-damage response (DDR) pathway and is included in
our analysis as an example of a gene not involved in the
transduction of a signal from the plasma membrane. The
858 target genes consist of 372 genes that are probably
involved in signal transduction from the plasma membrane
on the basis of their annotation in Proteome (BIOBASE,
Wolfenbüttel, Germany) [25], and 486 genes from linkage
group III from which new signaling genes might be
identified. We will henceforth refer to these groups of genes
as the ‘signaling targets’ and the ‘LGIII targets’, respectively.
An analysis of the LGIII set suggests that the 486 genes are
random with respect to known functional categories
(p > 0.05) (see Materials and methods and Additional data
file 2). All of the queries were tested against the signaling
targets, and six of the queries, representing five pathways,
were tested against the LGIII targets (see Table 1).
To systematically test for genetic interactions between
query-target pairs, worms harboring a weak loss-of-function
mutation in a query gene were targeted for RNAi-mediated
reduction of function in a second (target) gene by feeding
the appropriate dsRNA [3,20,21]. We estimated the number
of progeny resulting from each query-target combination
and compared the counts to controls (Figure 1, and see
Materials and methods). We expected that if the query and
target interacted, the resulting number of progeny would be
lower than wild-type (N2) worms fed the target RNAi
(control 1) or the query mutant worms fed mock-RNAi
(control 2). Each query-target pair was tested at least in
triplicate on solid agar substrate in 12-well plates. We
estimated the number of resulting progeny in each well over
the course of several days as the progeny matured, and
assigned each well a score from zero to six. For example, wells
containing no progeny received a score of zero, whereas wells
overgrown with progeny were given a score of six.
We developed an unsupervised computational method
based on reproducibility and the nature of the population
scores in order to determine objectively which query-target
pairs interact genetically. We first arrayed the target genes
plus control 1 on one axis, and the query genes plus
control 2 on the other axis to create a matrix of 56,347
scores that included all experimental replicates over several
days. We then identified six different attributes that could
be mined to infer a unique set of genetic interactions from
the matrix. Some of these attributes include the repro-
ducibility of scores among technical replicates, the
consistency of scores over each day of observation, and the
Journal of Biology 2007, Volume 6, Article 8 Byrne et al. 8.3
Journal of Biology 2007, 6:8
difference in the scores between the experimental gene pair
and controls (see Materials and methods). By varying the
selection parameters for each attribute, we identified 51
unique variant sets of interactions or networks (Figure 2a).
To identify the network variant that maximized the number
of likely true positives but minimized the number of likely
false positives, we first identified those interacting pairs
that share the same Gene Ontology (GO) biological
process [26] (see Materials and methods). We calculated
‘recall’ for each variant by dividing the number of co-classi-
fied interacting pairs by the number of all possible co-
classified pairs within the variant. Similarly, we calculated
‘precision’ by dividing the number of co-classified
interacting pairs by the total number of interacting pairs in
the variant. A variant with high recall and low precision is
likely to have good recovery of all possible co-classified
genetic interactions, but its low stringency will result in a
high number of false positives. On the other hand, a
network with low recall and high precision will have a low
number of false positives, but may have a greater number
of false negatives. As is evident from the recall and
precision plot (see Figure 2a), there are several network
variants with high recall and precision values. We
estimated the significance of the extent to which each
variant network links genes in the same GO biological
process using the hypergeometric distribution (see
Materials and methods). Henceforth, we denote p-values
calculated using the hypergeometric distribution with ‘hg’.
The most significant variant contains 656 unique
interactions among 253 genes (p <10
-22
)
hg
and has a
precision and recall of 42% and 16%, respectively. The next
best variant (p <10
-21
)
hg
contains nearly twice as many
interactions (1,246) among 461 genes, and has 10% higher
recall. We chose to restrict all further analysis to the latter
network in order to capture more previously
uncharacterized interactions. We refer to this variant as the
SGI network (Figure 2b, and Additional data file 3). All
656 interactions within the smaller variant are contained
within the SGI network and are hereafter referred to as
‘high confidence SGI interactions’. The SGI network
contains 833 interactions between query genes and
signaling targets (67%), and another 421 between query
genes and LGIII targets (33%). These 1,246 interactions
range in strength from weak to very strong (Additional data
file 4). Each of the 1,246 gene pairs within the SGI network
synthetically interact by a conservative estimate, as the
double gene perturbation phenotype is greater than the
product of the two single gene perturbations (see
Additional data file 5) [14,27]. All of the interactions fell
8.4 Journal of Biology 2007, Volume 6, Article 8 Byrne et al. />Journal of Biology 2007, 6:8
Table 1
A summary of the query genes
Query Null/strong loss-of-function
gene Ortholog (pathway) phenotype(s) Hypomorphic phenotype(s) References
let-756 FGF (FGF) Early larval arrest (s2887) scrawny, Slo (s2613)** [77]
egl-15 FGF receptor (FGF) Early larval arrest (n1456) scrawny, Egl (n1477)** [78]
let-23 EGF receptor (EGF) L1 arrest (mn23) ts Vul, pleotropic (n1045)** [79]
daf-2 Insulin growth factor receptor (insulin) Emb (e979) ts Daf-c (e1370)** [35]
sem-5 GRB-2 (EGF, FGF, insulin) L1 arrest (leaky) (n1619) Egl, Vul (n2019)* [79,80]
sos-1 Guanine-nucleotide exchange factor (EGF, FGF) Emb (s1031) ts Egl, Vul (cs41)* [33]
let-60 RAS (EGF, FGF, insulin, Wingless/Wnt) Mid-larval lethal (leaky) (s1124) Egl, Vul (n2021)* [81,82]
glp-1 Notch receptor (Notch) ts Emb (gp60) ts Emb, Glp, Muv (or178)* [47]
bar-1 β-catenin (Wingless (Wnt)) Mig, Vul, Pvl (ga80)** Mig, Vul, Pvl (mu63) [34]
sma-6 Type I TGF-β receptor (TGF-β) Sma, Mab (wk7) Sma (e1482)* [83]
clk-2 Tel-2p (DNA-damage response) Unknown Slo, Ste, ts Emb (mn159)** [84]
In the second column, ‘ortholog’ refers to the canonical ortholog in yeast, flies, mice, or humans. The pathway to which the ortholog belongs is
in brackets. Third column: if known, the null or strong loss-of-function phenotype is shown. Fourth column: weak loss-of-function
(hypomorphic) phenotypes are shown for representative alleles. Phenotypic acronyms: Emb, embryonic lethal; Daf-c, dauer formation
constitutive; Slo, slow growth; Egl, egg-laying defective; Vul, vulvaless; Glp, germ-line proliferation defects; Muv, multivulva; Mig, cell and/or axon
migration defects; Pvl, protruding vulva; Sma, small body; Mab, male tail abnormal; Ste, sterile; ts, temperature sensitive. The alleles used in this
study are followed by two asterisks if used as a query against both the signaling targets and the LGIII targets, or just a single asterisk if used only
against the signaling targets.
within one interconnected component because each query gene
shared interaction targets with at least one other query gene.
We assessed the reproducibility of SGI interactions by
analyzing reciprocal and technical replicates. Reciprocal
reproducibility was measured by interchanging the method
used to downregulate each member of selected query-target
gene pairs. Interacting query-target pairs were retested by
targeting the query gene by RNAi in the background of a
mutated ‘target’ gene. Six of the queries in our matrix were
also included as RNAi targets, providing 15 gene pairs to
test for reciprocity. All of the 15 gene pairs interacted in one
test, and six (40%) also interacted in the reciprocal test
(Additional data file 6). Reciprocity of 100% is not expected
because mutations and RNAi experiments often differ in
their effects on gene function [3,22,28]. We also measured
the technical reproducibility of the assay. For technical
replicates, 15 of the target genes and six of the query genes
were included in both the signaling and LGIII matrices,
providing replicates for 90 query-target pairs. Of these, eight
are positive and 67 are negative in both sets, yielding a
technical reproducibility of 83% (75/90). Together, these
results demonstrate that SGI interactions are reproducible.
A functional analysis of SGI interactions
All of the query genes included in this study, except clk-2,
are required in signal transduction from the plasma
membrane. clk-2 was included as a query gene in our screen
to gauge the specificity of SGI interactions on a global scale.
We expected that clk-2 would interact with fewer ‘signaling’
targets than would the signaling queries. In addition, we
expected that clk-2 would interact with a similar number of
signaling targets compared to LGIII targets, whereas the
signaling queries would preferentially interact with other
Journal of Biology 2007, Volume 6, Article 8 Byrne et al. 8.5
Journal of Biology 2007, 6:8
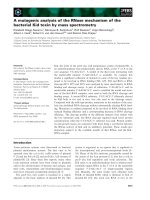
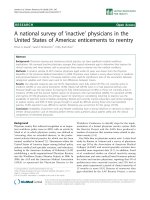
Figure 1
Synthetic genetic-interaction (SGI) analysis in C. elegans. (a) Two scenarios that may result in synthetic interactions are presented. The top row
shows how enhancing interactions may arise when hypomorphic loss-of-function worms (mutant), which have reduced but not eliminated function
of a gene, are fed RNAi that targets another gene in the same essential pathway. The lower row shows synthetic interactions that may arise when
a hypomorph and a gene targeted by RNAi are in parallel pathways that regulate an essential process (X). (b) An outline of the SGI experimental
approach. RNAi-inducing bacteria that target a specific C. elegans gene for knockdown (target gene A) are fed to a hypomorphic mutant (query
gene B). In parallel, wild-type worms are fed the experimental RNAi-inducing bacteria (control 1), and the query mutant is fed mock RNAi-inducing
bacteria (control 2). This is all done in 12-well plate format with at least three technical replicates. Over the course of several days, we estimate
the number of progeny produced in each experimental and control well in a blind fashion (see text and Materials and methods). We assigned a
growth score from 0-6 (0, 2 parental worms; 1, 1-10 progeny; 2, 11-50 progeny; 3, 51-100 progeny; 4, 101-200 progeny; 5, 200+ progeny; and 6,
overgrown). (c) Interacting gene pairs are inferred through a difference in the population growth scores between experimental and control wells.
In the example shown, a global analysis of the experimental and control query-target combinations revealed that daf-2 interacts with ist-1, and that
sem-5 and sos-1 both interact with let-60.
RNAi
RNAi RNAi
RNAi
Slow/no
growth
A
B
C
Y
A
B
C
Y
mutant mutant
mutantmutant
A
B
C
Y
A
B
C
Y
Wild-type
growth
Wild-type
growth
Wild-type
growth
Slow/no
growth
Wild-type
growth
Wild-type
growth
Wild-type
growth
A
B
C
X
Y
D
E
F
A
B
C
X
Y
D
E
F
A
B
C
X
Y
D
E
F
A
B
C
X
Y
D
E
F
6666hus-1
2166let-60
6616ist-1
6666Negative control
sos-1(cs41)
sem-5(n2019)
daf-2(e1370)
wild-type
RNAi
(c)
RNAi-inducing
bacteria
Mutant
worms
(a) (b)
signaling genes. Indeed, we found that clk-2 interacts with
half as many signaling genes compared with the average
signaling query (11.0% versus 21.5%, respectively) and
interacts with the fewest signaling targets overall (Figure 2c).
By contrast, let-60, which encodes the C. elegans ortholog of
the small GTPase Ras, interacts with the greatest number of
8.6 Journal of Biology 2007, Volume 6, Article 8 Byrne et al. />Journal of Biology 2007, 6:8
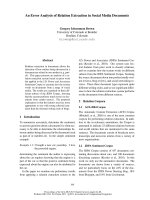
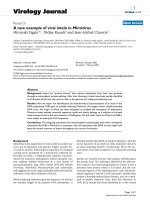
Figure 2
The SGI network. (a) The precision and recall of the 51 unique network variants, as calculated with respect to GO Biological Process annotation
(see Materials and methods). The high-confidence variant is highlighted in pink and the SGI variant in teal. (b) The SGI network contains 1,246
unique synthetic genetic interactions, of which 833 (67%) are between a query gene and a gene in the signaling set, and 413 (33%) are between a
query gene and a gene in the LGIII set. Visualization generated with Cytoscape [85]. (c) The percentage of target interactions per query gene in both
the signaling (dark-blue) and the LGIII (light-blue) networks. The raw number of interacting target genes in each experiment (signaling, LGIII) is
shown below each bar. The error bars represent one standard deviation assuming a binomial distribution.
Recall
Precision
(a) (b)
(c)
daf-2
(78,88)
let-756
(101,87)
bar-1
(85,78)
egl-15
(71,75)
clk-2
(41,53)
let-23
(62,40)
let-60
(109)
sem-5
(92)
sma-6
(81)
glp-1
(76)
sos-1
(46)
Query gene
Target genes (%)
Signaling (n = 372)
LGIII (n = 486)
0 0.1 0.2 0.3 0.4 0.5
daf-2 clk-2
let-23
sos-1
sma-6
let-756
glp-1
sem-5
bar-1
egl-15
let-60
0
0.1
0.2
0.3
0.4
0.5
0
5
10
15
20
25
30
35
signaling targets (29.2%), probably because of the
pleiotropic function of Ras in signal transduction [29]. The
fraction of LGIII targets that interact with signaling queries
is 32% less than the fraction of signaling targets that interact
with signaling queries (14.7% versus 21.5%). By contrast,
the fraction of clk-2 interactions with signaling or LGIII
targets is nearly identical (11.0% versus 10.6%, respectively).
These results further support the validity of the SGI approach.
Next, we exploited the graded scoring scheme used to
collect SGI data to investigate patterns of interactions within
the matrix of genetic-interaction tests. The strength of
interaction between each tested gene pair was calculated
based on the average difference between the experimental
growth scores and the controls. The strength of interaction
for each gene pair was then clustered in two dimensions to
group queries and targets on the basis of similar growth
patterns (see Materials and methods). Clusters of target
genes were then examined for enrichment of shared func-
tional annotation (Additional data file 7 and see Materials
and methods). The resulting clustergram reflects the charac-
terized roles of many genes and provides evidence suppor-
ting previously uncovered relationships (Figure 3a). For
example, the first cluster of target genes is enriched for the
annotation ‘Notch receptor-processing’, and is clustered on
the basis of the phenotype of shared slow growth in a glp-1
mutant background, which has a mutant Notch receptor.
Similarly, a cluster of genes enriched for ‘establishment of
cell polarity’ predominantly interact with bar-1 (encoding a
β-catenin homolog) (cluster J, Figure 3a). Also, a cluster of
genes characterized by the phenotype of slow growth in a
clk-2(mn159) background are enriched for ‘induction of
apoptosis’ (cluster C, Figure 3a). Interestingly, genes in this
group also have a slow-growth phenotype in a sma-6 (type I
TGF-β receptor homolog) background. Although well
characterized in other systems [30], this is the first reported
evidence for a functional link between the TGF-β pathway
and apoptosis in C. elegans. Finally, clusters of target genes
with low growth scores in the background of many of the
query mutants have general annotations such as ‘repro-
duction’ and ‘aging’. This may reflect the involvement of
many signaling pathways in these processes. Within all of
these clusters are previously uncharacterized genes, which
form the basis for numerous hypotheses.
To explore the connectivity between the EGF, FGF, Notch,
insulin, Wnt, and TGF-β signaling pathways, we analyzed
the SGI data in three ways. First, we examined the clusters of
query genes on the clustergram and found some expected
patterns, including the grouping of the genes for the FGF
receptor (egl-15), its ligand (let-756), and their downstream
mediator (let-60/RAS) (Figure 3a). As expected, clk-2 and
glp-1 do not cluster with the receptor tyrosine kinases or
their downstream mediators. By contrast, sma-6 and bar-1/β-
catenin are closely linked, suggesting cooperation between
TGF-β and the Wnt/β-catenin pathways, as previously
reported in other organisms [31]. Second, we investigated
the connectivity between the signaling pathways by creating
a network of query genes (Figure 3b, and Additional data
file 3). Because six of the query mutants were also included
as RNAi targets within the SGI matrix, we tested query pairs
directly for interactions and found 25 interactions among
45 pairs. In addition, we examined the pattern of inter-
actions between each query gene and the entire set of RNAi
targets. Functionally related query genes are expected to
interact with an overlapping set of target genes [11,12,32].
We therefore connected queries within the query network
with a ‘congruent’ link if they shared interactions with the
same targets more frequently than expected by chance
(p <10
-9
)
hg
(see Materials and methods). As expected, the
proximity of query genes to each other in the clustergram is
reflected in the congruent links. Finally, we added links to
the query network derived from other datasets considered
throughout this study. These included protein-protein
interactions, coexpression links, phenotype links, and other
genetic data, all of which are described in detail below. The
resulting query network contains 11 nodes and 33 query-
query interactions, 16 of which are supported by multiple
sources. Of the 24 SGI links within the query network, eight
are supported by other lines of evidence that include
previously described genetic interactions between genes
within defined pathways. Therefore, 16 of the SGI links
represent previously unreported interactions, seven of
which are also supported by congruent links.
Many of the interaction patterns within the query network
are expected. For example, the downstream mediators of
receptor tyrosine kinase signaling (let-60, sem-5 (homolo-
gous to the human gene encoding the adaptor protein
GRB2), and sos-1 (encoding a homolog of the SOS2 adaptor
protein)) have the highest number of links within the query
network (21, 21, and 18 respectively). This pattern is
expected given that almost half of the pathways analyzed
involve receptor tyrosine kinase signaling. Interestingly,
let-60 and sem-5 each interact with all of the query genes but
do not interact with clk-2, suggesting that they are common
mediators of signal transduction. As expected, clk-2 has the
fewest links. We also identified many multiply supported
links between let-23, let-60, sem-5, and sos-1, which are
previously characterized components of the EGF pathway
[29,33]. Furthermore, previously characterized cross-talk
between let-60 and bar-1 [34], and between daf-2 (encoding
the insulin receptor) and sem-5 [35] is supported. The query
network provides the first evidence of genetic interactions
between the FGF gene let-756 and downstream mediators of
the FGF pathway, including the FGF receptor gene egl-15,
Journal of Biology 2007, Volume 6, Article 8 Byrne et al. 8.7
Journal of Biology 2007, 6:8
let-60, sem-5, and sos-1, affirming several previous lines of
evidence [36]. Furthermore, let-756 and egl-15 each interact
with six query genes, five of which are shared between the
two. Finally, the query network reveals novel interactions
between bar-1 and glp-1, between bar-1 and sma-6, and
between bar-1 and multiple components of the FGF and EGF
pathways. Further investigation will be required to elucidate
the precise role of these interactions during development.
A comparison of the SGI network with other
networks
The analysis of large-scale interaction datasets from C. elegans
provided pioneering insights into the nature of metazoan
networks and demonstrated that network principles are
conserved between yeast and worms [37-40]. Using the
1,246 genetic interactions of the SGI network, we asked if
genetic network properties are also conserved. First, we
8.8 Journal of Biology 2007, Volume 6, Article 8 Byrne et al. />Journal of Biology 2007, 6:8
Figure 3
Global patterns of interactions within the SGI network. (a) Two-dimensional clustergram of SGI interactions based on average strength of
interaction. RNAi-targeted genes are represented along the rows and the 11 query hypomorphs across the columns. The shades from black to
yellow on the bottom scale indicate increasing interaction strength, and shades from black to light-blue indicate increasing alleviating interaction
strength. Alleviating interaction strengths indicate that the double reduction-of-function worms grow better than controls. (b) The query network.
Query genes (nodes) are linked in this network if they share a significant number of interaction partners or if there is evidence of a functional
interaction (see text). Edges are colored according to the type of supporting evidence (see text and Materials and methods for more details).
Visualization generated with Cytoscape [85].
A Notch receptor processing (0.00097)
C induction of apoptosis (0.00041)
Legend
−5−4−3−2−1 0 1 2 3 4 5
D
F
R cation channel activity (0.00073)
P
B muscle development (0.00011)
glp-1
clk-2
sma-6
bar-1
let-756
egl-15
let-60
sos-1
daf-2
sem-5
let-23
E nervous system development (0.00041)
G ligand-gated ion channel activity (0.00543)
H development (2.14x10
-17
)
reproduction (1.95x10
-10
)
ribonucleoprotein complex (3.67x10
-12
)
sex differentiation (5.78x10
-7
)
aging (0.00079)
J establishment of cell polarity (0.0032)
transcription initiation (0.00395)
I lipid, fatty-acid and isoprenoid utilization (0.0068)
K purine metabolism (0.0042)
L carbohydrate metabolism (0.00073)
N
O
M molting cycle (0.002)
Q
Coexpression
Lehner genetic interaction
Protein-protein interaction
Query interaction
Fine genetic interaction
SGI genetic interaction
glp-1
sma-6
let-756
egl-15
clk-2
bar-1
let-23
sos-1
let-60
daf-2
sem-5
(a) (b)
found that SGI interactions have properties similar to scale-
free networks: most SGI target genes interact with few query
genes and few target genes interact with many query genes
(Figure 4a). Second, we found that highly connected target
genes, called hubs, within the SGI network are more likely
to result in catastrophic phenotype when knocked-down by
RNAi in a wild-type background compared with less
connected targets (p <10
-47
) (Figure 4b, and see Materials
and methods). Third, we found that the average shortest
path length (2.7 ± 0.8), clustering coefficient (0.3 ± 0.3), and
average degree (5.4 ± 18.6) of the C. elegans genetic network
are indistinguishable from those of the SGA synthetic genetic
network, which has an average shortest path length of
3.3 ± 0.8, a clustering coefficient of 0.1 ± 0.2, and an average
degree of 7.8 ± 16.9 [11,12] (see Materials and methods).
These results demonstrate that the network properties of SGI
are conserved with those of the yeast SGA network.
We next examined how the recall and precision of the SGI
network compared with other large eukaryotic interaction
networks, including a previously described C. elegans genetic-
interaction network (Lehner et al. [24]), a C. elegans protein-
interaction network (Li et al. [37]), a eukaryotic protein-inter-
action network that augments the C. elegans protein-inter-
action network with orthologous interactions from S. cerevisiae,
Drosophila melanogaster, and human protein interactions
contained in BioGRID [41], an mRNA coexpression net-
work constructed from C. elegans, S. cerevisiae, D. melano-
gaster, and human expression data [38,40], an S. cerevisiae
synthetic genetic-interaction network (Tong et al. [12]), and
a network we created based on the similarity of C. elegans
RNAi-induced phenotypes [3,4,22,42] (Figure 4c, and
Materials and methods). We refer to these networks as the
Lehner, Li, interolog, coexpression, Tong, and co-phenotype
networks, respectively. In addition, we examined a network
of fine genetic interactions, which consists of genetic
interactions identified from low-throughput experiments
that were collected from the literature by WormBase [43].
The fine genetic network excludes interactions identified
solely through high-throughput analysis. The SGI network
has an average precision, but a higher recall than all other
datasets examined. We investigated whether the SGI
network has a higher recall because of a preselection of
signaling target genes, but found this not to be true: the
recall of the SGI network remains the highest of all
networks examined when only the LGIII target genes are
considered (recall = 0.23). Together, our analyses suggest
that the SGI approach is at least as proficient as other efforts
that describe interactions on a large scale.
Next, we compared the SGI interactions to those found in
the Lehner genetic-interaction network (Table 2). Of the
6,963 gene pairs tested for interaction by SGI, 1,165 were
also tested by Lehner et al. [24]. Of these, 78.5% do not
interact in either study. Of the 28 pairs found to interact by
Lehner et al., 18 also interact in the SGI network. There are
no obvious differences in the phenotypes of the 18 inter-
acting gene pairs found in both the Lehner and SGI sets,
compared with the 10 pairs found only in the Lehner set
[3]. Overall, SGI identifies 64.3% of Lehner interactions and
there is 98.9% concordance of the negative calls (p<10
-27
).
Of the 1,165 pairs tested by both screens, the SGI approach
identified 222 additional interactions. The gene pairs that
only interact in SGI are as likely to connect genes with
shared GO annotation as are gene pairs that only interact in
the Lehner network, as measured by precisions of 0.66 and
0.60, respectively. These observations suggest that both
approaches can identify genetic interactions with equal
precision, but that SGI captures more interactions.
We extended the comparison between the SGI and Lehner
networks by using previously computed prediction scores
for C. elegans genetic interactions based on characterized
physical interactions, gene expression, phenotypes, and
functional annotation from C. elegans, D. melanogaster, and
S. cerevisiae (Zhong and Sternberg [44]). The probability
scores assigned by Zhong and Sternberg for all pairs of
genes in the SGI network were divided into three categories:
low probability of interaction; intermediate probability of
interaction; and high probability of interaction. We found
roughly twice as many SGI interactions as expected in the
high-probability category and fewer gene pairs than
expected in the low probability of interaction category
(p <10
-25
) (Figure 4d). The ‘high confidence’ SGI inter-
actions have more high probability scores than expected
compared with the whole SGI network (see Figure 2a), and
the SGI interactions with the greatest interaction strengths
(greater than 4.4) have more still. The Lehner genetic
interactions have the greatest number of high-probability
interactions relative to that expected by chance. As Lehner et
al. [24] exclusively scored catastrophic interactions, this
analysis suggests that the Zhong and Sternberg probability
Journal of Biology 2007, Volume 6, Article 8 Byrne et al. 8.9
Journal of Biology 2007, 6:8
Table 2
Comparison of SGI and Lehner genetic interactions
Type of link Number of links*
Tested in SGI and Lehner analyses 1,165
Negative in SGI and Lehner analyses 915 (78.5%)
Positive in SGI and Lehner analyses 18 (1.5%)
Positive only in SGI analysis 222 (19.1%)
Positive only in Lehner analysis 10 (0.85%)
*Percentage of gene pairs tested in both SGI and Lehner analyses.
8.10 Journal of Biology 2007, Volume 6, Article 8 Byrne et al. />Journal of Biology 2007, 6:8
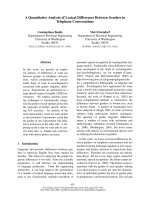
Figure 4
Network properties of SGI and other published datasets. (a) A plot of the percentage of targets (y-axis) that interact with a given number of query
genes (x-axis), illustrating that the SGI network has properties similar to that of scale-free networks. (b) A plot of the percentage of targets that
yield a catastrophic phenotype when targeted by RNAi in a wild-type background [3] (y-axis) as a function of how many query genes they interact
with (degree, x-axis). (c) The precision and recall of interaction networks calculated with respect to GoProcess1000 (see Materials and methods).
Significance values (in brackets) were calculated using the hypergeometric distribution. The source of the networks is presented in the text, except
for the SuperNet (superimposed network, see Materials and methods). The orange dashed line indicates the precision of the fine genetic interactions
extracted from WormBase. The lower dashed line indicates the precision of the interolog network (see Materials and methods). The recall of these
two datasets cannot be calculated, as the number of genes that were tested cannot be ascertained. (d) An independent test of the likelihood of true
interactions among the Lehner [24] and SGI genetic-interaction datasets using the algorithm of Zhong and Sternberg [44], which predicts a
confidence level for a genetic interaction between any given gene pair in C. elegans. The 656 interactions of the ‘high-confidence’ SGI variant, along
with the 229 interactions of the highest interaction strength within the SGI network are also analyzed. Each experimentally derived interacting gene
pair is binned according to the confidence level predicted by Zhong and Sternberg (x-axis): low-, moderate- and high-confidence predictions have
interaction probabilities of 0-0.6, 0.6-0.9, and 0.9-1.0, respectively. The results are plotted as a ratio of the number of experimentally identified
interacting gene pairs to the number of gene pairs expected to be in that bin by chance (y-axis). Expected counts were determined by assuming a
uniform distribution across all bins for all tested gene pairs. Values within each bar show the number of observed gene pairs over the number
expected by chance. The key indicates the data source. Error bars indicate one standard error of the mean.
0 1 2 3 4 5 6 7 8 9 10 11
Targets with catastrophic
phenotype
s
(%
)
01234567891011
eergeDeergeD
Target genes (%)
Signaling
LGIII
Lg III (P<e
-6
)
Tong (P~0)
Lehner (P<e
-24
)
Coexpression (P~0)
0 0.1 0.2 0.3
Recall
Precision
SuperNet (P~0)
Co-phenotype (P~0)
Li (P<e
-20
)
0
1
2
3
4
5
6
7
8
Genetic-interaction probability
Observed/expected links
Lehner
High strength interactions
High-confidence variant
SGI
813
971
390
510
388
247
15
4
26
11
38
21
58
18
271
322
13
2
79
44
hgiHwoLModerate
Signaling (P<e
-9
)
SGI (P<e
-21
)
0
10
20
30
40
50
60
0
20
40
60
80
100
0
0.1
0.2
0.3
0.4
0.5
0.6
0.7
0.8
0.9
1
)b()a(
)d()c(
Fine genetic
Interolog
130
235
127
173
Signaling
LGIII
score not only reflects the likelihood of interaction, but also
the strength of that interaction. Together, our comparison of
SGI interactions to other observed and predicted networks
further supports confidence in SGI interactions.
Genetic interactions are orthogonal to other
interaction datasets
We next asked how worm genetic interactions relate to
other interaction datasets and how this adds to our under-
standing of systems in animals. To do so, we first created a
superimposed network by combining published interaction
data from numerous sources using a method similar to that
used in [45]. We then investigated the patterns of SGI
interactions within it. The superimposed network was
constructed from several large-scale interaction datasets,
including the Li, interolog, Lehner, coexpression, co-pheno-
type, and fine genetic-interaction networks (see above). In
addition, the SGA network [12] was mapped onto C. elegans
orthologs and is referred to as the ‘transposed SGA network’
(see Materials and methods). The links from all of these
networks were combined with the SGI network to form a
single superimposed network.
Altogether, the superimposed network contains 7,825
genes connected by 75,283 links: 43,363 eukaryotic
coexpression links, 2,620 previously reported C. elegans
genetic interactions, 7,527 transposed synthetic genetic
interactions from yeast, 12,796 eukaryotic protein-protein
interactions, 3,967 C. elegans protein-protein interactions,
8,862 co-phenotype links, and 1,246 SGI links (see
Additional data file 3). Only 1.2% of the interactions within
the superimposed network are supported by multiple data
types (Table 3). Concomitantly, there is little overlap
between any genetic-interaction dataset and other modes of
interaction, suggesting that genetic interactions typically
reveal novel relationships between genes.
We next investigated the overlap between genetic inter-
actions and other types of data within the superimposed
network. We found that fine genetic interactions are
supported by far more physical interactions when compared
with SGA interactions (Figure 5), consistent with the idea
that fine genetic interactions are enriched for ‘within-
pathway’ interactions and that SGA interactions are
enriched for ‘between-pathway’ interactions [12,16,19]. We
found that the fraction of SGI and Lehner genetic
interactions supported by physical interactions is indistin-
guishable from the fraction of SGA links supported by
physical interactions (see Figure 5). Similar results were
obtained when the analysis was repeated to measure the
proportion of genetically interacting gene pairs that overlap
with either the coexpression or co-phenotype networks (see
Journal of Biology 2007, Volume 6, Article 8 Byrne et al. 8.11
Journal of Biology 2007, 6:8
Table 3
Composition of the C. elegans superimposed network
Genetically Genetically Physically Coexpression Co-phenotype
Supported supported supported supported supported supported
Network Links Nodes links links (A) links (B) links links links
Superimposed network 75,283 7,825 929 (7.2) NA NA NA NA NA
SGI 1,246 461 63 (2.0) 43 (1.6) 53 (1.8) 9 (5.6) 2 (9.0) 4 (5.9)*
Lehner 341 161 25 (5.5) 13 (10.8) 23 (7.3) 3 (22.7) 1 (17.9) 1 (30.3)
Fine genetic interactions 2,279 1,022 152 (4.6) NA 48 (1.7) 61 (27.8) 23 (36.1) 22 (20.2)
Transposed SGA 7,527 426 66 (2.3) 5 (4.5) 5 (3.2)* 43 (2.2) 14 (3.0) 4 (1.3)*
Interolog 12,796 4,339 723 (9.9) 61 (27.8) 110 (4.8) NA 577 (14.6) 42 (3.9)
C. elegans protein interaction 3,967 2,624 27 (3.7) 7 (10.6) 10 (4.2) NA 13 (3.8) 5 (3.4)*
Eukaryotic coexpression 43,363 5,232 695 (11.8) 23 (36.1) 40 (7.2) 577 (14.6) NA 84 (6.1)
C. elegans co-phenotype 8,862 913 153 (5.2) 22 (20.2) 30 (6.1) 42 (3.9) 84 (6.1) NA
The supported links column gives the number of links supported by other data within the superimposed network. The fold-enrichment over the
average number obtained from 1,000 randomly permuted superimposed networks (representation factor) is given in brackets. Genetically supported
links (A) refers to the number of links supported by fine genetic analysis reported in WormBase (release 170). Genetically supported links (B) refers
to the number of links supported by genetic interactions reported in WormBase (release 170), Lehner et al. [24] or SGI. Physically supported links
refers to the number of links supported by eukaryotic physical interactions (interologs; see text for details). Coexpression-supported links refers to
the number of links supported by eukaryotic mRNA coexpression analysis (see text for details). Co-phenotype-supported links refers to the number
of links supported by C. elegans co-phenotype correlations (see text for details). Unless followed by an asterisk, P-values of the representation factor
< 10
-4
. NA, not applicable.
Figure 5). We therefore conclude that the SGI and Lehner
genetic interactions are probably biased towards between-
pathway interactions, similar to those revealed by SGA.
Next, we examined how SGI interactions contribute to the
connectivity of multiply supported subnetworks (MSSNs)
within the superimposed network (see Materials and
methods). We define MSSNs as highly connected sub-
networks of genes composed of qualitatively different data
types that do not necessarily overlap (Figure 6). MSSNs
may therefore be able to reveal functional modules that
emerge from non-overlapping links. Using one approach,
we found 68 MSSNs in the superimposed network that
may reflect a higher-level organization of gene activity [18],
as 82% are significantly enriched for genes with similar
functional annotation (see Additional data file 8). Through
a second approach (see Materials and methods), we
identified an MSSN that we call the ‘bar-1 module’, which
illustrates how genetic interactions can unite data from
disparate sources to reveal coordinate function (Figure 7a).
bar-1 encodes a β-catenin ortholog that transduces a
Wingless signal [34]. The 21 genes of the bar-1 module are
linked by seven SGI interactions to the bar-1 query gene, 11
fine genetic interactions, 36 co-phenotype links, three
coexpression links, and one protein-protein interaction link.
To further investigate this subnetwork, we targeted all of the
genes within the subnetwork with RNAi in a bar-1(ga80)
mutant background. Of the ten gene pairs within the bar-1
module that were tested for interaction within the original
SGI matrix, nine (90%) retested similarly. An additional
seven new genetic interactions were found within the
module (Table 4). In total, we found that 12 of the 20 RNAi
targets (60%) interacted with bar-1(ga80), which is three
times more than expected compared to bar-1(ga80)
interactions within the SGI matrix (p < 10
-4
)
hg
.
Genes within the bar-1 module linked by co-phenotype
exhibit a pale and scrawny phenotype when targeted by
RNAi [3]. We also found that RNAi-targeted lin-35 and
T20B12.7 exhibit the same pale and scrawny phenotype in a
bar-1(ga80) background. We hypothesized that the pale
phenotype is due to decreased fat production or storage. A
common method for examining fat accumulation in
C. elegans is to incubate worms in Nile Red vital dye, which
stains lipids and readily accumulates within the triglyceride
deposits in the intestine [46]. We therefore targeted each
gene within the subnetwork by RNAi in the presence of Nile
Red and measured the accumulation of Nile Red
8.12 Journal of Biology 2007, Volume 6, Article 8 Byrne et al. />Journal of Biology 2007, 6:8
Figure 5
An analysis of the overlap between genetic interactions and other
modes of interaction. The number of genetically interacting gene pairs
from SGI, Lehner [24], the transposed SGA dataset [12] and low-
throughput ‘fine genetic interactions’ [43] (see text and Materials and
methods) that also interacted through direct protein-protein
interactions (PPI) [37], or were tightly coexpressed (coexpression)
[38,40], or had similar phenotypic profiles (co-phenotype) [3,4,42] (see
Materials and methods) was analyzed (x-axis). Only gene pairs tested in
both relevant datasets are considered here. To account for the
differences and disparity of genes tested in the various screens, the
results are represented as the number of interactions that overlap
between the two datasets as a function of the number of identical or
homologous gene pairs tested in both studies (y-axis). Error bars
indicate one unit of standard deviation assuming a binomial distribution.
PPI Coexpression Co-phenotype
Overlap (%)
SGI
Lehner
Transposed SGA
Fine genetic
0
5
10
15
20
25
Figure 6
A schematic diagram of the construction of a superimposed network.
Networks collected or constructed from various data sources were
combined to create the superimposed network. Nodes represent
genes; edges are colored according to the data type they represent.
Superimposed
network
Coexpression Co-phenotype
Transposed
SGA
Fine
genetic
LehnerSGI
Interolog
Multiply supported
subnetwork
Journal of Biology 2007, Volume 6, Article 8 Byrne et al. 8.13
Journal of Biology 2007, 6:8
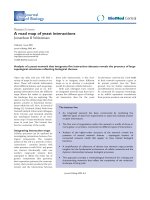
Figure 7
The bar-1 module regulates fat storage and/or metabolism. (a) The ‘bar-1 module’ of 21 genes was identified by virtue of the interconnectedness of
coexpression, co-phenotype, genetic, and protein interactions within the superimposed network. Edges are colored according to the type of
supporting evidence. Genes tested for interaction with bar-1 within the original SGI matrix are indicated (black dot). Visualization generated with
Visant [86]. (b) Fat accumulation and/or storage disruption in the bar-1 module. Genes in the bar-1 module were targeted by RNAi in an N2
background. The resulting worms were stained with Nile Red and staining was quantified in order to compare values to N2 worms fed negative
control RNAi (see Materials and methods). Fifteen of 20 genes show a reduction of Nile Red staining in an N2 background. Values have been
normalized with N2 values for each experiment. Error bars represent standard error of the mean. (c,e) Dark-field micrographs of Nile Red staining
(shows as bright patches) in N2 worms fed either (c) negative control mock-RNAi (Ø RNAi) or (e) RNAi that targets T20B12.7. (d,f) The
corresponding differential interference contrast micrographs are shown below the dark-field micrographs. Scale bar, 50 µm.
bar-1; Ø(RNAi) F2
N2; mrp-5(RNAi) F1
N2; lin-2(RNAi) F2
N2; B0432.3(RNAi) F1
N2; T20B12.7(RNAi) F2
N2; efl-1(RNAi) F2
N2; lin-39(RNAi) F2
N2; C27F2.10(RNAi) F2
N2; lin-35(RNAi) F2
N2; ogt-1(RNAi) F2
N2; prx-5(RNAi) F1
N2; T09A5.5(RNAi) F1
N2; ubc-18(RNAi) F1
N2; lin-23(RNAi) F1
N2; F54C9.6(RNAi) F1
N2; exo-3(RNAi) F1
N2; lin-7(RNAi) F2
N2; T01E8.6(RNAi) F1
N2; Ø(RNAi) F1
N2; Ø(RNAi) F2
N2; Y48E1B.5(RNAi) F1
N2; F29C12.4(RNAi) F1
N2; ZC395.10(RNAi) F2
Genotype
Normalized intensity
Coexpression
Fine genetic
Multiply supported
SGI
Co-phenotype
Interolog
SGI gene
ogt-1
T20B12.7
bar-1
C27F2.10
ZC395.10
exo-3
F54C9.6
prx-5
lin-23
lin-35
efl-1
ubc-18
lin-2
lin-39
lin-7
F29C12.4
Y48E1B.5
mrp-5
B0432.3
T09A5.5
T01E8.6
(a)
(b)
N2; Ø(RNAi) (Nile Red) N2; T20B12.7(RNAi) (Nile Red)
N2; Ø(RNAi) (DIC)
N2; T20B12.7(RNAi) (DIC)
(e)
(f)
(c)
(d)
0
0.2
0.4
0.6
0.8
1
1.2
microscopically (see Materials and methods). Fifteen of the
20 genes targeted gave a phenotype of significant decrease
in Nile Red accumulation in an N2 background
(Figure 7b,c). Five of the nine genes that present the pale
and scrawny phenotype also showed the decrease in Nile
Red staining, suggesting that defects in fat metabolism
and/or accumulation may account for the phenotypes
observed with the transmitted light dissection microscope.
Moreover, 10 of the 11 genes that did not present the pale
phenotype also retained less Nile Red than controls.
Together, these results suggest that the bar-1 module may
regulate fat production or storage. Furthermore, the analysis
of the bar-1 module illustrates how SGI interactions can
reveal coordinated activity between otherwise disparate
genes within the superimposed network.
SGI interactions link distinct functional modules
The topology of the bar-1 module, along with the finding
that SGI interactions are largely orthogonal to other types of
functional links, raised the possibility that synthetic genetic
interactions interconnect, or bridge, functional modules on
a global scale. To investigate this possibility, we first identi-
fied subnetworks within the coexpression, co-phenotype,
and interolog networks that contributed to the super-
imposed network (see Materials and methods). We found
that 162 of the 343 resulting subnetworks (47.2%) are
enriched for shared functional annotation (Additional data
file 9). We then asked if SGI interactions typically fall within
or between subnetworks (Figure 8a). We found 33 sub-
network pairs significantly bridged by SGI links, which is
eightfold more than expected by chance (p <10
-23
) (see
Materials and methods and Additional data file 10). By
contrast, SGI links are significantly under-represented with-
in these subnetworks (p < 0.001)
hg
. An example of a pair of
subnetworks bridged by SGI interactions is shown in
Figure 8b, in which a ‘regulation of body size’ subnetwork is
linked to a ‘formation of primary germline’ subnetwork, as
defined by GO annotation. Interestingly, a ‘negative
regulation of body size’ subnetwork was found to be bridged
to the same ‘formation of primary germline’ subnetwork.
Genes within these subnetworks are known to interact with
one another in other systems and are discussed below.
To further investigate the propensity of SGI interactions to
bridge subnetworks, we relaxed the stringency with which
we identified subnetworks to create ‘broad’ subnetworks
that contain up to hundreds of genes (see Materials and
methods and Additional data file 9). We reasoned that
broad subnetworks are likely to contain genes that belong
to common pathways, complexes, and functional modules.
Interactions that bridge broad subnetworks are therefore
likely to reveal functional redundancy among these compo-
nents. Consistent with the idea that broad subnetworks are
enriched for functional modules, the protein (p < 10
-4
)
hg
,
coexpression (p < 0)
hg
, and co-phenotype (p < 10
-26
)
hg
networks are each significantly enriched for interactions
within broad subnetworks (Additional data file 11). By
contrast, we found that SGI interactions significantly bridge
broad subnetworks (p < 10
-6
)
hg
(Figure 8c). Six hundred and
twelve SGI interactions bridge subnetworks, compared to an
expected 569.6 based on chance. These results further
demonstrate that SGI interactions have the propensity to
8.14 Journal of Biology 2007, Volume 6, Article 8 Byrne et al. />Journal of Biology 2007, 6:8
Table 4
Genetic interactions within the bar-1 module
bar-1-linked bar-1-linked
Target gene (in SGI network) (retest)
C27F2.10 YY
efl-1 NN
lin-2 NN
lin-7 YY
lin-35 YY
lin-39 NN
ogt-1 YW
prx-5 YY
T20B12.7 YY
ZC395.10 YN
bar-1 ND N
B0432.3 ND Y
exo-3 ND N
F29C12.4 ND Y
F54C9.6 ND Y
lin-23 ND N
mrp-5 ND Y
T01E8.6 ND Y
T09A5.5 ND Y
ubc-18 ND N
Y48E1B.5 ND Y
The target genes are the 21 genes of the bar-1 module, including the
bar-1 query. The second column lists the nine interactions between
the targets and the bar-1 query within the bar-1 module that were
tested in the original SGI matrix. Y, an interaction was inferred; N, no
interaction was inferred; ND, gene pair not tested in SGI. In the
retest, all nodes within the bar-1 module were targeted by RNAi in
the background of bar-1(gm80). ogt-1 interacted weakly (W) in the
direct test, and also had weak interaction scores within the original
SGI matrix. We therefore counted ogt-1 as a target that behaved
similarly in both the SGI matrix and the detailed examination of the
bar-1 module.
bridge distinct functional modules. Together, these results
provide the first evidence that functional redundancy may
extend beyond individual gene pairs to a higher level of
organization within the system - the functional module.
The connectivity of the current synthetic-genetic
networks is not conserved between worms and yeast
An important question in systems biology is whether
genetic-interaction networks are evolutionarily conserved
beyond purely network principles. Although only 17% of
the gene pairs tested for a genetic interaction in C. elegans or
S. cerevisiae are orthologous, we devised several approaches
to investigate whether the connectivity of the current yeast
and worm genetic-interaction networks is conserved
(Figure 9). First, a direct comparison of SGI interactions and
SGA interactions revealed no overlap. As there is very little
overlap between the sets of genes tested in both screens, the
significance of this result cannot be determined because of a
Journal of Biology 2007, Volume 6, Article 8 Byrne et al. 8.15
Journal of Biology 2007, 6:8
Figure 8
SGI interactions bridge subnetworks. (a) Three hypothetical subnetworks are depicted. We asked whether SGI interactions are more likely to bridge
subnetworks (left) or fall within subnetworks (right). (b) An example of a bridged subnetwork pair is shown. A ‘regulation of body size’ co-phenotype
subnetwork (green links) is linked to a ‘formation of primary germline’ coexpression subnetwork (blue links) via six SGI interactions (pink links).
Visualization generated with Visant [86]. (c) Broad subnetworks were identified separately within the coexpression (blue), co-phenotype (green), and
interolog (purple) networks (see Materials and methods). All broad subnetworks that are significantly bridged with at least one other broad
subnetwork by SGI interactions (pink edges) are shown. Nodes (black dots) represent individual genes. Visualization generated with Visant [86].
or
Co-phenotype
SGI
Coexpression
Interolog
(a)
(b)
Regulation of body size
(c)
oma-2
pos-1
daf-18
T09B4.1
sip-1
mom-2
mex-5
gln-6
nos-2
cyb-2.1
daf-18
mex-6
oma-1
mex-1
zif-1
puf-5
zhp-3
ima-1
spn-4
F33G12.4
F52B5.2
Y18D10A.11
F08G5.1
T21C9.13
T12G3.6
C17F4.5
F02H6.3
E02H4.6
ZK858.3
ZC53.7
C17E7.9
R04D3.2
R09F10.8
C17E7.4
F08F3.6
C08F8.3
T25E12.5
C50B6.2
F32D1.7
F14D7.2
T05B9.1
T19B10.6
C05C10.5
T05F1.2
K10B2.3
C36B1.11
F30F8.3
W02F12.3
C37C3.9
C25A1.8
C30F12.4
C17E4.3
F14H3.6
Y45F10C.3
Y4C6A.G
nrf-6
r ps-12
dpy-10
aha-1
lin-41
gei-17
gfi-2
sma-6
sma-4
clec-1
nhr-23
unc-44
unc-73
dpy-30
r ps-17
dpy-18
sec-8
blmp-1
D2085.3
Y106G6E.6
K04G2.1
C17E4.9
H04M03.4
Y105E8B.2
Y39G10AR.8
F46F11.9
D1007.5
Y53C12A.4
F27C1.2
F29D11.2
Germline development
lack of statistical power. Second, we compared a compen-
dium of worm genetic interactions (SGI and Lehner et al.
[24] genetic interactions) to a compendium of yeast genetic
interactions (genetic interactions in BioGrid [41] and SGA
interactions [12]). This analysis was restricted to pairs of
worm genes tested by SGI and the Lehner study that have
yeast homologs. We asked whether genes found to interact
in worms were more likely to interact in yeast. Of the gene
pairs that interact in worms, 4.7% (2/43) also interact in
yeast. However, 4.4% (40/916) of all gene pairs tested in
worms also interact in yeast. Thus, an interacting gene pair
in C. elegans is no more likely than any of the tested gene
pairs to interact in S. cerevisiae (chi square test, p > 0.05).
Third, we investigated whether worm and transposed yeast
genetic interactions bridge the same subnetworks. For each
pair of subnetworks, we determined whether there is a
concomitant enrichment of both yeast and worm genetic
bridges over what is expected, on the assumption that the
worm and yeast datasets are independent of one another
(see Materials and methods). We restricted this analysis to
pairs of subnetworks such that one subnetwork contains
genes that have been tested for interaction with genes in the
other subnetwork in both worm and yeast analyses. Of the
274 subnetwork pairs, 27 are significantly bridged by worm
links and 35 are bridged by at least one SGA link. Four of
these pairs are bridged by both worm genetic interactions
and SGA interactions, which is not a significant enrichment
(chi square test, p > 0.05). Fourth, we repeated the afore-
mentioned analysis using broad subnetworks (see above
and Materials and Methods). We found 16 of the 181
possible pairs of broad subnetworks to be bridged by both
worm and yeast genetic links, which is not significantly
different from the 16.6 pairs expected to be bridged by both
types of links by random chance (chi square test, p > 0.05).
We therefore conclude that the connectivity of the current
synthetic genetic-interaction networks is not conserved
between yeast and worms.
Discussion
We developed systematic genetic interaction analysis (SGI)
to identify biologically relevant genetic interactions in a
systematic and high-throughput manner. Through our
unique approach, we were able to extract 3.5-fold more
8.16 Journal of Biology 2007, Volume 6, Article 8 Byrne et al. />Journal of Biology 2007, 6:8
Figure 9
A schematic diagram showing the approaches used to investigate whether synthetic-genetic network connectivity is conserved. In all panels, nodes
represent genes and lines represent interactions. (a) Among pairs of homologous genes tested for interaction in both worm and yeast, we
investigated whether there was significant overlap between worm (pink) and yeast (blue) genetic interactions (left), or few overlapping interactions
(right). (b) After identifying subnetworks (groups of highly interconnected nodes linked by green, purple or light-blue links) within the superimposed
network, we investigated whether worm (pink) and yeast (blue) genetic interactions link the same (left) or different (right) subnetworks.
or
or
Analysis of gene
pairs tested for
interactions in both
worm and yeast
Analysis of
subnetwork bridging
by worm and/or
transposed yeast
interactions
Worm
Yeast
(a)
(b)
interactions than a previous study [24], despite testing 9.2-
fold fewer gene pairs for interaction. The resulting SGI
network of 1,246 interactions is the largest metazoan
genetic network reported to date. Four lines of evidence
support the validity of SGI interactions. First, replicates of
90 query-target pairs were included in both the signaling
and the LGIII matrix, yielding a technical reproducibility of
83%. Second, six of the query genes were also included as
RNAi targets, yielding a reciprocal reproducibility of 40%.
Full reciprocity is not expected because of the varying degree
of gene inactivation in the background of different alleles
and RNAi conditions. Third, of the 1,165 gene pairs
examined in both this study and by Lehner et al. [24], SGI
identified 64% of the 28 interactions found by Lehner et al.,
and there is 98.9% agreement between the negative calls.
Fourth, an independent method of assessing the likelihood
of genetic interactions between gene pairs [44] determined
that the SGI network is enriched for interactions that are
predicted to be true (p < 10
-25
).
Four lines of evidence suggest that the interactions un-
covered by SGI are also biologically meaningful. First, query
genes involved in signal transduction have dramatically
more interactions with signaling targets than with random
targets. By contrast, a query gene involved in an unrelated
process (DNA-damage response) interacts with signaling
and random targets with equal frequency. Second, the SGI
network contains 26% of all gene pairs within the inter-
action test matrix that have similar GO annotation, suggest-
ing that our network is greatly enriched for interactions
between functionally related genes (p < 10
-21
)
hg
. Third, a
cluster analysis reveals many expected patterns within the
query gene network, and between query and target genes.
For example, a glp-1-interacting cluster is enriched for ‘Notch-
receptor processing’ activity [47,48], a sem-5-interacting
cluster is enriched for ‘muscle-development’ activity [49,50],
and a bar-1 interacting cluster is enriched for ‘establishment
of cell polarity’ activity. Finally, genetic interactions between
genes within the bar-1 module predict a common function:
the regulation of fat storage or metabolism. Thus, the
dataset contains biologically meaningful relationships that
can be mined for further insights.
The SGI approach reveals interactions in an
unbiased fashion
The SGI approach facilitates the discovery of interactions
with a wide range of strength and reveals many network
variants from which the most biologically relevant network
can be extracted. Although our chosen SGI network is
significantly enriched with known functional categories, a
number of criteria can be modified to mine SGI data for
more or less stringent interactions. For example, the SGI
variant with the most significant precision and recall (see
Figure 2a) had greater overlap with predicted interactions
than did the larger SGI network (see Figure 4d). With the
SGI approach, tailored sets of genetic interactions can be
revealed that either facilitate detailed biological analysis by
limiting false positives at the expense of some true positives,
or facilitate global network analyses by increasing the
capture rate of true positives at the expense of including
more false positives.
Our chosen SGI network has good recall and precision
when compared to other interaction datasets. As a quality
benchmark of precision, we considered the network of fine
genetic interactions, which is assembled from low-through-
put biological analyses and probably contains few false-
positive interactions. The SGI network has a precision
similar to the network of fine genetic interactions, which
suggests that SGI interactions do not simply represent the
additive perturbation of functionally unrelated genes.
Although much of the precision score of the SGI network is
due to interactions among known signaling components,
the precision of the LGIII network remains significant,
suggesting that more uncharacterized interactions are
uncovered within the LGIII network than within the
signaling network, as expected.
Surprisingly, the SGI network has a higher recall than all of
the other datasets examined. This is not due to the
preselection of signaling targets, as a network created with
random LGIII targets also has a higher recall than the other
datasets. By comparison, the Lehner network [24], which is
similar to our signaling network in that it derives from a
matrix of preselected signaling genes, has much lower recall
than all SGI-related networks. We suspect that the difference
lies in the methodology of identifying interactions: The SGI
approach detects interactions ranging from weak to strong,
while Lehner et al. [24] report only strong interactions.
Restricting analyses to strong interactions evidently neglects
a large proportion of meaningful interactions between
genes known to function within the same biological
process, and must therefore miss interactions between genes
with no previously shared annotation as well.
The integration of genetic interactions into a
superimposed network reveals a new level of
organization
To explore how genetic interactions integrate into the
biological system, we integrated the SGI interactions with
other genetic interactions and with data from the C. elegans
interactome, transcriptome, and phenome into a super-
imposed network. An investigation of the overlap between
SGI and other contributing interactions within the super-
imposed network revealed little overlap. Given that only
approximately 1% of the links in the superimposed network
Journal of Biology 2007, Volume 6, Article 8 Byrne et al. 8.17
Journal of Biology 2007, 6:8
are multiply supported, this is not surprising. The lack of
overlap cannot be attributed solely to the sparseness of
available data in the superimposed network, as both the
coexpression and co-phenotype networks were created from
nearly genome-scale datasets. In addition, the lack of
overlap is unlikely to reflect poor-quality data, as we have
demonstrated that the interactions within the SGI network
and other datasets contain significant numbers of function-
ally related gene pairs. This paradox may suggest that most
high-throughput datasets generated so far have many false
negatives. Alternatively, different interaction modes may
have little real correspondence with one another, and
instead yield complementary information about the system.
In either case, a better understanding of biological systems
may be achieved by investigating the entirety of super-
imposed networks and not just multiply supported links.
Three lines of evidence suggest that multiply supported
subnetworks can help predict the function of uncharacter-
ized genes. First, the subnetworks are significantly enriched
for GO biological processes, suggesting that uncharacterized
genes within the subnetworks may have similar functions.
Second, a detailed examination of the bar-1 module revealed
new genetic interactions that were not tested within the SGI
matrix. Third, a shared role in fat accumulation was
discovered among the genes of the bar-1 module. Of note,
the gene prx-5 of the bar-1 module is required for import
into peroxisomes, which carry out β-oxidation of long-chain
fatty acids, and has previously been identified in a genome-
wide screen for fat-regulatory mutants [51,52]. In humans,
peroxisomal misregulation results in defective lipid meta-
bolism and is associated with diseases such as Zellweger
syndrome [51]. How other components of the bar-1 module
regulate fat will be an interesting avenue for further
investigation. Our data therefore show that the addition of
SGI interactions to other datasets enhances the ability to
predict gene function.
The general lack of overlap between contributing datasets of
the superimposed network, along with the topology of the
bar-1 module, led us to the finding that SGI interactions
bridge different subnetworks. Subnetworks enriched for
particular functions probably work towards a common goal
and may define a higher level of organization within the
cell, such as molecular machines [17] or functional
modules [18]. In one example, SGI interactions with sma-6
bridge a subnetwork enriched for ‘regulation of body size’
genes and a subnetwork enriched for ‘germline develop-
ment’ genes. SMA-6 is an ortholog of type I TGF-β receptors
[53,54]. While sma-6 regulates body size, TGF-β signaling
can also regulate germline proliferation in both C. elegans
and Drosophila [55-57]. Thus, interactions with sma-6
revealed a putative novel redundant function for the two
modules. By overlaying SGI interactions onto a super-
imposed network, we have discovered significant redun-
dancy between functional modules and revealed a new layer
of interactions within a biological system.
The large number of genetic interactions revealed
by SGI is not unexpected
Approximately 18% of the 7,008 gene pairs that we tested
interact genetically. We rationalize this large fraction of
interacting gene pairs uncovered by SGI in four ways. First,
genes within the same local neighborhood on a network
graph are more likely to interact with each other than with
randomly selected targets. For example, in S. cerevisiae,
18-24% of genes linked to the same query gene interact
with each other, compared to the interaction rate of 1% for
the average query [11,12]. Similarly, a majority of the SGI
genetic tests are between genes known or predicted to be
involved in signal transduction; a relatively high number of
interactions may therefore be expected. Second, essential
genes genetically interact with more genes than nonessential
genes. For example, when conditional alleles of essential
yeast genes are used as queries in SGA screens, the fraction
of interactions identified is 5.5-fold more than the number
of interactions with nonessential queries (0.6%) [13]. Of
the 11 query genes investigated in this study, nine are
essential. Thus, by using hypomorphic alleles of genes that
probably teeter on the brink of collapse, and designing an
approach that can reliably detect both strong and weak
interactions, we have created a very sensitive system to
detect genetic interactions. Third, multicellular organisms
may have more vulnerabilities than unicellular organisms.
Each cell type within an animal is likely to be governed by a
system with a distinct set of genetic vulnerabilities that is
different from other cell types. Because compromising the
development or physiology of any one of the major tissue
types will probably kill the animal, the vulnerability of the
entire system is greater than that of any one cell type. This
effect may be further compounded by a complex develop-
mental program. Finally, the total number of anticipated
genetic interactions in C. elegans as revealed by SGI is in the
realm of expectation when compared to that of S. cerevisiae.
On the basis of the fraction of genes that interacted in the
LGIII network (14%), which represents a nearly random set
of genes, we estimate there to be approximately 61 million
genetic interactions in C. elegans that involve an essential
gene. The number of expected genetic interactions in
C. elegans as revealed by SGI analysis is therefore around
120 times that of S. cerevisiae [11-13]. By comparison, the
number of all possible gene pairs in C. elegans is around 11-
fold more than the number of all gene pairs in S. cerevisiae.
Thus, the ratio of expected genetic interactions in worms
compared to yeast is only around 11-fold more than the
respective ratio of all possible gene pairs in both organisms.
8.18 Journal of Biology 2007, Volume 6, Article 8 Byrne et al. />Journal of Biology 2007, 6:8
This difference probably reflects the increase in complexity
of nematodes compared to yeast. By contrast, Lehner et al.
[24] reported an interaction rate of 0.5%. This fraction
would suggest that the ratio of the number of expected
genetic interactions in worms compared to yeast is around
0.4-fold less than the ratio of all possible gene pairs in
worms compared to yeast, which is inconsistent with
expectations. We therefore conclude that the number of
interactions revealed by SGI is not unexpectedly high.
The connectivity of synthetic genetic networks may
not be evolutionarily conserved
Whether the connectivity of genetic interactions is conserved,
rather than just the principles of network biology, remains
an open question. A comparison between the only two
organisms in which genetic interactions have been
systematically investigated - S. cerevisiae and C. elegans -
suggests not. We have evidence against the conservation of
genetic interactions at both the level of individual gene
pairs and at the level of subnetwork connectivity. Our
observations are consistent with a previous report that less
than 1% of around 1,000 yeast interactions are conserved in
C. elegans [58]. How can this be, given that individual genes
[59], homologous physical interactions (interologs), the
essentiality of hubs, and network principles are all clearly
conserved [3,24,37,44,59,60]? There are at least three trivial
explanations for the apparent lack of conservation in the
connectivity of synthetic genetic networks. First, the
different approaches used to uncover interactions may have
led to an artificial difference in the genetic network connec-
tivity within the two systems. Second, synthetic genetic-
interaction analysis in C. elegans has focused on signaling
pathways that are largely absent from S. cerevisiae, hindering
direct comparisons. Third, only a tiny fraction of the
synthetic genetic network has been probed in either system.
An expanded investigation of the networks may yield more
commonalities. Finally, a nontrivial explanation for the
apparent lack of conservation may lie in the nature of
synthetic genetic networks, which overwhelmingly reveal
redundancy between pathways and functional modules as
we show here (see also [16,19]). Thus, perturbations in the
connectivity between modules may change through random
mutation of genes without phenotypic consequence. Over
an evolutionary time scale, synthetic genetic relationships
may therefore drift and/or be selected for or against to
satisfy new constraints during speciation [18,61]. If one
mode of evolution is the shuffling of relationships between
functional modules, then there may be no reason to expect
that the connectivity of genetic networks will be conserved.
Whereas model systems have repeatedly proven their utility
for discovering and understanding basic biological
processes and monogenic diseases, our results suggest that
understanding the complex network of interactions that
underlie polygenic diseases may require network analysis of
systems more closely related to humans. Regardless of this,
a study of the connectivity of synthetic genetic networks
from different species may provide insight into the
evolution of divergent form and function.
Conclusions
We have developed a novel, sensitive, and reproducible
approach called SGI for systematically investigating genetic
interactions in C. elegans. Using this approach, we identified
a network of 1,246 interactions among 461 genes, pro-
viding functional annotation for many poorly characterized
signal transduction genes. When integrated with other
interaction data into a superimposed network, the SGI
interactions help reveal new putative functional modules.
Because genetic links are largely orthogonal to other
interaction modes, SGI data make a significant contribution
to connectivity within the superimposed network. Further-
more, SGI interactions link distinct functional modules on a
global scale, revealing a new level of organization within
the system. Finally, we find that genetic network properties
are conserved between yeast and worms, but the connec-
tivity may not be. Together, our results indicate that a
comprehensive investigation of genetic interactions is critical
to our understanding of the metazoan biological system.
Materials and methods
RNAi feeding assay
Query-target gene pairs were tested for interaction by
feeding target gene RNAi to worms with a mutation in the
query gene. RNAi cultures were grown in 100 µg/ml LB
Amp overnight at 37°C. 40 µl of culture was placed on each
well of 12-well plates containing 3.5 ml NGM [62] supple-
mented with 105.6 µg/ml carbenicillin and 1 mM isopropyl-
beta-
D-thiogalactopyranoside (IPTG). Plates seeded with
bacteria were dried overnight at room temperature and for
40 min in a flow hood. Two stage L3-L4 worms (N2,
egl-15(n1477), let-756(s2613), sos-1(cs41), sem-5(n2019),
let-23(n1045), let-60(n2021), clk-2(mn159), daf-2(e1370),
glp-1(or178), sma-6(e1482), bar-1(ga80)) were placed in
each well of a 12-well plate using a COPAS BioSort worm
sorter (Union Biometrica, Holliston, MA). Worms were
grown at 20°C (egl-15(n1477), let-756(s2613), sos-1(cs41),
sem-5(n2019), let-60(n2021), sma-6(e1482), bar-1(ga80))or
at 16°C (glp-1(or178), let-23(n1045), clk-2(mn159), daf-
2(e1370)). The following controls were grown in each
experiment. As a positive control for RNAi efficiency, wild-
type (N2) worms and the query mutants were fed
pop-1(RNAi). As negative controls for background growth
levels, N2 worms were fed target RNAi and query mutants
were fed L4440 mock-RNAi.
Journal of Biology 2007, Volume 6, Article 8 Byrne et al. 8.19
Journal of Biology 2007, 6:8
Typically, one person can prepare and process experiments
with four worm strains fed 384 RNAi-inducing bacterial
strains in triplicate over the course of two weeks. Over-
lapping sets of experiments of similar size can be prepared
while the worms in the first experiment are growing,
resulting in an average throughput of 1,920 genetic tests per
week per person.
Analysis of the distribution of functional categories
within the LGIII set
Within the LGIII set of genes, there are 203 genes annotated
with at least one GO biological process. These genes repre-
sent 280 unique GO Process 1000 categories. One thousand
samples from the C. elegans genome of 203 genes with at
least one GO biological process were then chosen
randomly. The random set has a mean of 322.5 unique GO
Process 1000 categories with a standard of deviation of
32.8. Compared to the random set, there is no significant
difference in the number of unique GO processes in the
LGIII set (z-score = -1.298; p = 0.097 after Bonferroni
correction). Furthermore, of the 280 unique GO biological
processes in the LGIII set, only 18 are significantly enriched
(p > 0.01) in the LGIII set, and all of these are represented
by only one (12 processes), two (four processes) or three
(two processes) genes (see Additional data file 2).
Scoring query-target interactions
The number of progeny counted in a well that resulted from
each query-target pair and control combination was
counted and recorded as growth scores. A well with no
progeny was given a growth score of zero, whereas a well
overgrown with progeny was given a growth score of six.
Growth scores of 1 to 5 were assigned to wells with
increasing numbers of worms (1, 1-10 progeny; 2, 11-50
progeny; 3, 51-100 progeny; 4, 101-200 progeny; 5, 200+
progeny). From pilot experiments performed by two inde-
pendent investigators, we found that worm populations can
be quickly and reliably binned into these categories. We
took several counts of the same maturing population over
the course of several days. Each query-target pair and its two
controls were tested in at least three rounds. Experiments
suspected of contamination were flagged as suspect and
repeated. Counts obtained in a round were annotated with
confidence scores of 0, 1, or 2, reflecting whether they were
suspect, not suspect, or resulted from a second attempt,
respectively. A large fraction of all experiments was digitally
archived using a high-throughput digital imager [63,64].
Determination of interactions from growth scores
Let G(Q, T,i,j) be the growth score for the (Q,T) query-target
pair on the jth day of round i. For each query-target pair,
two growth score differences were calculated: 1, D
null
(i,j) =
G(Q,null,i,j) - G(Q,T,i,j), the difference between the
experimental population (query mutant; target RNAi) and
the mock RNAi vector control (query mutant; L4440 RNAi);
and 2, D
wt
(i,j) = G(wt,T,i,j) - G(Q,T,i,j), the difference
between the experimental population and the wild-type
control (N2; target RNAi). The following sequential rules
were used to call a (Q,T) pair an interaction:
For round i, its jth day’s counts were called ‘deviant’ if both
D
wt
(i,j) and D
null
(i,j) were at least d.
A round’s set of counts was labeled ‘positive’ if at least e of
its days were found to be deviant (e = 1 or 2) or a majority
of its days were deviant (e = 0).
A (Q,T) pair was then called an interaction if at least s of its
rounds were positive (s = 1 or 2) or a majority of its rounds
were positive (s = 0).
Three additional criteria were used to determine how counts
from suspect rounds were treated:
Suspect rounds were excluded from the analysis if the
confidence score was less than a threshold c (c = 0, 1, or 2).
Counts derived from suspect rounds were removed if a
second attempt was conducted as long as the parameter r
was set; if r was not set, all counts were retained.
Suspect rounds were included to bring the total number of
rounds to a minimum of m (m = 1 or 2).
Generation and comparison of network variants
We applied all combinations of the above criteria to
generate 51 unique network variants. All interacting pairs
within a network variant were query-target pairs that had
satisfied all of the criteria imposed by the variant. For
example, in a variant with the following criteria: d = 3, e = 1,
s = 2, r = 1, c = 0, and m = 2, all query-target pairs that were
called interacting were found in at least two (s = 2) positive
rounds that had at least one deviant day (e = 1), for which
the difference between the growth scores of the experi-
mental population and the control populations was at least
three (d = 3). If any round was considered suspect and the
experiment for that round had been repeated, only growth
scores from the second attempt were used (r = 1). Other-
wise, rounds with all levels of confidence were used (c = 0).
If fewer than two rounds of data were available for a specific
query-target pair, data from additional rounds were included,
so that at least two rounds of data were available, starting
from the most confident rounds (m = 2).
To compare network variants, we identified pairs of genes
within each variant that share a GO biological process
8.20 Journal of Biology 2007, Volume 6, Article 8 Byrne et al. />Journal of Biology 2007, 6:8
classification [26]. Only categories with fewer than 1,000
genes were considered. We calculated ‘recall’ and ‘precision’
for each variant, V, as:
Recall (V) = (number of co-classified interacting pairs in
V)/(number of possible co-classified pairs) and
Precision (V) = (number of co-classified interacting pairs in
V)/(number of interacting pairs in V)
We estimated the significance of the degree to which each
network linked genes in the same GO biological process
category using the hypergeometric distribution. The hyper-
geometric distribution takes into account the number of co-
classified interacting pairs in each variant relative to the size
of the variant, the total number of all possible co-classified
gene pairs, and the total number of gene pairs tested, and is
thus a measure of the significance of both the recall and
precision of a variant.
Clustering of interaction strengths
An interaction strength (IS) was calculated so that target and
query genes could be clustered on the basis of their inter-
action profiles. The IS measures the average difference
between the experimental and control populations of worms.
For interacting pairs, we averaged D
wt
(i,j) and D
null
(i,j) using
only days and rounds passing criteria 3 to 6. For pairs
considered non-interacting, all rounds that passed criteria 4
to 6 were included in the computation. The final interaction
strength for a particular query-target pair was calculated as:
IS = —
1
h
Σ
n
i=1
1(i) —
1
n
i
Σ
n
i
j=1
[
—
1
2
D
wt
(i,j) + —
1
2
D
null
(i,j)
]
where 1(i) was 1 if round i passed the above criteria and
was 0 otherwise, h is the total number of rounds that passed
the criteria, and n
i
is the number of days in round i. IS
represents the average growth score for a query-target pair
calculated over its valid data.
Target and query genes were clustered on the basis of their
interaction strengths. Hierarchical agglomerative clustering
was run using Cluster 3.0 [65,66] on both the target and
query dimensions using average linkage as the cluster
similarity metric and uncentered Pearson correlation as the
IS profile similarity metric, respectively. Individual target
gene clusters were defined by cutting the hierarchical tree at
a height of 0.4. The degree to which each cluster contained
genes assigned to the same gene functional category was
measured using the hypergeometric distribution and a
significance cutoff of P < 0.01.
Gene functional categories
We searched for common functional annotation present in
clusters of genes generated by the hierachical clustering. To
do so, we collected several datasets of gene functional
categories described for C. elegans genes specifically as well
as for predicted C. elegans orthologs from other organisms.
We collected C. elegans gene categories from GO [26]
(downloaded from [67] on 17 January, 2007) and KEGG
[68] (downloaded from [69] on 13 June, 2005). We
restricted GO process categories to those containing 1,000
genes or fewer. Annotations implied by the ‘is-a’ or ‘part-of’
subsumption GO hierarchies were automatically added. We
also collected S. cerevisae gene pathways from MIPS [70]
(downloaded on 12 May, 2002) and H. sapiens gene
pathways from BioCarta [71] (downloaded on 13 June,
2005). For the MIPS and BioCarta datasets, we found the
predicted C. elegans ortholog for each gene in a pathway by
identifying the reciprocal best match protein using the
BLASTP program [72]. All of the categories with their
associated genes can be found in Additional data file 12.
Construction of the query network
Pairs of query genes found to interact with a significantly
similar set of target genes were connected by ‘congruent
links’ as defined by Tong et al. [12] and Ye et al. [32]. The
P-value of the overlap of k target genes of a query gene pair
(A,B) was determined using the hypergeometic distribution:
P(X ≥ k) =
Σ
n
i=k
(
i
K
)(
n – i
N – K
)
—
(
n
N
)
where K is the number of target genes linked to query gene
A, n is the number of target genes linked to query gene B,
and N is the number of tested target genes. A P-value cutoff
of p < 10
-9
yielded a total of 16 congruent links.
Testing the correlation of target hubs with RNAi
phenotype
We tested whether targets with high degree (those linked to
many query genes) have an increased tendency to produce a
strong phenotype when targeted by RNAi compared to
targets with low degree (those linked to few query genes).
The phenotype data of Kamath et al. [3] were used. We
define a strong phenotype as any of the following: Emb
(embryonic lethal), Ste (sterile), Let (lethal), Lva (larval
arrest), Lvl (larval lethal), or Adl (adult lethal). Our null
hypothesis is that the degree of a target gene is not
correlated with strong RNAi phenotypes. Under the null
hypothesis, we expect to find an equal proportion of strong
RNAi phenotypes among targets with any degree. We quanti-
Journal of Biology 2007, Volume 6, Article 8 Byrne et al. 8.21
Journal of Biology 2007, 6:8
fied the difference between the observed and expected
number of target genes with a strong RNAi phenotype for
each degree using a chi-square test with 10 degrees of
freedom (one less than the number of query genes).
Comparing the network properties of the SGI and
SGA genetic networks
To measure topological network properties of the SGI and
yeast SGA genetic-interaction networks, we used the program
tYNA [73] to analyze the variance of the SGI and yeast SGA
network properties. The resulting standard errors of the
mean for the SGI network parameters are reported in the text.
Construction of the co-phenotype network
A co-phenotype network was created by linking genes with
similar loss-of-function phenotypes detected in recently
published high-throughput RNAi screens [3,4,42]. An RNAi
phenotype compendium was assembled by compiling the
results of three genome-wide RNAi studies: 31 phenotypes
scored for 1,472 RNAi from the Kamath et al. [3] dataset; 25
phenotypes scored for 1,486 RNAi from the Simmer et al.
[4] dataset; and 26 phenotypes scored for 1,066 RNAi from
the Rual et al. [42] dataset. Several phenotypic annotations
in the datasets were converted to provide a uniform
terminology that allowed the three datasets to be integrated.
These conversions included labeling brood counts scored as
‘1-5’ and ‘6-10’ as ‘Ste’; relabeling ‘Prz’ as ‘Prl’; relabeling
‘Lvl’ as ‘Let’; and labeling any embryonic lethal percentages
over 10% as ‘Emb.’ In total, 37 phenotypes scored across
2,327 unique RNAi experiments were collected from the
three studies and recorded in a 2,327 x 37 RNAi phenotype
matrix, K. Each entry in the matrix, K
iv
was set to 1 if RNAi
against gene i produced phenotype v in one of the three
studies and was set to 0 otherwise. Each row in the matrix is
referred to as a gene’s RNAi phenotype profile.
We devised a measure of phenotypic similarity motivated
by the uncentered Pearson correlation coefficient (pheno-
typic PCC) approach of Gunsalus et al. [39]. However, we
chose not to use the phenotypic PCC as it can produce false-
positive links between genes with a high correlation that is
based on a single (or even a few) shared common pheno-
type(s) when the two genes fail to produce phenotypes in
all (or many) of the other phenotypes. Inspection of the
compiled RNAi phenotype dataset reveals thousands of
gene pairs that result in such spurious, yet perfect,
correlation. In addition, phenotypic PCC will result in false
negatives due to low correlations between genes that share
several rare phenotypes but that differ in only a few others.
We suggest that a good measure of similarity should give
more weight to rare phenotypes as opposed to common
phenotypes shared between genes because infrequent
phenotypes will co-occur less often in two genes by chance.
Furthermore, the similarity between two genes should
increase if both do not produce a very common phenotype
when genes are targeted by RNAi. We calculated a loss-of-
function agreement score, LOFA, for two genes i and j, that
captures these intuitions, defined as:
LOFA(i,j) = –2
Σ
37
v=1
[K
iv
K
jv
log(f
v
) – (1–K
iv
)(1–K
jv
)log((1–f
v
))]
where f
v
is the frequency of phenotype v across the genome
and K
iv
is the (i,v)th entry from the RNAi phenotype
compendium matrix as described above. If RNAi produces
phenotype v in two genes, the LOFA score is increased by -
log(f
v
). The boost is larger for more infrequent phenotypes.
For example, a phenotype that occurs in 1 out of 100 genes
will increase the score by 2 units, whereas a phenotype that
occurs in 1 out of 10 genes will contribute only 1 unit of
score. The LOFA’s second term gives a bonus to two genes if
they both do not share a common phenotype in an
analogous fashion.
The LOFA and phenotypic PCC measures of similarity were
compared by measuring their ability to predict genes of
related function. For each score, we constructed networks
induced by using a cutoff above which genes were
considered to be functionally related. We first varied the
LOFA score cutoff from high to low, producing 51 networks
of increasing size. Similarly, 51 networks of increasing size
were produced for phenotypic PCC by lowering the
phenotypic PCC cutoff. The precision of each network was
measured by calculating the fraction of linked genes found
to be annotated with a common GO category. Precision
levels were then plotted against the network size. LOFA was
found to be superior to phenotypic PCC for connecting
genes of related function as it produced substantially higher
precision levels than phenotypic PCC for every network size
(Additional data file 13).
A final co-phenotype network was constructed by linking
genes exhibiting significant levels of agreement. The signifi-
cance of the LOFA score was assessed by generating 3
million random LOFA values. We first constructed a random
dataset in which the genes associated with loss-of-function
phenotype v in the RNAi phenotype compendium were
permuted. This was repeated for each phenotype to produce
one permuted dataset from which 100,000 random pairs
were then picked and LOFA was calculated. We repeated
this procedure for 30 different permuted datasets. We found
that a cutoff of 7.0 was equivalent to an estimated
significance level of 0.001, as approximately 100 LOFAs
computed from random datasets exceeded this value on
average in each of the 30 permuted trials.
8.22 Journal of Biology 2007, Volume 6, Article 8 Byrne et al. />Journal of Biology 2007, 6:8
Construction of the transposed SGA network and
the interolog network
We constructed the transposed SGA network of synthetic
genetic interactions from those interactions described in
[12] by mapping each yeast gene to its predicted worm
ortholog(s). Maps were created containing all gene pairs
with BLASTP significance values of p < 10
-30
or better [72].
For interactions between yeast genes with multiple predicted
worm orthologs, transposed interactions were created for all
combinations of predicted orthologs.
The interolog network was created from eukaryotic protein-
protein interactions reported in BioGRID [41]. All inter-
actions assembled from organisms other than C. elegans
were mapped to predicted worm ortholog pairs using
BLASTP with a significance cutoff of p < 10
-30
[72].
Construction of permuted networks
To gauge the significance of various network properties,
1,000 randomly permuted networks were constructed for
each data type. Permuted SGI networks were created by
combining permuted signaling and LGIII networks. A link
in each of these networks associates one query gene with
one RNAi target gene. The permuted SGI networks link each
query gene to a random set of target genes by randomly
picking genes from the entire set of target genes tested in the
screen. The number of target genes linked to each query was
held fixed in the permuted networks to preserve the degree
distribution across query genes. We also created permuted
Lehner et al. [24] networks, yeast SGA networks, and protein-
interaction networks using this method. Permuted co-
expression, co-phenotype, and fine genetic networks were
created by randomly linking genes present in each network.
Random superimposed networks were created by taking the
union of all links from the permuted networks obtained
from the separate data types.
Determination of the significance of the number of
supported links
The significance of the number of supported links (gene
pairs linked by more than one data type) in the super-
imposed network was estimated by comparing the observed
number of supported links to the number of supported
links in 1,000 randomly permuted superimposed networks.
Significance was calculated with a standard Z-score trans-
formation using the mean and standard deviation of the
number of supported links across the random networks.
The significance of the overlap of two data types was
estimated in a similar manner.
Identification of gene subnetworks
We identified subnetworks, defined as small- to medium-
sized groups of possibly overlapping genes, by searching for
densely connected sets of genes in individual networks and
in the superimposed network using MODES [74]. We used
MODES parameter settings such that a subnetwork must
have at least 50% connectivity, cannot overlap any other
subnetwork by more than half of its genes, and must
contain a minimum of four genes.
A connectivity significance score was assigned to each sub-
network based on the number of links connecting each of
its members. The connectivity significance score for a
subnetwork containing n genes was calculated as a standard
Z-score (l - m)/s where l is the observed number of links in
the subnetwork, and m and s are the mean and standard
deviation of the number of links across 1,000 random
collections of n genes.
As a post-processing step, any gene that was not grouped
into a subnetwork by MODES was iteratively considered for
addition to each subnetwork. To achieve this, a hierarchical
clustering merge step was performed on all such genes
across all subnetworks, using the connectivity score as the
basis for a similarity metric. At each step in the clustering,
the gene/subnetwork pair with the largest increase in
connectivity score was combined. The connectivity score
increase was calculated as the subnetwork’s connectivity
score upon addition of the gene minus its connectivity score
before the addition of the gene.
Broad subnetworks were identified in single-data-type
networks using the VxOrd algorithm [40]. VxOrd clusters a
network of genes on a two-dimensional surface using multi-
dimensional scaling [75]. The links between genes are
treated as spring constants and a configuration of the
springs is sought that minimizes the total free energy of the
system. The result is a collection of genes arranged on the
X-Y plane. We partitioned the genes into clusters using the
dense subregions obtained from two-dimensional density
estimation over a grid superimposed on the X-Y plane. We
formed clusters of genes in contiguous regions whose
densities were at least 10% of the maximum density and
matched a minimum area cutoff.
Characterization of multiply supported
subnetworks
Each subnetwork identified in the superimposed network
was inspected to determine which types of data significantly
link its gene members. For each subnetwork, the signifi-
cance of the number of links of a specific data type that
connected two genes within the subnetwork was calculated
using the connectivity significance score (see previous
section). Subnetworks were annotated as enriched for a data
source if the connectivity score had an associated P-value of
0.01 or less.
Journal of Biology 2007, Volume 6, Article 8 Byrne et al. 8.23
Journal of Biology 2007, 6:8
The bar-1 module was identified in a search for multiply-
supported subnetworks within an earlier version of the
superimposed network. The links within the subnetwork
were updated using the same data as reported in the current
subnetwork. This resulted in the addition of two links to the
module: an interolog interaction between efl-1 and lin-35
and a Lehner interaction between ubc-18 and lin-35.
Nile Red analysis
L4 parental worms were placed on NGM plates seeded with
RNAi or mock-RNAi bacteria and 0.015 µg/ml Nile Red. L4
F1 and F2 progeny were analyzed by fluorescence micros-
copy for Nile Red intensity. To quantify Nile Red intensity,
Openlab software (Improvision, Lexington, MA) was used
to calculate mean fluorescence within a measured area as
well as the length of the worm. Nile Red intensity was
calculated as: mean fluorescence x area/length of worm.
Identification of significantly bridged subnetwork pairs
All pairs of subnetworks derived from the coexpression, co-
phenotype, and interolog networks were inspected for
significant bridging by SGI links. An SGI link is considered
to bridge a pair of subnetworks if it connects a gene in one
subnetwork to a gene in another subnetwork. The total
number of bridges was counted for each pair of sub-
networks. The significance of the number of bridges for each
subnetwork pair was then determined with a standard -
Z-score transformation using the mean and standard
deviation of the number of bridges between that subnetwork
pair in 1,000 randomly permuted SGI networks (see
Additional data file 14 for evidence that a normal approxi-
mation in the Z-score transformation is valid). In addition to
a cutoff of P < 0.01, a subnetwork pair was required to have at
least three bridges to be considered significantly bridged.
Estimation of the significance of the number of
bridged subnetwork pairs
We estimated the significance of the number of significantly
bridged subnetwork pairs by comparing to the number of
pairs significantly bridged by permuted SGI networks. Each
of the 1,000 randomly permuted SGI networks was used to
search for significantly bridged subnetwork pairs using the
same method described above for the true SGI network. The
mean and standard deviation of the number of significantly
bridged subnetwork pairs were then calculated across all
permuted networks. The number of subnetwork pairs
significantly bridged by the SGI network was then
compared to these values using a standard Z-score trans-
formation to obtain a single significance value.
Determination of bridging propensities
To measure the propensity for a given data type to bridge
subnetworks more than expected by chance, we restricted
our analysis to all subnetwork-to-subnetwork links (SSLs).
We defined an SSL as a linked gene pair (A,B) in which both
A and B were included in at least one broad subnetwork of
any data type. Over all SSLs we counted the number of
‘supports’, those links in which genes A and B occurred in
the same subnetwork, as well as ‘bridges’, those links in
which A and B occurred in separate subnetworks. Links that
both bridge and support were counted as supports. The
‘bridging fraction’ was then calculated as the total number
of bridges divided by the total number of SSLs. The
observed bridging fraction was calculated using all SSLs in
the network. The expected bridging fraction was calculated
using all SSLs tested in the dataset. To measure the tendency
for a given data type to link across versus within broad
subnetworks, we calculated the ‘bridging propensity’ as the
observed bridging fraction divided by the expected bridging
fraction, minus 1. Positive bridging propensities are indica-
tive of a link type tending to bridge (as opposed to fall
within) broad subnetworks more than expected by chance.
Determination of the degree of subnetwork bridging
conservation
To determine if the same subnetwork pairs were bridged in
worm and yeast, we identified significantly bridged sub-
network pairs separately in each species. We used a
compendium of SGI and Lehner et al. [24] interactions for
worm, and transposed SGA links for yeast. We examined all
pairs of subnetworks and broad subnetworks separately. We
calculated the expected number of bridges as the number of
possible (tested) gene pairs between the subnetworks times
the probability of linking a gene pair for that data type. An
estimate of the probability of a data type linking a gene pair
was calculated as the number of links in its network divided
by the number of possible (tested) links. This yielded an
estimated background probability of 0.039 for worm, and
0.034 for yeast.
To determine the degree of subnetwork bridging conser-
vation among all possible pairs of subnetworks, we created
contingency tables containing the observed and expected
number of subnetwork pairs significantly bridged only in
worm, only in yeast, in both, and in neither. The expected
number of pairs for each of these four categories was then
calculated, assuming independence of worm and yeast
bridging. We first calculated the worm bridging probability,
P
w
(P
y
for yeast), as the number of bridged subnetwork pairs
divided by the total number of pairs, N. The expected
number of subnetwork pairs bridged only in worm was
then calculated as NP
w
(1 - P
y
). Likewise, the expected
number of bridged pairs only in yeast was calculated as
N(1 - P
w
)P
y
. The expected number of bridged pairs in both
species was calculated as NP
w
P
y
. Finally, the expected
number of pairs bridged by neither was N(1 - P
w
)(1 - P
y
).
8.24 Journal of Biology 2007, Volume 6, Article 8 Byrne et al. />Journal of Biology 2007, 6:8
We used a chi-square test with 3 degrees of freedom to
determine if the observed and expected counts for each of
these categories were significantly different.
Additional data files
Additional data are available with this paper online.
Additional data file 1 is a table listing average growth scores
for each query-target pair tested in the SGI analysis.
Additional data file 2 is a table listing the distribution of
functional categories within the LGIII set. Additional data
file 3 is a table listing gene interactions in networks created
for this study. Additional data file 4 is a table with a sorted
list of average interaction strengths for each query-target
pair tested. Additional data file 5 contains a detailed
assessment of the nature of the SGI interactions. Additional
data file 6 is a table listing reciprocal query-query inter-
actions. Additional data file 7 is a clustered table of growth
scores. Gene function descriptions are from WormBase
version 170 [43]. Additional data file 8 is a table listing
multiply supported subnetworks enriched for genes with
similar GO annotations. Additional data file 9 is a table
listing genes and functional annotations for all sub-
networks. Additional data file 10 is a table listing 33
focused subnetwork pairs along with the corresponding
enrichment of SGI links that bridge them. Additional data
file 11 is a table comparing bridging propensities among
high-throughput datasets. Additional data file 12 is a table
listing all functional categories and their associated genes.
Additional data file 13 is a figure plotting precision levels of
networks created using various cutoffs of the LOFA and PCC
scores against network size. All files are also accessible at [76].
Additional data file 14 presents evidence supporting the
validity of using normal approximation of the Z-
transformation to estimate bridging significance.
Acknowledgements
We thank Andrew Spence, Charlie Boone, Gary Bader, Jeff Wrana, and
Brenda Andrews for helpful comments on the work and the manuscript.
We thank Jason Moffat for efforts at the proof-of-principle stage and
thank Theresa Stiernagle and the C. elegans Genetic Center, which is
funded by the NIH National Center for Research Resources, for several
worm strains used in this work. This work was supported by a Can-
adian Institute of Health Research operating grant and infrastructure
awards from the Canadian Foundation for Innovation and Genome
Canada to P.J.R. J.M.S. was supported by a grant from the National
Science Foundation’s Division of Biological Infrastructure DBI-0543197
and by a grant from the Alfred P. Sloan foundation. M.T.W. was sup-
ported by a National Institutes of Health training grant 1 T32
GM070386-01. M.K. was supported by a training grant from the Califor-
nia Institute of Regenerative Medicine.
References
1. Giaever G, Chu AM, Ni L, Connelly C, Riles L, Veronneau S, Dow
S, Lucau-Danila A, Anderson K, Andre B, et al.: Functional pro-
filing of the Saccharomyces cerevisiae genome. Nature 2002,
418:387-391.
2. Hodgkin J: What does a worm want with 20,000 genes?
Genome Biol 2001, 2:comment2008.1-2008.4.
3. Kamath RS, Fraser AG, Dong Y, Poulin G, Durbin R, Gotta M,
Kanapin A, Le Bot N, Moreno S, Sohrmann M, et al.: Systematic
functional analysis of the Caenorhabditis elegans genome
using RNAi. Nature 2003, 421:231-237.
4. Simmer F, Moorman C, van der Linden AM, Kuijk E, van den
Berghe PV, Kamath RS, Fraser AG, Ahringer J, Plasterk RH:
Genome-wide RNAi of C. elegans using the hypersensitive
rrf-3 strain reveals novel gene functions. PLoS Biol 2003, 1:e12.
5. Guarente L: Synthetic enhancement in gene interaction: a
genetic tool come of age. Trends Genet 1993, 9:362-366.
6. Hartman PE, Roth JR: Mechanisms of suppression. Adv Genet
1973, 17:1-105.
7. Ferguson EL, Horvitz HR: The multivulva phenotype of certain
Caenorhabditis elegans mutants results from defects in two
functionally redundant pathways. Genetics 1989, 123:109-121.
8. Gu T, Orita S, Han M: Caenorhabditis elegans SUR-5, a
novel but conserved protein, negatively regulates LET-
60 Ras activity during vulval induction. Mol Cell Biol 1998,
18:4556-4564.
9. Colavita A, Culotti JG: Suppressors of ectopic UNC-5 growth
cone steering identify eight genes involved in axon guid-
ance in Caenorhabditis elegans. Dev Biol 1998, 194:72-85.
10. Davies AG, Spike CA, Shaw JE, Herman RK: Functional overlap
between the mec-8 gene and five sym genes in Caenorhab-
ditis elegans. Genetics 1999, 153:117-134.
11. Tong AH, Evangelista M, Parsons AB, Xu H, Bader GD, Page N,
Robinson M, Raghibizadeh S, Hogue CW, Bussey H, et al.: Sys-
tematic genetic analysis with ordered arrays of yeast dele-
tion mutants. Science 2001, 294:2364-2368.
12. Tong AH, Lesage G, Bader GD, Ding H, Xu H, Xin X, Young J,
Berriz GF, Brost RL, Chang M, et al.: Global mapping of the
yeast genetic interaction network. Science 2004, 303:808-813.
13. Davierwala AP, Haynes J, Li Z, Brost RL, Robinson MD, Yu L,
Mnaimneh S, Ding H, Zhu H, Chen Y, et al.: The synthetic
genetic interaction spectrum of essential genes. Nature
genetics 2005, 37:1147-1152.
14. Schuldiner M, Collins SR, Thompson NJ, Denic V, Bhamidipati A,
Punna T, Ihmels J, Andrews B, Boone C, Greenblatt JF, et al.:
Exploration of the function and organization of the yeast
early secretory pathway through an epistatic miniarray
profile. Cell 2005, 123:507-519.
15. Pan X, Yuan DS, Xiang D, Wang X, Sookhai-Mahadeo S, Bader JS,
Hieter P, Spencer F, Boeke JD: A robust toolkit for functional
profiling of the yeast genome. Mol Cell 2004, 16:487-496.
16. Kelley R, Ideker T: Systematic interpretation of genetic
interactions using protein networks. Nat Biotechnol 2005,
23:561-566.
17. Alberts B: The cell as a collection of protein machines:
preparing the next generation of molecular biologists. Cell
1998, 92:291-294.
18. Hartwell LH, Hopfield JJ, Leibler S, Murray AW: From molecu-
lar to modular cell biology. Nature 1999, 402:C47-C52.
19. Ulitsky I, Shamir R: Pathway redundancy and protein essen-
tiality revealed in the Saccharomyces cerevisiae interaction
networks. Mol Syst Biol 2007, 3:104.
20. Timmons L, Fire A: Specific interference by ingested dsRNA.
Nature 1998, 395:854.
21. Fire A, Xu S, Montgomery MK, Kostas SA, Driver SE, Mello CC:
Potent and specific genetic interference by double-
stranded RNA in Caenorhabditis elegans. Nature 1998, 391:
806-811.
22. Fraser AG, Kamath RS, Zipperlen P, Martinez-Campos M,
Sohrmann M, Ahringer J: Functional genomic analysis of
C. elegans chromosome I by systematic RNA interference.
Nature 2000, 408:325-330.
23. Ruvkun G, Hobert O: The taxonomy of developmental
control in Caenorhabditis elegans. Science 1998, 282:2033-2041.
24. Lehner B, Crombie C, Tischler J, Fortunato A, Fraser AG: Sys-
tematic mapping of genetic interactions in Caenorhabditis
elegans identifies common modifiers of diverse signaling
pathways. Nature Genet 2006, 38:896-903.
Journal of Biology 2007, Volume 6, Article 8 Byrne et al. 8.25
Journal of Biology 2007, 6:8