Báo cáo sinh học: "A Caenorhabditis elegans genetic-interaction map wiggles into view" pot
Bạn đang xem bản rút gọn của tài liệu. Xem và tải ngay bản đầy đủ của tài liệu tại đây (638.96 KB, 6 trang )
Minireview
AA
CCaaeennoorrhhaabbddiittiiss eelleeggaannss
ggeenneettiicc iinntteerraaccttiioonn mmaapp wwiigggglleess iinnttoo vviieeww
Kristin C Gunsalus
Address: Center for Genomics and Systems Biology and Department of Biology, New York University, 1009 Silver Center, 100 Washington
Square East, New York, NY 10003, USA. Email:
One of the enduring challenges in biology is to learn how
the amazing complexity and diversity of life forms arise
from a limited repertoire of heritable factors. To understand
the emergent properties of biological systems, it is necessary
to first map the functional organization of the complex
biological networks that underlie them. Many levels of
function will need to be analyzed systematically to arrive at
this goal. Mapping molecular interactions such as protein-
protein, protein-DNA, and RNA-RNA interactions will help
define structural and regulatory relationships. However,
understanding organizational principles that determine
how different parts of these networks are coordinated will
require uncovering functional dependencies that may not
be reflected in direct physical interactions, for example
between actin- and tubulin-dependent cellular processes
[1]. Large-scale mapping of genetic interactions in model
organisms offers a powerful approach to tackle this
challenge. A recent genetic-interaction study published in
Journal of Biology by Byrne et al. [2], focusing on signaling
pathways of the nematode worm Caenorhabditis elegans,
pushes the envelope of genetic-interaction mapping in a
multicellular organism by developing a novel approach to
defining networks of genetic interactions based on
interaction strength, and integrating these networks with
other dimensions of genome-scale data in order to reveal
global patterns of functional relationships.
UUnnrraavveelliinngg tthhee ffuunnccttiioonnaall oorrggaanniizzaattiioonn ooff bbiioollooggiiccaall
nneettwwoorrkkss
Why is it important to gain a global view of genetic
interactions? One simple reason is to help assign functions
to the many nonessential genes whose in vivo requirements
remain obscure. Genetic and reverse genetic studies in
Saccharomyces cerevisiae [3], C. elegans [4-7], and Drosophila
melanogaster [8] indicate that the majority of genes (around
75-85%) in both single-celled eukaryotes and metazoans
appear to be dispensable for survival; moreover, only about
half of protein-coding genes in yeast [3,9] and about 25%
in the worm [10] give rise on their own to any discernable
phenotype in vivo. However, genetic modifier screens for
enhancement or suppression of specific phenotypes have
been used with great success in model organisms to identify
genes with related functions and to order genes within
pathways involved in numerous biological processes (for a
review see [11]). Many genetic elements identified in this
way give rise to detectable phenotypes only when their
function is compromised in combination with other genetic
loci. In medicine, there is an increasing recognition that the
etiology of many diseases involves multiple genetic factors
that confound simple genotype-phenotype relationships [12].
Characterizing patterns of genetic interactions can also help
us understand how organisms resist or adapt to environ-
AAbbssttrraacctt
Systematic mapping of genetic-interaction networks will provide an essential foundation for
understanding complex genetic disorders, mechanisms of genetic buffering and principles of
robustness and evolvability. A recent study of signaling pathways in
Caenorhabditis elegans
lays
the next row of bricks in this foundation.
BioMed Central
Journal of Biology
2008,
77::
8
Published: 7 March 2008
Journal of Biology
2008,
77::
8 (doi:10.1186/jbiol70)
The electronic version of this article is the complete one and can be
found online at />© 2008 BioMed Central Ltd
mental or genetic variation. Biological networks are
increasingly seen as modular systems [13], in which
coordinated assemblies of components with specialized
functions mediate distinct processes that are, to some
extent, insulated from other parts of the network. Thus
perturbing the activity of a single component is often not
catastrophic; instead, systems find ways to compensate. This
impressive resilience is thought to reflect fundamental
architectural properties of molecular networks that underlie
both the robustness and the adaptability of biological
systems. Robustness refers to the ability of organisms to
maintain phenotypic stability through homeostatic mecha-
nisms that allow them to tolerate fluctuations in environ-
mental conditions or genetic variation [14]. Phenotypic
buffering allows the accumulation of mutations in a
particular genetic background; when buffering mechanisms
break down, this hidden genetic variation may become
expressed. This is famously illustrated by the example of
HSP90 [15] - which when impaired can release striking
morphological diversity in almost any adult structure in the
fly - but may be a more general property of genetic networks
[16]. The release of phenotypic variation has important
implications for evolutionary change [17,18]. Thus, buffer-
ing can both promote homeostasis and foster phenotypic
plasticity under the right conditions. Identifying functional
connections between particular molecules and modules on
a global scale will help us both to learn about explicit
mechanisms and to develop a theoretical framework for
how organisms adjust to variability in external conditions
and internal network states.
IInnssiigghhttss ffrroomm ggeenneettiicc nneettwwoorrkkss iinn yyeeaasstt
The most comprehensive analyses of genetic interactions so
far have been performed in S. cerevisiae. High-throughput
approaches have been developed in yeast to create qualita-
tive and quantitative maps of genetic interactions, including
synthetic sick or lethal (SSL) interactions for essential and
nonessential sets of genes, synthetic dosage suppression or
lethality, and complex haploinsufficient interactions [19].
These techniques are enabled by the generation of strain
libraries with mutations in every gene, allowing large-scale
screening of deletions, conditional or hypomorphic alleles
and inducible overexpression constructs [19]. These
approaches have also been extended to map the sensitivity
of yeast to various chemicals, revealing interactions between
specific genes and environmental perturbations (see, for
example, [20-22]).
The growing body of genetic-interaction studies has greatly
extended our understanding of the functional organization
of biological processes in yeast, in terms of both specific
functional relationships and global properties [19]. For
example, although the SSL and protein-protein interaction
(PPI) maps overlap more than expected by chance (approxi-
mately 13% of within-complex PPIs are SSLs, compared
with 0.5% expected by chance), the number of overlapping
interactions is very small overall (around 1-4% of SSL pairs
are also PPIs), pointing to essential differences in the type of
information that these networks provide about functional
organization within cells [1]. PPIs correspond mainly to
physical complexes and pathways, whereas patterns of SSL
interactions predominantly reveal between-pathway relation-
ships that expose functional links between related cellular
processes; thus genes in the same pathway or complex tend
to share many of the same genetic-interaction partners [1].
This body of data has also stimulated significant interest in
exploring the types of interactions that can be observed
genetically [23] and in defining mathematical models that
should be applied to interpret the results of genetic-
interaction studies [24]. For example, using a ‘min’
definition, in which any phenotype worse than either of the
single mutants is called a genetic interaction, will yield a
different (and much larger) set of interactions than using a
‘product’ rule, in which the phenotype of a double mutant
must be worse than the product of either single mutant
alone [24]. Considering synergistic genetic interactions in
yeast, alternative definitions differ with respect to identi-
fying functional relationships and can lead to different
conclusions regarding the underlying biology [24]. This
issue also has significant implications for the interpretation
of genetic interactions in other organisms.
MMaappppiinngg ggeenneettiicc nneettwwoorrkkss iinn
CC eelleeggaannss
Similar approaches now need to be extended to study
complex interactions in multicellular organisms. As
described in Byrne et al. [2], a collaborative study between
the groups of Peter Roy and Josh Stuart takes a significant
new step in this direction. Although the analysis of genetic
interactions for individual genes of interest has long been a
mainstay of genetics in metazoan model organisms such as
the worm and the fly, large-scale systematic efforts have
lagged far behind those in yeast, mainly because of
technical limitations: comprehensive libraries of deletion
strains do not yet exist, and selecting and analyzing progeny
from the 200 million or so possible mutant crosses using
forward genetic methods is a logistical nightmare. With few
reported exceptions [25], a purely reverse genetic approach
using combinatorial RNA interference (RNAi) to target two
genes simultaneously in the same animal has not met with
great success in most worm labs. However, a hybrid
strategy, in which individual genetic alleles are screened
against a library of genes depleted one at a time by RNAi,
has proved an effective alternative in studies of increasing
8.2
Journal of Biology
2008, Volume 7, Article 8 Gunsalus />Journal of Biology
2008,
77::
8
scale [26-29]. Using a hybrid genetic-RNAi approach, Byrne
et al. [2] report a network of 1,246 genetic interactions
between genetic alleles of 11 ‘query’ genes (primarily
involved in conserved signaling pathways specific to
metazoans) and genes from a library of 858 ‘target’ genes
depleted individually by RNAi. The target gene set was split
between 372 genes likely to be involved in signal
transduction (based on functional annotations) and 486
genes on linkage group III (which may contain new,
previously unidentified signaling targets).
Although the total number of interactions tested was not
significantly larger than several recent studies [27,29-31],
the work by Byrne et al. [2] stands out in its attempt to
provide a more quantitative assessment of the strength of
genetic interactions and in its novel use of a global data-
analysis approach designed to identify interacting pairs in
an unbiased fashion. The experimental design involved
estimating numbers of progeny on solid agar over several
days using a graded scoring scheme in blind triplicate
assays. From these data the authors constructed a large
compendium matrix of 56,347 scores and inferred 51
unique sets of genetic interactions by varying six parameters
(for example, deviation between experimental and control
samples, number of days with an observed deviation and
reproducibility). They then chose two network variants that
corresponded best to shared Gene Ontology (GO) terms
[32]: a ‘high confidence’ variant containing 656 unique
interactions among 253 genes, and a larger variant with
slightly higher recall containing 1,246 interactions among
461 genes.
What lessons did Byrne et al. [2] learn from this study? To
evaluate their results, the authors analyzed their genetic-
interaction networks in a variety of ways, both indepen-
dently and in combination with other datasets. First, they
identified many potential new functional links and
confirmed a number of previously noted links within and
between specific signaling pathways (for example, trans-
forming growth factor β↔Wnt/β-catenin; fibroblast growth
factor ↔ epidermal growth factor). These links provide
many hypotheses for follow-up studies to determine their
potential significance in development. Second, based on
comparisons with a variety of other datasets, Byrne et al.
concluded that their approach resulted in much higher
detection sensitivity than most previous screens, which they
attributed to their ability to detect both strong and weak
interactions and their novel method of identifying
interacting pairs. Third, by overlaying their genetic-
interaction network with protein-protein interactions, co-
expression and co-phenotype data, the authors found that
there is little overlap between datasets, suggesting that the
genetic interactions they identified are revealing novel
functional relationships. Even though the PPI and
phenotype data are still relatively sparse with respect to the
entire genome, and the level of specificity provided by the
phenotype and expression links is limited, this result is
consistent with studies in yeast.
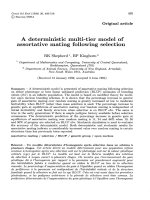
Within the superimposed network, the authors identified
highly connected subnetworks, which in at least one
example revealed a significant enrichment for similar RNAi
phenotypes and previously undocumented genetic
interactions upon retesting. Many of these subnetworks
were enriched for shared functional annotations, and a
significant number were bridged by genetic interactions
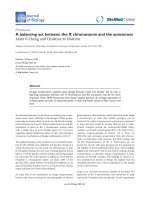
(Figure 1), supporting the idea that genetic interactions
connect different functional modules. This observation is
curious in light of the fact that the final genetic-interaction
/>Journal of Biology
2008, Volume 7, Article 8 Gunsalus 8.3
Journal of Biology
2008,
77::
8
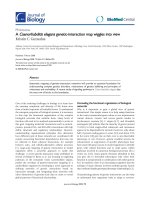
FFiigguurree 11
Adapted from Byrne
et al
. [2], a superimposed network composed of
different types of functional linkages contains subnetworks of genes that
are highly interconnected based on one type of data: coexpression
(blue), co-phenotype (green), or eukaryotic protein-protein
interactions (‘interolog’; purple). Byrne
et al.
found that these
subnetworks were bridged by genetic interactions (pink) more often
than expected by chance. Many such subnetworks were enriched for
genes with shared functional annotations, supporting the idea that
enhancing genetic interactions (identified by reduced function of a pair
of genes) tend to bridge distinct functional modules.
Co-phenotype
SGI
Coexpression
Interolog
network was selected to maximize shared GO terms, and
possibly suggests that this standard may not be the
optimal measure to evaluate the fine structure of
functional relationships within a cell or organism.
Alternatively, refining the functional neighborhoods used
for this analysis (‘broad subnetworks’ based on a single
mode of interaction, such as coexpression, and containing
dozens or hundreds of genes) may provide a higher level
of resolution that would bring these relationships into
better focus. Finally, when the authors compared the
connectivity of yeast [1,33] and worm [2,27] genetic-
interaction networks, they found no significant evidence
for conservation of synthetic genetic interactions between
species. Thus, as in yeast [1], genetic interactions
identified in the worm appear to reveal higher-level inter-
module functional relationships (see Figure 1); however,
the specific patterns of connectivity between modules may
not be evolutionarily conserved.
LLooookkiinngg ttoo tthhee ffuuttuurree
These are very early days for systematic genetic interaction
studies in metazoans, and many questions - both theoretical
and technical - remain unresolved. A notably unglamorous
but important set of technical considerations is that
differences in methodology between different studies in the
same organism will heavily influence both the composition
of reported datasets and conclusions drawn from them.
Chief among these considerations, as illustrated by the 51
network variants identified by Byrne et al. [2] and compari-
sons with results from a similar study by Lehner et al. [27], is
that differences in experimental design, scoring methods and
models used to define genetic interactions [24] will
necessarily result in different sets of reported interactions. It
is not yet clear how to evaluate these differences. Notably,
both Byrne et al. and Lehner et al. achieved high technical
reproducibility (83% and more than 90%, respectively); in
contrast, when genetic alleles and RNAi for query-target pairs
were reversed, only 40% (6/15) of reciprocal tests by Byrne et
al. interacted. This indicates that these screens may be far
from saturation, as RNAi does not always phenocopy genetic
alleles and can carry considerable false-negative rates [34].
Unlike Lehner et al. [27], who placed a lower estimate of
32% on their detection rate for previously reported genetic
interactions (some of which, for example suppressors, would
not be expected to be detected as synthetic lethals), Byrne et
al. [2] did not compare their results with a ‘gold standard’ of
genetic interactions from the literature. Instead, they
evaluated functional cohesion by precision and recall of
shared GO terms, achieving somewhat lower precision but
much higher recall (as well as a higher total number of
interactions) among pairs tested in both studies. This and
other comparisons suggest that the detection methods used
by Lehner et al. [27] were more stringent, resulting in a bias
toward stronger genetic interactions, and that Byrne et al. [2]
cast a much wider net for recovery of genetic interactions.
A further improvement over the semi-quantitative scoring
approach used by Byrne et al. [2], which was based on
binned ranges of estimated survival rates, would be to
precisely measure lethality in these assays. Currently, one of
the biggest technical limitations for large-scale RNAi-based
screens in C. elegans is the lack of efficient high-throughput
methods to quantitate lethality, growth rates, and other
morphological phenotypes, which limits the extent to
which issues surrounding the quantitative definition of
genetic interactions [23,24] can be explored. Over time, as
technical approaches evolve and further large-scale screens
and in-depth studies accumulate, it will be interesting to
revisit these comparisons.
A more profound question is, to what extent will patterns
of genetic interactions be conserved across species?
Answers to this question will inform how we use cross-
species inferences to guide studies in less experimentally
tractable systems. A preliminary comparison between
worm and yeast [2] suggested that, in contrast to PPIs,
there is little conservation of genetic interactions between
these two organisms. This conclusion is clouded, however,
by caveats on several levels. For example, it is not clear if
this comparison considered whether all of the positive
genetic interaction pairs in C. elegans were actually tested in
yeast. Since the set of gene pairs that has been tested differs
substantially between yeast and worm, tests of
conservation should be made only for subsets of gene pairs
that have been systematically tested in both organisms.
More obvious is the dichotomy between unicellular and
multicellular organisms: yeast are directly exposed to the
environment, and must modulate their internal states
accordingly, whereas metazoans comprise many different
cell types with distinct internal states and external contacts.
Measuring survival and growth rates thus provides a
relatively direct readout of cell status in yeast, whereas the
types of phenotypic assay performed in metazoans will
heavily influence our ability to detect different patterns of
genetic interactions. The interpretation of negative results
in whole-animal assays is further complicated by the
possibility - given a particular experimental setup or
phenotypic assay - that two potentially interacting
components may not become limiting in the same cell
types, or that interactions in a subset of cells will not give
rise to obvious organismal phenotypes. Studies of
mammalian and Drosophila cells in culture have begun to
report genome-wide genetic requirements for specific
cellular functions [35,36], but these cannot reveal how
biological systems as a whole adapt to the loss of specific
8.4
Journal of Biology
2008, Volume 7, Article 8 Gunsalus />Journal of Biology
2008,
77::
8
genetic determinants. Thus, the answer to whether genetic-
interaction studies in model systems will provide practical
insights into human biology and disease mechanisms
awaits further studies. Good reason for optimism stems
from the deep conservation of many developmental
signaling pathways and the fact that many human disease
processes can be effectively studied in these models (the fly
and worm, for example, even provide model systems to
study mechanisms underlying Alzheimer’s disease [37]).
What’s next? Extending systematic genetic-interaction maps
to other metazoan systems, including alleviating (suppress-
ing) as well as synthetic (enhancing) interactions, using more
specific high-throughput assays (for example, those that
allow tissue-specific readouts [38]), and developing
quantitative assays, will greatly expand our understanding of
molecular network organization in complex multicellular
organisms. These approaches could also be combined with
chemical genetic profiling, as pioneered in yeast [21,22], to
develop therapeutic strategies based on multiple molecular
targets within the cell. Experimental approaches for mapping
genetic interactions will both inform and be guided by efforts
to generate predictive models for both gene function and
functional associations between genes (for example [39,40]):
the continued accumulation of large unbiased training sets
will help develop better predictive methods, which in turn
will help fill out neighborhoods of interactions and reduce
the combinatorial search space for studies directed at specific
pathways. Finally, it will be interesting to compare the
spectrum of phenotypes and genetic interactions identified in
systematic studies of genetic alleles and RNAi with those
arising from variation in natural populations (for example,
see [41]). Building on knowledge gained from decades of
studying specific genes and pathways, global analysis of
genetic-interaction networks promises to reveal new insights
that will broadly influence our thinking about both
applications to medicine and the relationship between
network architecture and biological function.
AAcckknnoowwlleeddggeemmeennttss
I wish to thank F. Roth, M. Siegal, F. Piano and A. Fernandez for cons-
tructive comments on the manuscript and NIH (HD046236 and
HG004276), US Department of the Army (W23RYX-3275-N605), and
NYSTAR (C040066) for research support.
RReeffeerreenncceess
1. Tong AH, Lesage G, Bader GD, Ding H, Xu H, Xin X, Young J,
Berriz GF, Brost RL, Chang M, Chen Y, Cheng X, Chua G, Friesen H,
Goldberg DS, Haynes J, Humphries C, He G, Hussein S, Ke L,
Krogan N, Li Z, Levinson JN, Lu H, Ménard P, Munyana C, Parsons AB,
Ryan O, Tonikian R, Roberts T,
et al.
:
GGlloobbaall mmaappppiinngg ooff tthhee yyeeaasstt
ggeenneettiicc iinntteerraaccttiioonn nneettwwoorrkk
Science
2004,
330033::
808-813.
2. Byrne AB, Weirauch MT, Wong V, Koeva M, Dixon SJ, Stuart JM,
Roy PJ:
AA gglloobbaall aannaallyyssiiss ooff ggeenneettiicc iinntteerraaccttiioonnss iinn
CCaaeennoorrhhaabbddiittiiss
eelleeggaannss
J Biol
2007,
66::
8.
3. Giaever G, Chu AM, Ni L, Connelly C, Riles L, Véronneau S,
Dow S, Lucau-Danila A, Anderson K, André B, Arkin AP,
Astromoff A, El-Bakkoury M, Bangham R, Benito R, Brachat S,
Campanaro S, Curtiss M, Davis K, Deutschbauer A, Entian KD,
Flaherty P, Foury F, Garfinkel DJ, Gerstein M, Gotte D,
Güldener U, Hegemann JH, Hempel S, Herman Z,
et al.
:
FFuunncc
ttiioonnaall pprrooffiilliinngg ooff tthhee
SSaacccchhaarroommyycceess cceerreevviissiiaaee
ggeennoommee
Nature
2002,
441188::
387-391.
4. Kamath RS, Fraser AG, Dong Y, Poulin G, Durbin R, Gotta M,
Kanapin A, Le Bot N, Moreno S, Sohrmann M, Welchman DP,
Zipperlen P, Ahringer J:
SSyysstteemmaattiicc ffuunnccttiioonnaall aannaallyyssiiss ooff tthhee
CCaaeennoorrhhaabbddiittiiss eelleeggaannss
ggeennoommee uussiinngg RRNNAAii
Nature
2003,
442211::
231-237.
5. Rual JF, Ceron J, Koreth J, Hao T, Nicot AS, Hirozane-Kishikawa T,
Vandenhaute J, Orkin SH, Hill DE, van den Heuvel S, Vidal M:
TToowwaarrdd iimmpprroovviinngg
CCaaeennoorrhhaabbddiittiiss eelleeggaannss
pphheennoommee mmaappppiinngg wwiitthh
aann OORRFFeeoommee bbaasseedd RRNNAAii lliibbrraarryy
Genome Res
2004,
1144::
2162-
2168.
6. Simmer F, Moorman C, van der Linden AM, Kuijk E, van den Berghe PV,
Kamath RS, Fraser AG, Ahringer J, Plasterk RH:
GGeennoommee wwiiddee
RRNNAAii ooff
CC eelleeggaannss
uussiinngg tthhee hhyyppeerrsseennssiittiivvee rrrrff 33 ssttrraaiinn rreevveeaallss
nnoovveell ggeennee ffuunnccttiioonnss
PLoS Biol
2003,
11::
E12.
7. Sönnichsen B, Koski LB, Walsh A, Marschall P, Neumann B, Brehm M,
Alleaume AM, Artelt J, Bettencourt P, Cassin E, Hewitson M, Holz C,
Khan M, Lazik S, Martin C, Nitzsche B, Ruer M, Stamford J, Winzi M,
Heinkel R, Röder M, Finell J, Häntsch H, Jones SJ, Jones M, Piano F,
Gunsalus KC, Oegema K, Gönczy P, Coulson A,
et al.
:
FFuullll ggeennoommee
RRNNAAii pprrooffiilliinngg ooff eeaarrllyy eemmbbrryyooggeenneessiiss iinn
CCaaeennoorrhhaabbddiittiiss eelleeggaannss
Nature
2005,
443344::
462-469.
8. Ashburner M, Misra S, Roote J, Lewis SE, Blazej R, Davis T, Doyle C,
Galle R, George R, Harris N, Hartzell G, Harvey D, Hong L,
Houston K, Hoskins R, Johnson G, Martin C, Moshrefi A, Palazzolo M,
Reese MG, Spradling A, Tsang G, Wan K, Whitelaw K, Kimmel B,
Celniker S, Rubin GM:
AAnn eexxpplloorraattiioonn ooff tthhee sseeqquueennccee ooff aa 22 99 MMbb
rreeggiioonn ooff tthhee ggeennoommee ooff
DDrroossoopphhiillaa mmeellaannooggaasstteerr
:: tthhee AAddhh rreeggiioonn
Genetics
1999,
115533::
179-219.
9. Ohya Y, Sese J, Yukawa M, Sano F, Nakatani Y, Saito TL, Saka A,
Fukuda T, Ishihara S, Oka S, Suzuki G, Watanabe M, Hirata A,
Ohtani M, Sawai H, Fraysse N, Latgé JP, François JM, Aebi M,
Tanaka S, Muramatsu S, Araki H, Sonoike K, Nogami S, Morishita S:
HHiigghh ddiimmeennssiioonnaall aanndd llaarrggee ssccaallee pphheennoottyyppiinngg ooff yyeeaasstt mmuuttaannttss
Proc Natl Acad Sci USA
2005,
110022::
19015-19020.
10. Rogers A, Antoshechkin I, Bieri T, Blasiar D, Bastiani C, Canaran P,
Chan J, Chen WJ, Davis P, Fernandes J, Fiedler TJ, Han M, Harris TW,
Kishore R, Lee R, McKay S, Müller HM, Nakamura C, Ozersky P,
Petcherski A, Schindelman G, Schwarz EM, Spooner W, Tuli MA,
Van Auken K, Wang D, Wang X, Williams G, Yook K, Durbin R,
et al.
:
WWoorrmmBBaassee 22000077
Nucleic Acids Res
2008,
3366((DDaattaabbaassee
iissssuuee))::
D612-D617.
11. Jorgensen EM, Mango SE:
TThhee aarrtt aanndd ddeessiiggnn ooff ggeenneettiicc ssccrreeeennss::
CCaaeennoorrhhaabbddiittiiss eelleeggaannss
Nat Rev Genet
2002,
33::
356-369.
12. Badano JL, Katsanis N:
BBeeyyoonndd MMeennddeell:: aann eevvoollvviinngg vviieeww ooff hhuummaann
ggeenneettiicc ddiisseeaassee ttrraannssmmiissssiioonn
Nat Rev Genet
2002,
33::
779-789.
13. Hartwell LH, Hopfield JJ, Leibler S, Murray AW:
FFrroomm mmoolleeccuullaarr
ttoo mmoodduullaarr cceellll bbiioollooggyy
Nature
1999,
440022::
C47-C52.
14. Hartman JL 4th, Garvik B, Hartwell L:
PPrriinncciipplleess ffoorr tthhee bbuuffffeerriinngg
ooff ggeenneettiicc vvaarriiaattiioonn
Science
2001,
229911::
1001-1004.
15. Rutherford SL, Lindquist S:
HHsspp9900 aass aa ccaappaacciittoorr ffoorr mmoorrpphhoollooggiiccaall
eevvoolluuttiioonn
Nature
1998,
339966::
336-342.
16. Bergman A, Siegal ML:
EEvvoolluuttiioonnaarryy ccaappaacciittaannccee aass aa ggeenneerraall
ffeeaattuurree ooff ccoommpplleexx ggeennee nneettwwoorrkkss
Nature
2003,
442244::
549-552.
17. Rutherford SL:
FFrroomm ggeennoottyyppee ttoo pphheennoottyyppee:: bbuuffffeerriinngg mmeecchhaa
nniissmmss aanndd tthhee ssttoorraaggee ooff ggeenneettiicc iinnffoorrmmaattiioonn
BioEssays
2000,
2222::
1095-1105.
18. Wagner A:
RRoobbuussttnneessss aanndd eevvoollvvaabbiilliittyy:: aa ppaarraaddooxx rreessoollvveedd
Proc
Biol Sci
2008,
227755::
91-100.
19. Boone C, Bussey H, Andrews BJ:
EExxpplloorriinngg ggeenneettiicc iinntteerraaccttiioonnss
aanndd nneettwwoorrkkss wwiitthh yyeeaasstt
Nat Rev Genet
2007,
88::
437-449.
20. Hartman JL 4th, Tippery NP:
SSyysstteemmaattiicc qquuaannttiiffiiccaattiioonn ooff ggeennee
iinntteerraaccttiioonnss bbyy pphheennoottyyppiicc aarrrraayy aannaallyyssiiss
Genome Biol
2004,
55::
R49.
21. Lum PY, Armour CD, Stepaniants SB, Cavet G, Wolf MK, Butler JS,
Hinshaw JC, Garnier P, Prestwich GD, Leonardson A, Garrett-Engele P,
/>Journal of Biology
2008, Volume 7, Article 8 Gunsalus 8.5
Journal of Biology
2008,
77::
8
Rush CM, Bard M, Schimmack G, Phillips JW, Roberts CJ,
Shoemaker DD:
DDiissccoovveerriinngg mmooddeess ooff aaccttiioonn ffoorr tthheerraappeeuuttiicc
ccoommppoouunnddss uussiinngg aa ggeennoommee wwiiddee ssccrreeeenn ooff yyeeaasstt hheetteerroozzyyggootteess
Cell
2004,
111166::
121-137.
22. Parsons AB, Lopez A, Givoni IE, Williams DE, Gray CA, Porter J,
Chua G, Sopko R, Brost RL, Ho CH, Wang J, Ketela T, Brenner C,
Brill JA, Fernandez GE, Lorenz TC, Payne GS, Ishihara S, Ohya Y,
Andrews B, Hughes TR, Frey BJ, Graham TR, Andersen RJ, Boone C:
EExxpplloorriinngg tthhee mmooddee ooff aaccttiioonn ooff bbiiooaaccttiivvee ccoommppoouunnddss bbyy cchheemmiiccaall
ggeenneettiicc pprrooffiilliinngg iinn yyeeaasstt
Cell
2006,
112266::
611-625.
23. Drees BL, Thorsson V, Carter GW, Rives AW, Raymond MZ,
Avila-Campillo I, Shannon P, Galitski T:
DDeerriivvaattiioonn ooff ggeenneettiicc iinntteerr
aaccttiioonn nneettwwoorrkkss ffrroomm qquuaannttiittaattiivvee pphheennoottyyppee ddaattaa
Genome Biol
2005,
66::
R38.
24. Mani R, St Onge RP, Hartman JL 4th, Giaever G, Roth FP:
DDeeffiinniinngg
ggeenneettiicc iinntteerraaccttiioonn
Proc Natl Acad Sci USA
2008,
doi:10.1073/pnas.0712255105
25. Tischler J, Lehner B, Chen N, Fraser AG:
CCoommbbiinnaattoorriiaall RRNNAA
iinntteerrffeerreennccee iinn
CCaaeennoorrhhaabbddiittiiss eelleeggaannss
rreevveeaallss tthhaatt rreedduunnddaannccyy
bbeettwweeeenn ggeennee dduupplliiccaatteess ccaann bbee mmaaiinnttaaiinneedd ffoorr mmoorree tthhaann 8800
mmiilllliioonn yyeeaarrss ooff eevvoolluuttiioonn
Genome Biol
2006,
77::
R69.
26. Baugh LR, Wen JC, Hill AA, Slonim DK, Brown EL, Hunter CP:
SSyynntthheettiicc lleetthhaall aannaallyyssiiss ooff
CCaaeennoorrhhaabbddiittiiss eelleeggaannss
ppoosstteerriioorr
eemmbbrryyoonniicc ppaatttteerrnniinngg ggeenneess iiddeennttiiffiieess ccoonnsseerrvveedd ggeenneettiicc iinntteerraacc
ttiioonnss
Genome Biol
2005,
66::
R45.
27. Lehner B, Crombie C, Tischler J, Fortunato A, Fraser AG:
SSyysstteemm
aattiicc mmaappppiinngg ooff ggeenneettiicc iinntteerraaccttiioonnss iinn
CCaaeennoorrhhaabbddiittiiss eelleeggaannss
iiddeennttiiffiieess ccoommmmoonn mmooddiiffiieerrss ooff ddiivveerrssee ssiiggnnaalliinngg ppaatthhwwaayyss
Nat
Genet
2006,
3388::
896-903.
28. Suzuki Y, Han M:
GGeenneettiicc rreedduunnddaannccyy mmaasskkss ddiivveerrssee ffuunnccttiioonnss ooff
tthhee ttuummoorr ssuupppprreessssoorr ggeennee PPTTEENN dduurriinngg
CC eelleeggaannss
ddeevveellooppmmeenntt
Genes Dev
2006,
2200::
423-428.
29. van Haaften G, Vastenhouw NL, Nollen EA, Plasterk RH, Tijsterman M:
GGeennee iinntteerraaccttiioonnss iinn tthhee DDNNAA ddaammaaggee rreessppoonnssee ppaatthhwwaayy iiddeennttii
ffiieedd bbyy ggeennoommee wwiiddee RRNNAA iinntteerrffeerreennccee aannaallyyssiiss ooff ssyynntthheettiicc lleetthhaall
iittyy
Proc Natl Acad Sci USA
2004,
110011::
12992-12996.
30. Labbé JC, Pacquelet A, Marty T, Gotta M:
AA ggeennoommeewwiiddee ssccrreeeenn
ffoorr ssuupppprreessssoorrss ooff ppaarr 22 uunnccoovveerrss ppootteennttiiaall rreegguullaattoorrss ooff PPAARR
pprrootteeiinn ddeeppeennddeenntt cceellll ppoollaarriittyy iinn
CCaaeennoorrhhaabbddiittiiss eelleeggaannss
Genetics
2006,
117744::
285-295.
31. O’Rourke SM, Dorfman MD, Carter JC, Bowerman B:
DDyynneeiinn
mmooddiiffiieerrss iinn
CC eelleeggaannss
:: lliigghhtt cchhaaiinnss ssuupppprreessss ccoonnddiittiioonnaall hheeaavvyy
cchhaaiinn mmuuttaannttss
PLoS Genet
2007,
33::
e128.
32. Ashburner M, Ball CA, Blake JA, Botstein D, Butler H, Cherry JM,
Davis AP, Dolinski K, Dwight SS, Eppig JT, Harris MA, Hill DP,
Issel-Tarver L, Kasarskis A, Lewis S, Matese JC, Richardson JE,
Ringwald M, Rubin GM, Sherlock G:
GGeennee oonnttoollooggyy:: ttooooll ffoorr tthhee
uunniiffiiccaattiioonn ooff bbiioollooggyy TThhee GGeennee OOnnttoollooggyy CCoonnssoorrttiiuumm
Nat Genet
2000,
2255::
25-29.
33. Breitkreutz BJ, Stark C, Reguly T, Boucher L, Breitkreutz A,
Livstone M, Oughtred R, Lackner DH, Bähler J, Wood V, Dolinski K,
Tyers M:
TThhee BBiiooGGRRIIDD IInntteerraaccttiioonn DDaattaabbaassee:: 22000088 uuppddaattee
Nucleic
Acids Res
2008,
3366::
D637-D640.
34. Fernandez AG, Gunsalus KC, Huang J, Chuang LS, Ying N, Liang HL,
Tang C, Schetter AJ, Zegar C, Rual JF, Hill DE, Reinke V, Vidal M,
Piano F:
NNeeww ggeenneess wwiitthh rroolleess iinn tthhee
CC eelleeggaannss
eemmbbrryyoo rreevveeaalleedd
uussiinngg RRNNAAii ooff oovvaarryy eennrriicchheedd OORRFFeeoommee cclloonneess
Genome Res
2005,
1155::
250-259.
35. Moffat J, Sabatini DM:
BBuuiillddiinngg mmaammmmaalliiaann ssiiggnnaalllliinngg ppaatthhwwaayyss wwiitthh
RRNNAAii ssccrreeeennss
Nat Rev Mol Cell Biol
2006,
77::
177-187.
36. Perrimon N, Mathey-Prevot B:
AApppplliiccaattiioonnss ooff hhiigghh tthhrroouugghhppuutt
RRNNAA iinntteerrffeerreennccee ssccrreeeennss ttoo pprroobblleemmss iinn cceellll aanndd ddeevveellooppmmeennttaall
bbiioollooggyy
Genetics
2007,
117755::
7-16.
37. Link CD:
IInnvveerrtteebbrraattee mmooddeellss ooff AAllzzhheeiimmeerr’’ss ddiisseeaassee
Genes Brain
Behav
2005,
44::
147-156.
38. Ni JQ, Markstein M, Binari R, Pfeiffer B, Liu LP, Villalta C, Booker M,
Perkins L, Perrimon N:
VVeeccttoorr aanndd ppaarraammeetteerrss ffoorr ttaarrggeetteedd ttrraannss
ggeenniicc RRNNAA iinntteerrffeerreennccee iinn
DDrroossoopphhiillaa mmeellaannooggaasstteerr
Nat Methods
2008,
55::
49-51.
39. Lee I, Lehner B, Crombie C, Wong W, Fraser AG, Marcotte EM:
AA ssiinnggllee ggeennee nneettwwoorrkk aaccccuurraatteellyy pprreeddiiccttss pphheennoottyyppiicc eeffffeeccttss ooff
ggeennee ppeerrttuurrbbaattiioonn iinn
CCaaeennoorrhhaabbddiittiiss eelleeggaannss
Nat Genet
2008,
4400::
181-188.
40. Zhong W, Sternberg PW:
GGeennoommee wwiiddee pprreeddiiccttiioonn ooff
CC eelleeggaannss
ggeenneettiicc iinntteerraaccttiioonnss
Science
2006,
331111::
1481-1484.
41. Seidel HS, Rockman MV, Kruglyak L:
WWiiddeesspprreeaadd ggeenneettiicc iinnccoomm
ppaattiibbiilliittyy iinn
CC eelleeggaannss
mmaaiinnttaaiinneedd bbyy bbaallaanncciinngg sseelleeccttiioonn
Science
2008,
331199::
589-594.
8.6
Journal of Biology
2008, Volume 7, Article 8 Gunsalus />Journal of Biology
2008,
77::
8