Báo cáo sinh học: "Genomics technology for assessing soil pollutio" pps
Bạn đang xem bản rút gọn của tài liệu. Xem và tải ngay bản đầy đủ của tài liệu tại đây (796.26 KB, 5 trang )
Minireview
GGeennoommiiccss tteecchhnnoollooggyy ffoorr aasssseessssiinngg ssooiill ppoolllluuttiioonn
Nico M van Straalen and Dick Roelofs
Address: Institute of Ecological Science, VU University, De Boelelaan 1085, 1081 HV Amsterdam, The Netherlands.
Correspondence: Nico M van Straalen. Email:
Modern society emits and discharges many potentially toxic
chemicals to the environment. If chemicals are not degraded
quickly, they tend to accumulate in soils and sediments.
Soil often acts as the ultimate ‘sink’ of environmental
pollution, because clay minerals and humic materials have
a large number of surfaces, chemical groups and organic
particles to which pollutants can attach. Contaminated soils
can pose a problem for society if agricultural functions,
human health or ecological systems are adversely affected.
Soil is also a place of intense biological activity thanks to
degradation of organic matter, recycling of nutrients and
synthesis of humus. The greatest amount of activity is found
in the upper organic layer of the soil. Culture-independent
metagenomics and modeling studies have shown that
biodiversity of soil organisms is much greater than previously
thought, and that the soil harbors many unexplored
functions and is highly sensitive to contamination [1,2].
Contaminants in soil, even if they are potentially toxic, pose
no harm as long as they are firmly bound to the solid phase of
the soil. Only the fraction that is mobile (bioavailable) can
have an impact on organisms. This fraction, often equated
with the fraction that is dissolved or found in pore water, is
highly variable because it depends on many factors and on the
duration of contact between pollutants and soil. Appropriate
risk assessment of contaminants is therefore geared towards
assessing the biological effects of a polluted soil, rather than
the total concentration of contaminant it contains.
It has been suggested that genomics technology, especially
transcription profiling, allows new ways of assessing the
biological effects of environmental pollution [3-7]. The
basic idea is that gene expression is one of the very first
things that will change when an organism is exposed to a
stressful condition. To maintain homeostasis of the internal
environment, the metabolic machinery requires continuous
adjustment to any new situation; gene expression is
expected to reflect these adjustments. A rationale for the use
of transcription profiling in risk assessment of contami-
nated soil is outlined in Figure 1. Because of the potential
advantages, several regulatory authorities are now discus-
sing how genomics tools could fit into the risk assessment
process [8,9]. The US Environmental Protection Agency is
developing new guidance that outlines how genomics may
contribute to a weight-of-evidence approach towards assess-
ing environmental pollution [8].
Transcription profiling as an environmental monitoring
tool seems to have some advantages over traditional
AAbbssttrraacctt
Transcription and metabolite analysis is a powerful way to reveal physiological shifts in
response to environmental pollution. Recent studies on earthworms, including one in
BMC
Biology
, show that the type of pollution and its availability for uptake by organisms can
differentially affect transcription and metabolism.
BioMed Central
Journal of Biology
2008,
77::
19
Published: 14 July 2008
Journal of Biology
2008,
77::
19 (doi:10.1186/jbiol80)
The electronic version of this article is the complete one and can be
found online at />© 2008 BioMed Central Ltd
bioassays that focus on survival, growth and reproduction
of test animals. Three possible benefits have been outlined
[4]. Firstly, specificity: gene expression will be specific to the
type of stress, unlike classical endpoints such as growth and
reproduction. Secondly, sensitivity: gene expression will be
more sensitive, that is, effects can be recognized at lower
exposure concentrations, than classical endpoints. And
thirdly, rapidity: gene expression will respond quickly, in
the order of hours to days, allowing tests that otherwise
could take several weeks.
These claims have not yet been substantiated, certainly not
for soil testing, but several pioneering studies are now
beginning to be published that are creating a basis for
testing these assumptions and evaluating the high expec-
tations raised. A recent study on effects of soil pollution on
earthworms in BMC Biology [10] exemplifies this, and, with
other recent earthworm studies [11-13], shows that trans-
criptome profiles bear a signature of the type of pollution to
which the animal was exposed.
Bundy et al. [10] document effects of copper on the trans-
criptome of the earthworm Lumbricus rubellus. In a promis-
ing new ‘systems toxicology’ approach, they complement
their transcriptome data with metabolomics data and pay
particular attention to alterations in metabolic categories
19.2
Journal of Biology
2008, Volume 7, Article 19 van Straalen and Roelofs />Journal of Biology
2008,
77::
19
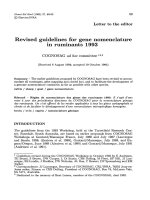
FFiigguurree 11
How a combination of genomics and environmental toxicology can support risk assessment of soil pollution. An indicator species is exposed to a
sample of soil. Traditional soil assessment evaluates soils only on the basis of whole-body endpoints, such as survival, growth and reproduction.
Genomic analysis can add specificity, sensitivity and rapidity, as discussed in the text, and can give more detail of how the contaminants in the soil
affect cellular processes such as signal transduction or DNA damage. In addition, consideration of metabolite patterns (such as the graphs at the
bottom of the figure) can help with the sifting and interpretation of the transcriptional response, as illustrated by recent work on earthworms
[10-13]. ‘Xbase’ refers to bioinformatic analyses.
Sample of suspect soil
Match expression
profiles with
reference, identify
biomarkers
Expose indicator
species to soil sample
Gene expression
and metabolite profiles
•
Soil classification,
certification
• Diagnosis of
pollution
•
Bioavailability
assessment
Xbase
Transcriptional
response
Cell
Damage
Signal
transduction
Organism
Sense organs
CNS
Hormo nes
Toxic contaminant
Toxicity
that are supported by both high-throughput approaches.
This avoids the problems pointed out by Feder and Walsher
[14], who warned against placing too much confidence in
transcriptomic data to predict effects on the phenotype,
because of the long chain of biochemical steps between
gene expression and a change of metabolism. In addition,
there seems to be inherent noise in the transcriptome data,
such that there is often a very poor correlation between
transcriptome and proteome. The reason for this trans-
criptional noise is not clear. Spellmann and Rubin [15]
have pointed out that many genes in Drosophila are expres-
sed in transcriptional territories. Applied to environmen-
tally induced transcriptomes, there could be many genes
that do not respond to the environmental stimulus itself
but are transcribed only because they happen to be in an
active territory.
Interestingly, the paper by Bundy et al. [10] shows that
improved understanding of the transcriptome and metabo-
lome is reached when they are studied jointly; the most
important added value of metabolomics may be to filter
out the noise inherent in gene expression and to select
those gene expression measurements that are consistent
with the metabolome.
Considering the four earthworm papers together [10-13],
there seems to be a good basis for saying that the first
benefit of transcription profiling, specificity, is real. Table 1
shows the general picture emerging from the earthworm
papers. Five chemicals are compared: two heavy metals
(copper and cadmium), a polycyclic aromatic compound
(fluoranthene), a herbicide (atrazine) and an explosive
(trinitrotoluene, TNT). Such a comparison is obviously very
preliminary, as the studies used two different species
(L. rubellus and Eisenia fetida), different exposure conditions
and different platforms (Table 1).
A substantial fraction of an earthworm’s stress-responsive
transcriptome change is found to be induced by all the
compounds. This is true for defense against oxidative stress
and changes in the electron-transport chain (although
oxidative stress seems to be less important in the case of
/>Journal of Biology
2008, Volume 7, Article 19 van Straalen and Roelofs 19.3
Journal of Biology
2008,
77::
19
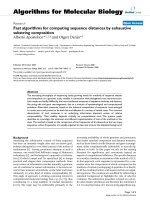
TTaabbllee 11
GGeennee eexxpprreessssiioonn cchhaannggeess sseeeenn iinn eeaarrtthhwwoorrmmss eexxppoosseedd ttoo ffiivvee ddiiffffeerreenntt ssooiill ccoonnttaammiinnaannttss
Copper Cadmium Fluoranthene Atrazine TNT
Species
L. rubellus L. rubellus L. rubellus L. rubellus Eisenia fetida
Exposure time 70 days 28 days 28 days 28 days 28 days
Exposure concentration range (mg/kg) 10-480 13-500 14-533 19-59 2-39
Metabolic category
Detoxification Y Y Y Y
Oxidative stress Y Y Y Y
Mitochondrial electron transport Y Y Y Y Y
Calcium binding and signaling Y Y Y
Iron homeostasis and oxygen transport Y Y Y
Blood coagulation and fibrinolysis Y
Impaired immune function Y Y
Protein damage repair and catabolism Y Y Y
Lipid metabolism Y
Glycolysis and carbohydrate metabolism Y
Cell cycle and apoptosis Y Y
Muscle contraction Y Y
DNA damage and repair Y Y
Neurological dysfunction Y
References [10] [11] [11] [11] [12,13]
Y indicates the broad metabolic categories in which significant changes in gene expression were observed in response to the indicated contaminants.
atrazine). Effects on calcium binding and iron homeostasis
also seem to be part of a general stress response, although
these are less obvious for fluoranthene and atrazine. There
are also transcriptome changes that are more or less specific
to one chemical. For example, strong effects on lipid and
carbohydrate metabolism are reported only for copper, and
effects on blood coagulation, fibrinolysis and neurological
dysfunction are reported only for TNT.
Comparing the compounds, it seems that the two metals,
cadmium and copper, share a considerable part of the
transcription profile, whereas the expression profile of TNT
is more like those of the metals than those of the other
organic compounds, fluoranthene and atrazine. Of course
such comparisons can be done better on a gene-by-gene
basis rather than in terms of broad metabolic categories,
but a sufficiently large database for earthworm toxicity is
not yet available.
The few studies published so far seem to support the
assertion that indeed, soil contaminants induce substance-
specific profiles in earthworms; this supports the specificity
advantage of transcription profiling. This conclusion may
well be restricted to single-chemical exposures, however. In
the study on TNT, when the investigators added another
explosive, 1,3,5-trinitro-1,3,5-triazacyclohexane (RDX), this
radically altered the expression profile of TNT. Although
TNT alone regulated 321 genes, a mixture of TNT and RDX
regulated only three genes. Thus RDX had a strong
antagonistic effect on the TNT-induced expression profile,
the reason for this remains unknown.
The four transcription profiling studies [10-13] were done at
a range of concentrations that did not cause mortality but
had sublethal effects on reproduction. However, clear
evidence for effects on gene expression in the absence of
effects on growth and reproduction has not yet been
documented. It seems that sensitivity might not be the
strongest advantage of transcription profiling.
The third issue, rapidity of testing, could well turn out to be
the greatest advantage of transcription profiling. There are
many situations in which a quick decision on the quality of
a certain soil sample could be of great value, for example
when there are large costs associated with storing or
transport of soil, or when a large number of samples has to
be evaluated. The earthworm studies [10-13] have all
applied rather long exposure conditions (28-70 days). Gene
expression patterns observed after shorter exposure periods,
for example three days, will be different; some genes
regulated during the early phase of an exposure might not
be differentially expressed after several weeks, and vice
versa. Whether short-term gene expression patterns can be
predictive of phenotypic effects after longer exposure
remains an issue for future research.
We have done a short survey among stakeholders in
environmental risk assessment, asking them what they see
as the greatest obstacle for accepting genomics tools in
environmental risk assessment (R. Kloet, D. Roelofs and
N.M. van Straalen, unpublished work). The obvious
outcome was that new tests will always be viewed as
competing with already accepted test methodologies and, to
replace accepted tests, they will need to have a considerable
advantage. On the basis of this result, we feel that it is
advisable to focus genomics tools on test systems that have
already gained international acceptance through, for
example, Organization for Economic Co-operation and
Development (OECD) or International Organization for
Standardization (ISO) guidelines. Then, if genomics tools
are predictive of the outcome in such tests but have an
advantage in terms of specificity, sensitivity or rapidity, this
will help them to gain acceptance in the regulatory arena.
RReeffeerreenncceess
1. Gans J, Wolinsky M, Dunbar J:
CCoommppuuttaattiioonnaall iimmpprroovveemmeennttss
rreevveeaall ggrreeaatt bbaacctteerriiaall ddiivveerrssiittyy aanndd hhiigghh mmeettaall ttooxxiicciittyy iinn ssooiill
Science
2005,
330099::
1387-1390.
2. Daniel R:
TThhee mmeettaaggeennoommiiccss ooff ssooiill
Nature Rev Microbiol
2005,
33::
470-478.
3. Snape JR, Maund SJ, Pickford DB, Hutchinson TH:
EEccoottooxxiiccooggee
nnoommiiccss:: tthhee cchhaalllleennggee ooff iinntteeggrraattiinngg ggeennoommiiccss iinnttoo aaqquuaattiicc aanndd
tteerrrreessttrriiaall eeccoottooxxiiccoollooggyy
Aquat Toxicol
2004,
6677::
143-154.
4. Van Straalen NM, Roelofs D:
An Introduction to Ecological
Genomics.
Oxford: Oxford University Press; 2006.
5. Parro V, Moreno-Paz, M, González-Toril E:
AAnnaallyyssiiss ooff eennvviirroonn
mmeennttaall ttrraannssccrriippttoommeess bbyy DDNNAA mmiiccrrooaarrrraayyss
Environ Microbiol
2006,
99::
453-464.
6. Robbens J, van der Ven K, Maras M, Blust R, De Coen W:
EEccoo
ttooxxiiccoollooggiiccaall rriisskk aasssseessssmmeenntt uussiinngg DDNNAA cchhiippss aanndd cceelllluullaarr
rreeppoorrtteerrss
Trends Biotechnol
2007,
2255::
460-466.
7. Roelofs D, Aarts MGM, Schat H, Van Straalen NM:
FFuunnccttiioonnaall eeccoo
llooggiiccaall ggeennoommiiccss ttoo ddeemmoonnssttrraattee ggeenneerraall aanndd ssppeecciiffiicc rreessppoonnsseess ttoo
aabbiioottiicc ssttrreessss
Funct Ecol
2008,
2222::
8-18.
8. Dix DJ, Gallagher K, Benson WH, Groskinsky BL, McClintock JT,
Dearfield KL, Farland WH:
AA ffrraammeewwoorrkk ffoorr tthhee uussee ooff ggeennoommiiccss
ddaattaa aatt tthhee EEPPAA
Nature Biotech
2006,
2244::
1108-1111.
9. Ankley GT, Daston GP, Degitz SJ, Denslow ND, Hoke RA,
Kennedy SW, Miracle AL, Perkins EJ, Snape J, Tillit DE, Tyler CR,
Versteeg D:
TTooxxiiccooggeennoommiiccss iinn rreegguullaattoorryy eeccoottooxxiiccoollooggyy
Environ
Sci Technol
2006,
4400::
4055-4065.
10. Bundy JG, Sidhu JK, Rana F, Spurgeon DJ, Svendsen C, Wren JF,
Stürzenbaum SR, Morgan AJ, Kille P:
““SSyysstteemmss ttooxxiiccoollooggyy””
aapppprrooaacchh iiddeennttiiffiieess ccoooorrddiinnaatteedd mmeettaabboolliicc rreessppoonnsseess ttoo ccooppppeerr iinn
aa tteerrr
reessttrriiaall nnoonn mmooddeell iinnvveerrtteebbrraattee,, tthhee eeaarrtthhwwoorrmm
LLuummbbrriiccuuss
rruubbeelllluuss
BMC Biol
2008,
66::
25.
11. Owen J, Hedley BA, Svendsen C, Wren JF, Jonker MJ,
Hankard PK, Lister LJ, Stürzenbaum SR, Morgan AJ, Spurgeon
DJ, Blaxter ML, Kille P:
TTrraannssccrriippttoommee pprrooffiilliinngg ooff ddeevveelloopp
mmeennttaall aanndd xxeennoobbiioottiicc rreessppoonnsseess iinn aa kkeeyyssttoonnee aanniimmaall,, tthhe
e
oolliiggoocchhaaeettee aannnneelliidd
LLuummbbrriiccuuss rruubbeelllluuss
BMC Genomics
2008,
99::
266.
12. Gong P, Guan X, Inouye LS, Pirooznia M, Indest KJ, Athow RS,
Deng Y, Perkins EJ:
TTooxxiiccooggeennoommiicc aannaallyyssiiss pprroovviiddeess nneeww iinnssiigghhttss
iinnttoo mmoolleeccuullaarr mmeecchhaanniissmmss ooff 22,,44,,66 ttrriinniittrroottoolluueennee iinn
EEiisseenniiaa
ffeettiiddaa
Environ Sci Technol
2007,
4411::
8195-8202.
19.4
Journal of Biology
2008, Volume 7, Article 19 van Straalen and Roelofs />Journal of Biology
2008,
77::
19
13. Gong P, Guan X, Inouye LS, Deng Y, Pirooznia M, Perkins EJ
::
TTrraannssccrriippttoommiicc aannaallyyssiiss ooff RRDDXX aanndd TTNNTT iinntteerraaccttiivvee ssuubblleetthhaall
eeffffeeccttss iinn tthhee eeaarrtthhwwoorrmm
EEiisseenniiaa ffeettiiddaa
BMC Genomics
2008,
99((SSuuppppll 11))::
S15.
14. Feder ME, Walser JC:
TThhee bbiioollooggiiccaall lliimmiittaattiioonnss ooff ttrraannssccrriippttoommiiccss iinn
eelluucciiddaattiinngg ssttrreessss aanndd ssttrreessss rreessppoonnsseess
J Evol Biol
2005,
1188::
901-910.
15. Spellman PT, Rubin GM:
EEvviiddeennccee ffoorr llaarrggee ddoommaaiinnss ooff ssiimmiillaarrllyy
eexxpprreesssseedd ggeenneess iinn tthhee
DDrroossoopphhiillaa
ggeennoommee
J Biol
2002,
11::
5.
/>Journal of Biology
2008, Volume 7, Article 19 van Straalen and Roelofs 19.5
Journal of Biology
2008,
77::
19