Experimental Business Research II springer 2005 phần 7 pps
Bạn đang xem bản rút gọn của tài liệu. Xem và tải ngay bản đầy đủ của tài liệu tại đây (478.59 KB, 32 trang )
1
5
4Ex
p
erimental Business Research Vol. II
H1: Emp
l
oyees pre
f
er
b
onus contracts to econom
i
ca
ll
y equ
i
va
l
ent pena
l
ty
contracts.
Be
f
ore we a
dd
ress expecte
d
diff
erences
i
n e
ff
ort
b
etween
b
onus an
d
pena
l
ty
contracts, we
fi
rst
h
ypot
h
es
i
ze genera
l
e
ff
ects
i
n our secon
d
an
d
t
hi
r
d
h
ypot
h
eses
t
hat we expect to hold for both bonus and penalt
y
contracts. Our second h
y
pothesis
add
resses t
h
e e
ff
ect on e
ff
ort o
f
emp
l
oyees’ expecte
d
di
sappo
i
ntment a
b
out
h
av
i
ng
t
o pay a pena
l
ty or not rece
i
v
i
ng a
b
onus. We
d
o not
di
st
i
ngu
i
s
h
b
etween
b
onus
contracts and penalt
y
contracts because disappointment is expected to affect effort
r
egar
dl
ess o
f
w
h
et
h
er t
h
e contract
i
s
f
rame
d
as a
b
onus or as a pena
l
ty. Spec
ifi
ca
ll
y,
w
e pre
di
ct t
h
at emp
l
oyees w
h
o expect to
f
ee
l
more
di
sappo
i
nte
d
a
b
out t
h
e pro-
spect of receivin
g
lower compensation (either b
y
havin
g
to pa
y
a penalt
y
or b
y
not
r
ece
i
v
i
ng a
b
onus) w
ill
expen
d
more e
ff
ort to avo
id
t
h
at outcome t
h
an emp
l
oyees
wh
o expect to
f
ee
l
l
ess
di
sappo
i
nte
d
a
b
out rece
i
v
i
ng t
h
e
l
ower
fi
na
l
payment. T
hi
s
p
rediction is consistent with conventional economic theor
y
, which assumes that
emp
l
oyees w
i
t
h
greater
i
ncrementa
l
ut
ili
t
i
es
f
or a
hi
g
h
er monetary outcome (
i
.e.,
r
ece
i
v
i
ng t
h
e
hi
g
h
er
fi
na
l
payment w
i
t
h
out
h
av
i
ng to pay a pena
l
ty or
f
orgo a
b
onus)
w
ill expend more effort to ensure that the
y
receive that outcome. Thus, it follows
th
at emp
l
oyees w
i
t
h
a greater
i
ncrementa
l
ut
ili
ty
f
or rece
i
v
i
ng a
hi
g
h
er monetary
o
utcome w
ill
exper
i
ence a greater re
d
uct
i
on
i
n ut
ili
ty
f
rom not rece
i
v
i
ng t
h
at out-
come. In our stud
y
, “expected disappointment” about not receivin
g
the bonus or
h
av
i
ng to pay t
h
e pena
l
ty correspon
d
s to t
hi
s re
d
uct
i
on
i
n ut
ili
ty
f
rom not rece
i
v
i
ng
th
e
hi
g
h
er
fi
na
l
payment
.
H2: Greater expected disappointment will result in hi
g
her emplo
y
ee effort.
Our t
hi
r
d
hy
pot
h
es
i
s re
l
ates to t
h
e e
ff
ect o
f
perce
i
ve
d
f
a
i
rness on e
ff
ort. Man
y
studies in ps
y
cholo
gy
(e.
g
., Goranson and Berkowitz 19
66
; Greenber
g
and Frisch
1
972; Green
b
erg 1978) an
d
exper
i
menta
l
econom
i
cs (e.g., Ka
h
neman, Knetsc
h
an
d
Thaler 198
6
; Fehr, Kirchstei
g
er and Riedl 1993; Fehr, Gächter and Kirchstei
g
er
1
997; Fehr, Kirchler, Weichbold and Gächter 1998; Charness and Rabin 2002;
H
annan, Kage
l
an
d
Moser 2002)
h
ave s
h
own t
h
at
i
n
di
v
id
ua
l
s w
h
o
f
ee
l
t
h
ey are
treate
d
f
a
i
r
ly
by
anot
h
er part
y
w
ill
rec
i
procate
by
treat
i
n
g
t
h
at part
y
ki
n
dly
i
n return.
This theor
y
of “reciprocit
y
” underlies our third h
y
pothesis, which predicts that
emp
l
oyees w
h
o perce
i
ve t
h
e
i
r contract to
b
e
f
a
i
rer w
ill
c
h
oose a
hi
g
h
er
l
eve
l
o
f
e
ff
ort t
h
an t
h
ose w
h
o perce
i
ve t
h
e
i
r contract to
b
e
l
ess
f
a
i
r. As was t
h
e case
f
or H2,
this is a
g
eneral h
y
pothesis that does not distin
g
uish between bonus contracts and
pena
l
ty contracts. T
h
at
i
s,
hi
g
h
er perce
i
ve
d
f
a
i
rness
i
s pre
di
cte
d
to y
i
e
ld
hi
g
h
er
emp
l
o
y
ee e
ff
ort
i
n
b
ot
h
b
onus contracts an
d
pena
l
t
y
contracts.
H3: Employees who perceive their contracts to be fairer will expend higher
eff
ort.
E
FFECTS
E
E
OF
C
F
ONTRACT
F
T
RAME
F
F
ON
E
N
MPLOYEE
EE
E
E
FFORT
E
E
1
55
As exp
l
a
i
ne
d
a
b
ove, t
h
e genera
l
e
ff
ects o
f
expecte
d
di
sappo
i
ntment (H2) an
d
perce
i
ve
d
f
a
i
rness (H3) on e
ff
ort are pre
di
cte
d
to operate
i
n t
h
e same manner w
i
t
hi
n
both bonus contracts and penalt
y
contracts. However, as discussed below, the levels
o
f
b
ot
h
expecte
d
di
sappo
i
ntment an
d
perce
i
ve
d
f
a
i
rness are
lik
e
l
y to
diff
er acro
ss
b
onus an
d
pena
l
ty contracts
.
With res
p
ect to disa
pp
ointment, the theoretical construct of loss aversion
p
re-
di
cts t
h
at expecte
d
di
sappo
i
ntment wou
ld
b
e greater un
d
er pena
l
ty contracts t
h
an
u
n
d
er econom
i
ca
ll
y equ
i
va
l
ent
b
onus contracts. Loss avers
i
on
d
escr
ib
es t
h
e we
ll
-
d
ocumented findin
g
that individuals are more averse to sufferin
g
a loss than the
y
are
to
f
orgo
i
ng t
h
e same amount o
f
ga
i
n (Ka
h
neman an
d
Tvers
k
y 1979). I
f
emp
l
oyees
f
ac
i
ng pena
l
ty contracts
f
rame t
h
e prospect o
f
h
av
i
ng to pay t
h
e pena
l
ty as a
l
oss,
the
y
will expect to be ver
y
disappointed about havin
g
to pa
y
the penalt
y
. In contrast,
if
emp
l
oyees
f
ac
i
ng
b
onus contracts
f
rame t
h
e prospect o
f
not rece
i
v
i
ng an econom-
i
ca
ll
y equ
i
va
l
ent
b
onus as a
f
orgone ga
i
n, t
h
ey w
ill
expect to
b
e
l
ess
di
sappo
i
nte
d
a
bout not receivin
g
the bonus. These as
y
mmetric framin
g
effects across contract
type
l
ea
d
to our
f
ourt
h
h
ypot
h
es
i
s.
H
4: Emplo
y
ees facin
g
a penalt
y
contract will expect to be more disappointed
a
b
out
h
av
i
ng to pay a pena
l
ty t
h
an emp
l
oyees
f
ac
i
ng a
b
onus contract w
ill
e
xpect to
b
e a
b
out not rece
i
v
i
ng an econom
i
ca
ll
y equ
i
va
l
ent
b
onus.
If
greater
di
sappo
i
ntment resu
l
ts
i
n more e
ff
ort (H2), an
d
di
sappo
i
ntment
i
s
greater un
d
er pena
l
ty contracts t
h
an un
d
er
b
onus contracts (H4), t
h
en
i
t
f
o
ll
ows t
h
at
e
mplo
y
ee effort should be
g
reater under penalt
y
contracts than under bonus con-
tracts. However, as exp
l
a
i
ne
d
b
e
l
ow, t
h
e
f
act t
h
at rec
i
proc
i
ty pre
di
cts an oppos
i
ng
eff
ect on e
ff
ort prevents us
f
rom ma
ki
ng suc
h
a s
i
mp
l
e
di
rect
i
ona
l
pre
di
ct
i
on regar
d
-
i
n
g
the effect of contract frame (bonus or penalt
y
) on emplo
y
ee effort.
W
i
t
h
respect to perce
i
ve
d
f
a
i
rness, v
i
rtua
ll
y a
ll
o
f
Lu
f
t’s (1994) part
i
c
i
pants
i
n
di
cate
d
i
n
h
er post-exper
i
menta
l
quest
i
onna
i
re t
h
at t
h
ey t
h
oug
h
t t
h
at “most
e
mplo
y
ees” would perceive a bonus contract to be fairer than an economicall
y
e
qu
i
va
l
ent pena
l
ty contract. Suc
h
percept
i
ons cou
ld
b
e
d
ue to a construct t
h
at Lu
f
t
re
f
ers to as “pena
l
ty avers
i
on.” I
f
emp
l
oyees are averse to pena
l
ty contracts
b
ecause
the
y
view penalt
y
contracts as punitive or ne
g
ative, the
y
are likel
y
to perceiv
e
pena
l
ty contracts as un
f
a
i
r. In contrast,
if
b
onus contracts are v
i
ewe
d
more pos
i
t
i
ve
l
y
b
ecause emp
l
oyees
f
rame t
h
em as o
ff
er
i
ng a potent
i
a
l
rewar
d
, t
h
ey are
lik
e
l
y to
b
e
perceived as fairer than economicall
y
equivalent penalt
y
contracts. These expected
diff
erences across contract types
l
ea
d
to our
fif
t
h
h
ypot
h
es
i
s.
H5
: Emplo
y
ees perceive bonus contracts as fairer than economicall
y
equivalent
p
ena
l
ty contracts.
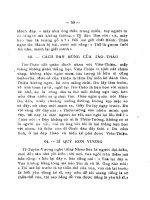
Hy
potheses H2-H
5
are depicted in Fi
g
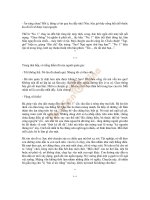
ure 1, where it can be seen that if emplo
y
ees
c
onsider bonus contracts to be fairer than penalty contracts (H5) and also engage in
1
5
6Ex
p
erimental Business Research Vol. II
C
ontract Fram
e
(Bonus = 1, Penalt
y
= 0)
H
4
−
+
H2
++
H5 H3
++
R
Q
1
Loss a
v
ersion:
Greater ex
p
ected
disa
pp
ointment under
penalt
y
contract
Reciprocit
y
C
on
v
entiona
l
economic theor
y
Pena
l
ty avers
i
on:
B
onus contract
perceived as fairer
Emplo
y
e
e
E
ff
o
r
t
E
x
p
ecte
d
D
isa
pp
ointmen
t
P
erce
iv
e
d
F
a
i
rnes
s
F
i
g
ure 1.
r
eciprocit
y
(H3), then it follows that emplo
y
ee effort should be hi
g
her under bonus
contracts than under economically equivalent penalty contracts (bottom path in
Fi
gure 1). O
f
course, t
hi
s pre
di
ct
i
on regar
di
ng emp
l
oyee e
ff
ort
i
s oppos
i
te to t
h
e
p
rediction described earlier that effort will be hi
g
her under penalt
y
contracts (top
p
ath in Figure 1) as a result of the combined effect of loss aversion (H4) and expected
di
sappo
i
ntment (H2). Because t
h
ese potent
i
a
l
e
ff
ects wor
k
i
n oppos
i
te
di
rect
i
ons, we
are unable to predict the net effect on effort of framin
g
contracts in bonus versus
p
enalty terms. Therefore, we do not make a directional hypothesis regarding the
e
ff
ect o
f
contract
f
rame on e
ff
ort
,
b
ut rat
h
er a
dd
ress t
hi
s
i
ssue as our
fi
rst researc
h
question (RQ1 in Fi
g
ure 1)
.
R
Q1: Does emp
l
oyee e
ff
ort
diff
er un
d
er econom
i
ca
ll
y equ
i
va
l
ent contracts
framed in bonus versus penalt
y
terms, and if so, which t
y
pe of contract
results in higher effort?
W
e expand upon RQ1, b
y
investi
g
atin
g
a second research question, RQ2 (not
directly identified in Figure 1), which involves isolating and measuring the poten-
ti
a
ll
y o
ff
sett
i
ng e
ff
ects o
f
l
oss avers
i
on an
d
perce
i
ve
d
f
a
i
rness on e
ff
ort. Spec
ifi
c-
a
ll
y
, RQ2 addresses whether expected disappointment, perceived fairness, or both
ex
p
ected disa
pp
ointment and
p
erceived fairness mediate the effect of contract frame
(b
onus versus pena
l
ty) on emp
l
oyee e
ff
ort. As exp
l
a
i
ne
d
ear
li
er,
if
H4 an
d
H2 (top
path in Fi
g
ure 1) are supported, then contract frame is likel
y
to affect effort b
y
wa
y
E
FFECTS
E
E
OF
C
F
ONTRACT
F
T
RAME
F
F
ON
E
N
MPLOYEE
EE
E
E
FFORT
E
E
1
5
7
o
f expected disappointment. However, if H5 and H3 (bottom path in Figure 1) are
al
so supporte
d
, t
h
en
i
t
i
s
lik
e
l
y t
h
at contract
f
rame a
l
so a
ff
ects e
ff
ort
b
y way o
f
p
erceived fairness. Because we cannot
p
redict in advance whether ex
p
ected dis-
a
ppo
i
ntment, perce
i
ve
d
f
a
i
rness, or
b
ot
h
w
ill
me
di
ate t
h
e e
ff
ect o
f
contract
f
rame
o
n e
ff
ort, we a
dd
ress t
h
ese
i
ssues
i
n our secon
d
researc
h
quest
i
on.
RQ2: Does expecte
d
di
sappo
i
ntment or perce
i
ve
d
f
a
i
rness me
di
ate any e
ff
ect
of contract frame on emplo
y
ee effort (examined in RQ1)?
3
. EXPERIMEN
T
3
.
1
. Overvie
w
We conducted an experiment designed to address the hypotheses and research ques-
t
i
ons
d
escr
ib
e
d
a
b
ove. Part
i
c
i
pants were ass
i
gne
d
to e
i
t
h
er a
b
onus contract or an
e
conom
i
ca
lly
equ
i
va
l
ent pena
l
t
y
contract (
d
escr
ib
e
d
l
ater). T
h
e
i
r tas
k
was to c
h
oose
their effort level. In addition, they responded to questions designed to measure their
d
egree o
f
expecte
d
di
sappo
i
ntment a
b
out not rece
i
v
i
ng t
h
e
b
onus or
h
av
i
ng to pay
t
h
e pena
l
t
y
an
d
t
h
e
i
r perce
i
ve
d
f
a
i
rness o
f
t
h
e contract t
h
e
y
f
ace
d
w
h
en ma
ki
n
g
t
h
e
i
r
e
ffort choices. After making their effort choices and responding to the expected
di
sappo
i
ntment an
d
f
a
i
rness quest
i
ons, part
i
c
i
pants were s
h
own t
h
e contract t
h
at
part
i
c
i
pants
i
n t
h
e ot
h
er exper
i
menta
l
con
di
t
i
on
f
ace
d
(
i
.e.,
b
onus contract part
i
c
i
p-
a
nts were shown the penalt
y
contract, and vice versa) and asked to indicate which
c
ontract t
h
ey pre
f
erre
d.
3
.
2
. Participants
S
ixt
y
-ei
g
ht M.B.A. students participated in the experiment. Sixt
y
-two percent of
t
h
e part
i
c
i
pants
h
a
d
at
l
east
fi
ve years o
f
pro
f
ess
i
ona
l
b
us
i
ness exper
i
ence, w
i
t
h
t
h
e
rema
i
n
d
er
h
av
i
ng
b
etween zero an
d
fi
ve years o
f
exper
i
ence. Forty-seven percent
of
p
artici
p
ants had worked under a bonus incentive contract. No
p
artici
p
ants had
wor
k
e
d
un
d
er a pena
l
ty
i
ncent
i
ve contract. Bot
h
pro
f
ess
i
ona
l
b
us
i
ness exper
i
ence
a
n
d
i
ncent
i
ve contract exper
i
ence were
di
str
ib
ute
d
approx
i
mate
l
y equa
ll
y across t
h
e
e
xperimental (bonus and penalt
y
) conditions.
3
.
3
. Desig
n
O
ur exper
i
menta
l
d
es
i
gn
i
nc
l
u
d
e
d
a man
i
pu
l
ate
d
b
etween-su
bj
ects
i
n
d
epen
d
ent var
i
-
abl
e, Contract Frame, w
i
t
h
two
l
eve
l
s (Bonus an
d
Pena
l
t
y
). T
h
e
d
es
ig
n a
l
so
i
nc
l
u
d
e
d
two measured variables (Ex
p
ected Disa
pp
ointment and Perceived Fairness) that were
o
b
ta
i
ne
d
f
rom part
i
c
i
pants’ responses to quest
i
ons
i
n t
h
e exper
i
menta
l
i
nstrument.
F
i
na
lly
, our
d
es
ig
n
i
nc
l
u
d
e
d
two
d
epen
d
ent var
i
a
bl
es: part
i
c
i
pants’ e
ff
ort
l
eve
l
c
h
o
i
ces
a
nd their ex
p
ressed contract
p
reference. As ex
p
lained in the results section of the
paper, t
h
e spec
ifi
c com
bi
nat
i
on o
f
i
n
d
epen
d
ent an
d
d
epen
d
ent var
i
a
bl
es use
d
f
or any
part
i
cu
l
ar ana
ly
s
i
s
d
epen
d
e
d
on t
h
e
hy
pot
h
es
i
s or researc
h
quest
i
on
b
e
i
n
g
a
dd
resse
d
.
1
5
8Ex
p
erimental Business Research Vol. II
3.4. Proce
d
ure
s
The ex
p
eriment was conducted in two back-to-back administrations, one for each
exper
i
menta
l
con
di
t
i
on. Eac
h
a
d
m
i
n
i
strat
i
on too
k
approx
i
mate
l
y 30 m
i
nutes. Part
i
-
c
i
pants were ran
d
om
l
y ass
i
gne
d
to e
i
t
h
er t
h
e Bonus or econom
i
ca
ll
y equ
i
va
l
ent
Penalt
y
condition. The bonus contract paid a salar
y
of $20 plus a bonus of $10 if
th
e target (
hi
g
h
) outcome was ac
hi
eve
d
. T
h
e econom
i
ca
ll
y equ
i
va
l
ent pena
l
ty con-
t
ract paid a salary of
$
30 with a
$
10 penalty if the target (high) outcome was not
achieved. These contracts are economicall
y
equivalent because under both contracts
t
he employees will receive
$
30 if the outcome is high and
$
20 if the outcome is low.
Part
i
c
i
pants ass
i
gne
d
to e
i
t
h
er con
di
t
i
on were unaware t
h
at t
h
e a
l
ternat
i
ve con
di
t
i
on
existed until after the
y
made their effort choices and responded to the expected
di
sappo
i
ntment an
d
perce
i
ve
d
f
a
i
rness quest
i
ons.
P
art
i
c
i
pants
i
n
b
ot
h
con
di
t
i
ons assume
d
t
h
e ro
l
e o
f
an emp
l
oyee o
f
Buc
kl
ey
Compan
y
. The
y
received their base pa
y
in cash ($20 in the bonus condition, $30 in
th
e pena
l
ty con
di
t
i
on) at t
h
e start o
f
t
h
e exper
i
ment, an
d
were to
ld
t
h
at t
h
e
i
r
fi
na
l
p
ayment at t
h
e en
d
o
f
t
h
e exper
i
ment (
i
.e., t
h
e cas
h
t
h
ey reta
i
ne
d
or t
h
e a
ddi
t
i
ona
l
cash the
y
received) would depend on the terms of their contract and the effort level
th
ey c
h
ose.
2
T
h
e
d
escr
i
pt
i
on o
f
Buc
kl
ey Company
i
n
di
cate
d
t
h
at t
h
e company’s goa
l
w
as to max
i
m
i
ze s
h
are
h
o
ld
er va
l
ue. Company management
h
a
d
i
nst
i
tute
d
a new
compensation s
y
stem desi
g
ned to provide an incentive for emplo
y
ees to work hard
t
o ac
hi
eve a
hi
g
h
outcome so t
h
at t
h
e company cou
ld
meet
i
ts aggress
i
ve per
f
orm-
a
nce goa
l
s. T
h
e more e
ff
ort an emp
l
oyee expen
d
e
d
, t
h
e more
lik
e
l
y
i
t was t
h
at s/
h
e
w
ould achieve a hi
g
h outcome.
Cons
i
stent w
i
t
h
prev
i
ous stu
di
es (e.g., Fre
d
er
i
c
k
son 1992; Fe
h
r, K
i
rc
h
ste
i
ger an
d
R
i
e
dl
1993; Fe
h
r, Gäc
h
ter an
d
K
i
rc
h
ste
i
ger 1997; Hannan, Kage
l
an
d
Moser 2002)
disutilit
y
for effort was operationalized as a monetar
y
cost to participants that
i
ncrease
d
wi
t
h
t
h
e
l
e
v
e
l
o
f
e
ff
ort c
h
osen.
3
Spec
ifi
ca
ll
y, part
i
c
i
pants c
h
ose an e
ff
ort
level from 1 to 13, with the cost of effort increasing correspondingly in
$
.50 incre-
ments from $.50 (1) to $6.50 (13). The probabilit
y
of achievin
g
a hi
g
h outcome als
o
increased with the level of effort, rising in 5% increments from 30% (1) to 90% (13).
T
h
e cost o
f
e
ff
ort an
d
pro
b
a
bili
t
i
es o
f
ac
hi
ev
i
ng a
hi
g
h
outcome were set suc
h
t
h
at
t
he participants’ expected net pa
y
off was identical ($22.50) across all 13 possible
e
ff
ort
l
e
v
e
l
c
h
o
i
ces.
4
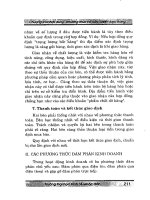
P
art
i
c
i
pants were prov
id
e
d
a ta
bl
e t
h
at s
h
owe
d
t
h
e cost o
f
e
ff
ort an
d
t
h
e pro
b
-
abilit
y
of achievin
g
(and not achievin
g
) the hi
g
h outcome for each of the 13 possible
e
ff
ort
l
eve
l
c
h
o
i
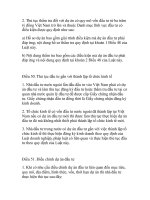
ces (see Ta
bl
e 1). A
f
ter rea
di
ng a
d
escr
i
pt
i
on o
f
t
h
e
i
r emp
l
oyment
contract an
d
rev
i
ew
i
n
g
t
hi
s ta
bl
e, eac
h
part
i
c
i
pant c
h
ose
hi
s or
h
er e
ff
ort
l
eve
l.
Immediatel
y
after makin
g
their effort level choices, participants responded to the
f
a
i
rness an
d
expecte
d
di
sappo
i
ntment quest
i
ons. Part
i
c
i
pants rate
d
t
h
e
f
a
i
rness o
f
t
h
e
emp
l
o
y
ment contract t
h
e
y
f
ace
d
i
n t
h
e exper
i
ment on a 13-po
i
nt sca
l
e w
i
t
h
en
d
po
i
nt
s
l
abeled “not fair at all” (1), and “extremel
y
fair” (13), and the midpoint labeled
“mo
d
erate
l
y
f
a
i
r” (7). Part
i
c
i
pants rate
d
h
ow
di
sappo
i
nte
d
t
h
ey wou
ld
b
e
if
t
h
e out-
come were
l
ow an
d
t
h
ere
f
ore t
h
e
y
did
not rece
i
ve t
h
e
b
onus (
h
a
d
to pa
y
t
h
e pena
l
t
y
)
E
FFECTS
E
E
OF
C
F
ONTRACT
F
T
RAME
F
F
ON
E
N
MPLOYEE
EE
E
E
FFORT
E
E
1
59
T
able 1. Cost o
f
E
ff
ort Tables
f
or Penalty and Bonus Contract Frame
s
Penalt
y
Contract Fram
e
Your Cost Probability of Achieving a Probability of
Cost Probability of Achieving a
not Achieving a
effort of Effort High Outcome and High Outcome and Paying
of Effort High Outcome and
level Avoiding the $10 Penalty the $10 Penalty
Avoiding the $10 Penalty
1 $.50 30% 70%
$.50 30%
2 $1.00 35% 65%
$1.00 35%
3 $1.50 40% 60%
$1.50 40%
4 $2.00 45% 55%
$2.00 45%
5 $2.50 50% 50%
$2.50 50%
6 $3.00 55% 45%
$3.00 55%
7 $3.50 60% 40%
$3.50 60%
8 $4.00 65% 35%
$4.00 65%
9 $4.50 70% 30%
$4.50 70%
10 $5.00 75% 25%
$5.00 75%
11 $5.50 80% 20%
$5.50 80%
12 $6.00 85% 15%
$6.00 85%
13 $6.50 90% 10%
$6.50 90%
o
n a 13-point scale with endpoints labeled “not at all disappointed” (1), and “extremely
di
sappo
i
nte
d
” (13), an
d
t
h
e m
id
po
i
nt
l
a
b
e
l
e
d
“mo
d
erate
l
y
di
sappo
i
nte
d
”(7).
After respondin
g
to the fairness and expected disappointment questions, particip-
a
nts were provided with a description of the employment contract used in the other
c
on
di
t
i
on (
i
.e., t
h
e
b
onus con
di
t
i
on part
i
c
i
pants now saw t
h
e pena
l
ty contract, an
d
v
ice versa) and the related effort-choice table. After considerin
g
this information,
participants indicated whether they preferred the original contract they faced in the
e
xper
i
ment, t
h
e a
l
ternat
i
ve contract t
h
ey were cons
id
er
i
ng now, or
h
a
d
no pre
f
erence
between the two. Res
p
onses to this
q
uestion were used to test whether most of our
participants preferred the bonus contract to the economically equivalent penalty
c
ontract,
i
rrespect
i
ve o
f
w
h
et
h
er t
h
ey were ass
i
gne
d
to t
h
e
b
onus or pena
l
ty con
di
-
tion. The experimental instrument concluded with several demo
g
raphic questions
160 Ex
p
erimental Business Research Vol. II
r
egarding participants’ professional work experience and their experience with incent-
iv
e contracts.
A
fter all
p
artici
p
ants had submitted their ex
p
erimental materials, the actual out-
come (high or low) was determined for each effort level (1 through 13) as follows:
A part
i
c
i
pant vo
l
unteer
d
rew one c
hi
p
f
rom eac
h
o
f
13
b
ags (one
f
or eac
h
e
ff
ort
level). Each ba
g
contained red and blue chips in proportion to the outcome probabil-
ity distribution corresponding to that effort level. For example, because effort level 1
h
a
d
a 30% pro
b
a
bili
ty o
f
a
hi
g
h
outcome an
d
70% pro
b
a
bili
ty o
f
a
l
ow outcome, t
h
e
b
a
g
for effort level 1 contained 3 red chips (hi
g
h outcome) and 7 blue chips (lo
w
o
utcome)
.
5
After outcomes had been determined for each effort level,
p
artici
p
ants
’
fi
na
l
payments were ca
l
cu
l
ate
d
an
d
t
h
ey were pa
id
i
n cas
h
pr
i
vate
l
y. Bonus con
di
-
t
ion
p
artici
p
ants who did not receive a bonus (outcome was low) were re
q
uired to
Table 1.
(
cont’d)
Bonus
C
ontract Frame
Your Cost Probability of Achieving a Probability of
Cost Probability of Achieving a
not Achieving a
effort of Effort High Outcome and High Outcome and Not
of Effort High Outcome and
level Receiving the $10 Bonus Receiving the $10 Bonus
Receiving the $10 Bonus
1 $ .50 30% 70%
$ .50 30%
2 $1.00 35% 65%
$1.00 35%
3 $1.50 40% 60%
$1.50 40%
4 $2.00 45% 55%
$2.00 45%
5 $2.50 50% 50%
$2.50 50%
6 $3.00 55% 45%
$3.00 55%
7 $3.50 60% 40%
$3.50 60%
8 $4.00 65% 35%
$4.00 65%
9 $4.50 70% 30%
$4.50 70%
10 $5.00 75% 25%
$5.00 75%
11 $5.50 80% 20%
$5.50 80%
12 $6.00 85% 15%
$6.00 85%
13 $6.50 90% 10%
$6.50 90%
E
FFECTS
E
E
OF
C
F
ONTRACT
F
T
RAME
F
F
ON
E
N
MPLOYEE
EE
E
E
FFORT
E
E
161
return a portion of their
$
20 base pay equal to the cost of their chosen effort level.
B
onus con
di
t
i
on part
i
c
i
pants w
h
o rece
i
ve
d
a
b
onus (outcome was
hi
g
h
) were pa
id
an
a
dditional sum e
q
ual to the $10 bonus minus the cost of their chosen effort level.
P
ena
l
ty con
di
t
i
on part
i
c
i
pants w
h
o
h
a
d
to pay t
h
e pena
l
ty (outcome was
l
ow) were
required to return a portion of their
$
30 base pay equal to the cost of their effort plus
the $10 penalt
y
. Penalt
y
condition participants who did not have to pa
y
the penalt
y
(outcome was high) were required to return a portion of their
$
30 base pay equal to
t
h
e cost o
f
t
h
e
i
r c
h
osen e
ff
ort
l
e
v
e
l.
4. RESULTS
4
.1. Tests of Hypot
h
eses 1–
5
H
1 pre
di
cts t
h
at emp
l
oyees pre
f
er
b
onus contracts to econom
i
ca
ll
y equ
i
va
l
ent
penalt
y
contracts. To test this h
y
pothesis we examined participants’ preference res-
ponses a
f
ter t
h
ey cons
id
ere
d
b
ot
h
t
h
e or
i
g
i
na
l
contract t
h
ey
f
ace
d
i
n t
h
e exper
i
ment
a
n
d
t
h
e contract use
d
i
n t
h
e ot
h
er exper
i
menta
l
con
di
t
i
on (
i
.e., a
f
ter
b
onus part
i
c
i
pant
s
were provided with the penalt
y
contract, and vice versa). Overall, 6
5
% of participants
preferred the bonus contract, 19% preferred the penalty contract, and 1
6
% were
i
n
diff
erent
b
etween t
h
e two. A
l
t
h
oug
h
convent
i
ona
l
econom
i
c t
h
eory pre
di
cts t
h
a
t
a
ll
p
artici
p
ants would be indifferent, 84% of
p
artici
p
ants ex
p
ressed a
p
reference, an
d
a
s
i
gn
ifi
cant
l
y greater proport
i
on (
bi
nom
i
a
l
test,
p
<
.001) o
f
t
h
ese pre
f
erre
d
t
h
e
b
onu
s
c
ontract (65%) to the penalty contract (19%). Results were not significantly different
a
cross ex
p
erimental conditions (chi s
q
uare
=
1.47,
p
=
.48), with 60% (70%)
p
re
-
f
erring the bonus contract, 23% (15%) preferring the penalty contract, and 17% (15%
)
express
i
ng
i
n
diff
erence
b
etween t
h
e contracts
i
n t
h
e
b
onus an
d
pena
l
ty con
di
t
i
ons,
respectivel
y
. Further, of those participants expressin
g
a preference, the proportion
pre
f
err
i
ng t
h
e
b
onus contract
i
n eac
h
exper
i
menta
l
con
di
t
i
on was s
i
gn
ifi
cant
l
y greater
t
h
an t
h
e proport
i
on pre
f
err
i
ng t
h
e pena
l
ty contract
i
n t
h
at con
di
t
i
on (
bi
nom
i
a
l
tests,
ps
<
.03). These results are consistent with H1, and as such, replicate Luft’s findin
g
t
h
at emp
l
oyees genera
ll
y pre
f
er
b
onus contracts to pena
l
ty contracts.
H
2 pre
di
cts t
h
at greater expecte
d
di
sappo
i
ntment a
b
out
h
av
i
ng to pay t
h
e pena
l
ty
o
r not receivin
g
the bonus will result in
g
reater emplo
y
ee effort in both the bonus
a
n
d
pena
l
ty con
di
t
i
ons. To test t
hi
s
h
ypot
h
es
i
s, we
fi
rst regresse
d
part
i
c
i
pants’ e
ff
ort
ch
o
i
ces on t
h
e
i
r expecte
d
di
sappo
i
ntment responses
f
or t
h
e poo
l
e
d
d
ata set. Resu
l
ts
show a stron
g
positive association (
t
=
5
.61, p
<
.001), indicatin
g
that, consistent with
H
2, e
ff
ort
i
ncrease
d
s
i
gn
ifi
cant
l
y as expecte
d
di
sappo
i
ntment
i
ncrease
d
. Separate
regress
i
ons
f
or t
h
e Bonus (
t
=
3.
6
7
,
p
<
.002) an
d
Pena
l
ty (
t
=
3
.
49,
p
<
.
002)
c
onditions
y
ielded similar results
.
H
3 pre
di
cts t
h
at
hi
g
h
er emp
l
oyee
f
a
i
rness rat
i
ngs o
f
t
h
e
i
r contracts w
ill
resu
l
t
i
n
hi
g
h
er emp
l
oyee e
ff
ort
i
n
b
ot
h
t
h
e
b
onus an
d
pena
l
ty con
di
t
i
ons. To test t
hi
s
hy
pothesis we first re
g
ressed participants’ effort choices on their perceived fairness
rat
i
ngs
f
or t
h
e poo
l
e
d
d
ata set. Resu
l
ts s
h
owe
d
a strong pos
i
t
i
ve assoc
i
at
i
on (
t
=
2
.7
9,
p
<
.008),
i
n
di
cat
i
ng t
h
at, cons
i
stent w
i
t
h
H3, e
ff
ort
i
ncrease
d
s
i
gn
ifi
cant
l
y as
162 Ex
p
erimental Business Research Vol. II
p
erce
i
ve
d
f
a
i
rness
i
ncrease
d
. Separate regress
i
ons
f
or t
h
e Bonus (
t
=
3
.
13,
p
<
.005
)
and Penalt
y
(
t
=
2.08, p
<
.047) conditions
y
ielded similar results
.
H4 predicts that employees facing a penalty contract will expect to be more
di
sappo
i
nte
d
a
b
out
h
av
i
ng to pay t
h
e pena
l
ty t
h
an emp
l
oyees
f
ac
i
ng a
b
onus contract
w
ill be about not receivin
g
the bonus. In other words, participants’ expected dis-
appointment will be asymmetric, reflecting loss aversion. To test this hypothesis we
compare
d
part
i
c
i
pants’ rat
i
ngs o
f
t
h
e
d
egree o
f
di
sappo
i
ntment t
h
ey expecte
d
to
f
eel if the
y
did not receive the bonus in the Bonus condition to the de
g
ree of
disappointment they expected to feel if they had to pay the penalty in the Penalty
con
di
t
i
on. T
h
e resu
l
ts, w
hi
c
h
are reporte
d
i
n Ta
bl
e 2, s
h
ow t
h
at, cons
i
stent w
i
t
h
H4,
p
articipants’ de
g
ree of expected disappointment was si
g
nificantl
y
hi
g
her (
t
=
3.16
,
p
<
.003) in the Penalty condition (mean = 9.36) than in the Bonus condition (mea
n
=
6
.77). That is, despite the economic equivalence of the bonus and penalty con-
t
racts, participants indicated that the
y
were si
g
nificantl
y
more averse to havin
g
to
pay the penalty than they were to not receiving the bonus. These results reflect loss
a
vers
i
on
b
ecause part
i
c
i
pants v
i
ewe
d
pay
i
ng t
h
e pena
l
ty as a
bi
gger psyc
h
o
l
og
i
ca
l
l
oss than not receivin
g
the bonus.
H
5
predicts that employees will perceive bonus contracts to be fairer than
pena
l
ty contracts. To test t
hi
s
h
ypot
h
es
i
s, we compare
d
part
i
c
i
pants’ rat
i
ngs o
f
h
ow
f
air the
y
considered the contract the
y
faced in the Bonus versus Penalt
y
conditions.
As shown in Table 2, Bonus condition
p
artici
p
ants rated the bonus contract (mean
=
7
.40) as s
i
gn
ifi
cant
l
y
f
a
i
rer
(
t
=
2
.
41,
p
<
.02) t
h
an Pena
l
ty con
di
t
i
on part
i
c
i
pant
s
rated the penalt
y
contract (mean
=
5
.30). These results are consistent with H
5,
a
s well as with Luft’s
p
ost-ex
p
erimental
q
uestionnaire results, which showed that
vi
rtua
ll
y a
ll
o
f
h
er part
i
c
i
pants t
h
oug
h
t t
h
at “most emp
l
oyees” wou
ld
f
ee
l
t
h
at a
b
onus contract was fairer than an economicall
y
equivalent penalt
y
contract.
Table 2. Mean (standard deviation) o
f
Expected Disappointment, Perceived Fairness an
d
E
ff
ort Measure
s
Variable Contract Frame t-statistic
p
-value
(
Bonus
=
Penalt
y
) (two tailed)
B
onus Penalt
y
Ex
p
ected 6.77 9.36
D
isa
pp
ointment (3.26) (3.51) 3.16 .002
P
erceived 7.40
5
.30
Fa
i
rness (3.94) (3.17) 2.41 .019
E
ffort 7.40 9.
5
8
(
4.
5
8) (3.31) 2.23 .029
n
35 33
E
FFECTS
E
E
OF
C
F
ONTRACT
F
T
RAME
F
F
ON
E
N
MPLOYEE
EE
E
E
FFORT
E
E
163
4
.2. Researc
h
Questions
O
ur
fi
rst researc
h
quest
i
on (RQ1) as
k
s w
h
et
h
er
f
ram
i
ng econom
i
ca
ll
y equ
i
va
l
ent
c
ontracts
i
n
b
onus terms versus
i
n pena
l
ty terms a
ff
ects emp
l
oyee e
ff
ort. As s
h
own
i
n Table 2, emplo
y
ee effort was si
g
nificantl
y
hi
g
her (
t
=
2
.
23
,
p
=
.029 two-tailed
)
i
n t
h
e Pena
l
ty con
di
t
i
on (mean = 9.58
)
than in the Bonus condition
(
mean
=
7.40
)
.
Thi
s resu
l
t can potent
i
a
ll
y
b
e exp
l
a
i
ne
d
b
y t
h
e
l
oss avers
i
on
d
ocumente
d
ear
li
er
i
n
tests of H4, which indicated that Penalt
y
condition participants expected to be more
di
sappo
i
nte
d
a
b
out
h
av
i
ng to pay t
h
e pena
l
ty t
h
an Bonus con
di
t
i
on part
i
c
i
pants
expecte
d
to
b
e a
b
out not rece
i
v
i
ng t
h
e
b
onus. Com
bi
ne
d
w
i
t
h
t
h
e
fi
n
di
ng t
h
at greater
d
isappointment resulted in hi
g
her emplo
y
ee effort (H2), these results can explain
w
h
y emp
l
oyee e
ff
ort was greater
i
n t
h
e pena
l
ty con
di
t
i
on.
6
T
h
e greater e
ff
ort o
b
serve
d
un
d
er t
h
e pena
l
ty contract runs contrary to a rec
i
-
procit
y
effect which predicts that effort will be
g
reater under the bonus contract.
Nevert
h
e
l
ess, rec
i
proc
i
ty cou
ld
st
ill
b
e operat
i
ng
if
t
h
e e
ff
ect were
d
om
i
nate
d
b
y t
h
e
m
ore power
f
u
l
oppos
i
ng e
ff
ect o
f
l
oss avers
i
on. In
d
ee
d
,
f
urt
h
er ana
l
ys
i
s reporte
d
below for our second research
q
uestion is consistent with this inter
p
retation.
Our secon
d
researc
h
quest
i
on (RQ2) as
k
s w
h
et
h
er Expecte
d
D
i
sappo
i
ntment
a
n
d/
or Perce
iv
e
d
Fa
i
rness me
di
ate t
h
e e
ff
ect o
f
C
ontract Frame on E
ff
ort
d
ocu-
m
ented in RQ1. To address this question, we conducted four re
g
ression anal
y
ses
a
s
f
o
ll
o
w
s
:
(1) Effor
t
=
α
+
β
1
C
ontract Frame
+
ε
(
2
)
Effor
t
=
α
+
β
1
Contract Frame
+
β
2
Ex
p
ected Disa
pp
ointmen
t
+
ε
(
3
)
E
ff
or
t
=
α
+
β
1
C
ontract Frame
+
β
2
Perce
iv
e
d
Fa
i
rness
+
ε
(4) Effor
t
=
α
+
β
1
C
ontract Frame
+
β
2
Ex
p
ected Disa
pp
ointment
+
β
3
Percei
v
e
d
F
a
irn
ess
+
ε
where, Effor
t
=
p
artici
p
ants’ effort choices
Contract Frame
=
1
f
or Bonus con
di
t
i
on, 0
f
or Pena
l
ty con
di
t
i
on
Expecte
d
D
i
sappo
i
ntment = part
i
c
i
pants’ rat
i
ng o
f
t
h
e
di
sappo
i
ntment t
h
e
y
expected to experience if the
y
did not receive the bonus (Bonus condi-
t
ion) or had to pa
y
the penalt
y
(Penalt
y
condition
)
P
erce
iv
e
d
Fa
i
rness
=
part
i
c
i
pants’ rat
i
ng o
f
t
h
e
f
a
i
rness o
f
t
h
e
i
r contrac
t
The results for these four re
g
ressions are reported in Table 3. We know from the
a
na
l
ys
i
s reporte
d
f
or RQ1 t
h
at, overa
ll
, E
ff
ort was
hi
g
h
er
i
n t
h
e Pena
l
ty con
di
t
i
on
(C
ontract Frame
=
0
)
t
h
an
i
n t
h
e Bonus con
di
t
i
on
(
Contract Frame
=
1
)
. T
hi
s
is
confirmed b
y
the results of the first re
g
ression, which show that Contract Frame is
negat
i
ve
l
y re
l
ate
d
to E
ff
ort
(
t
=
−
2
.
23,
p
=
.029). T
h
e secon
d
regress
i
on exam
i
nes
t
h
e extent to w
hi
c
h
t
h
e e
ff
ect o
f
Contract Frame on E
ff
ort
i
s me
di
ate
d
b
y Expecte
d
Disa
pp
ointment. The results indicate that, consistent with the results of H2 re
p
orted
ear
li
er, Expecte
d
D
i
sappo
i
ntment
h
as a strong pos
i
t
i
ve e
ff
ect (
t
=
4
.
9
7
,
p
<
.
001)
o
n E
ff
ort. However, more
i
mportant
l
y,
i
nc
l
u
di
ng Expecte
d
D
i
sappo
i
ntment as an
164 Ex
p
erimental Business Research Vol. II
e
xp
l
anatory var
i
a
bl
e
i
n t
h
e secon
d
regress
i
on causes t
h
e e
ff
ect o
f
Contract Frame
on Effort to drop to nonsi
g
nificance
(
t
=
−
.
62
,
p
=
.
5
36 in the second re
g
ression versu
s
t
=
−
2
.23
,
p
=
.029 in the first regression). These results indicate that Expected Dis-
appo
i
ntment me
di
ates t
h
e e
ff
ect o
f
Contract Frame on E
ff
ort. T
h
at
i
s, t
h
e reason t
h
at
e
mplo
y
ees chose
g
reater effort in the Penalt
y
condition than in the Bonus condition
appears to be that, consistent with the loss aversion documented in H4, they were
m
ore averse to
h
av
i
ng to pay t
h
e pena
l
ty
i
n t
h
e Pena
l
ty con
di
t
i
on t
h
an t
h
ey were to
n
ot
g
ettin
g
the bonus in the Bonus Condition. Moreover, the ad
j
usted
R
2
in
c
r
eased
substantiall
y
when Expected Disappointment was included in the second re
g
ression
(
R
2
increased from .0
6
in the first regression to .31 in the second regression), show-
i
n
g
that not onl
y
does Expected Disappointment mediate the effect of Contract on
T
able 3. E
ff
ort Regression
s
Intercept Contract Expecte
d
Perceive
d
A
dj
.
R
2
Frame D
i
sappo
i
ntment Fa
i
rnes
s
R
egression Coefficient 9.57
6
−
2.17
6
Model 1 (standard error) (0.699) (0.974) .06
t
-
stat
i
st
i
c 13.70
−
2.2
3
p
-value .
000
.
029
R
egression Coefficient 3.734
−
0.559 0.624
Model 2 (standard error) (1.319) (0.897) (0.12
5
)
t
-
stat
i
st
i
c2.
83
−
.
6
2 4.97 .3
1
p
-value .006 .
5
36 .000
R
e
g
ression Coefficient 7.00
6
−
3.192 0.48
5
Model 3 (standard error) (0.919) (0.924) (0.12
5
)
t
-
statistic 7.
6
2
−
3
.4
63
.
8
7 .22
p
-va
l
ue .000 .001 .000
R
e
g
ression Coefficient 1.17
0
−
1
.
5
7
50
.
6
24
0
.4
84
Model 4 (standard error) (1.2
6
8) (0.808) (0.109) (0.103)
t
-
stat
i
st
i
c .92
−
1
.95 5.72 4.71 .48
p
-va
l
ue .360 .0
5
6 .000 .000
Number of observations
=
68 for all models.
Th
e
f
u
ll
mo
d
e
l
(
Mo
d
e
l
4
)
i
s:
E
ffo
r
t
=
α
+
β
1
C
ontract Frame
+
β
2
Expecte
d
D
i
sappo
i
ntmen
t
+
β
3
Perce
iv
e
d
Fa
i
rness
+
ε
wh
ere, E
ff
ort = part
i
c
i
pants’ e
ff
ort c
h
o
i
ces
C
ontract Frame
=
1
f
or Bonus con
di
t
i
on, 0
f
or Pena
l
ty con
di
t
i
o
n
E
xpecte
d
D
i
sappo
i
ntment = part
i
c
i
pants’ rat
i
ng o
f
t
h
e
di
sappo
i
ntment t
h
ey expecte
d
t
o
e
xper
i
ence
if
t
h
ey
did
not rece
i
ve t
h
e
b
onus (Bonus con
di
t
i
on) or
h
a
d
to pay t
he
p
enalt
y
(Penalt
y
condition
)
Perce
i
ve
d
Fa
i
rness = part
i
c
i
pants’ rat
i
ng o
f
t
h
e
f
a
i
rness o
f
t
h
e
i
r contrac
t
E
FFECTS
E
E
OF
C
F
ONTRACT
F
T
RAME
F
F
ON
E
N
MPLOYEE
EE
E
E
FFORT
E
E
16
5
E
ff
ort,
b
ut
i
t a
l
so
h
as a strong, separate
i
n
fl
uence on E
ff
ort w
i
t
hi
n eac
h
o
f
t
h
e Bonus
a
n
d
Pena
l
ty con
di
t
i
ons. T
h
ese resu
l
ts are cons
i
stent w
i
t
h
t
h
e top pat
h
i
n F
i
gure 1.
The third re
g
ression shows that Perceived Fairness also mediates the effect of
C
ontract Frame on E
ff
ort (
b
ottom pat
h
o
f
F
i
gure 1),
b
ut
i
n t
h
e oppos
i
te
di
rect
i
on o
f
Expecte
d
D
i
sappo
i
ntment. Cons
i
stent w
i
t
h
t
h
e rec
i
proc
i
ty
d
ocumente
d
ear
li
er
i
n H3,
P
erceived Fairness has a stron
g
positive effect (
t
=
3.87, p
<
.001) on Effort, indicat-
i
ng t
h
at
hi
g
h
er Perce
i
ve
d
Fa
i
rness y
i
e
ld
s
hi
g
h
er E
ff
ort. In a
ddi
t
i
on, a
f
ter stat
i
st
i
ca
ll
y
c
ontro
lli
ng
f
or t
h
e e
ff
ect o
f
Perce
i
ve
d
Fa
i
rness, t
h
e e
ff
ect o
f
Contract Frame o
n
Effort was actuall
y
stron
g
er (
t
=
−
3
.46,
p
<
.002) than it was in the first re
g
ressio
n
(
t
=
−
2
.
23,
p
=
.029) w
h
en Perce
i
ve
d
Fa
i
rness was om
i
tte
d
f
rom t
h
e regress
i
on.
Th
at
i
s,
i
nc
l
u
di
ng Perce
i
ve
d
Fa
i
rness
i
n t
h
e regress
i
on
d
oes not wea
k
en t
h
e e
ff
ect
o
f Contract Frame on Effort as is the case in most mediation anal
y
sis, but rather
strengt
h
ens
i
t. T
hi
s
i
s
b
ecause, a
l
t
h
oug
h
b
ot
h
Expecte
d
D
i
sappo
i
ntment an
d
Per-
c
e
i
ve
d
Fa
i
rness me
di
ate t
h
e e
ff
ect o
f
Contract Frame on E
ff
ort, t
h
ey
d
o so
i
n oppo
-
site directions
.
7
A final important observation re
g
ardin
g
the third re
g
ression is the
su
b
stant
i
a
l
i
ncrease
i
n t
h
e a
dj
uste
d
R
2
from .0
6
in the first regression to .22 in the
t
hi
r
d
regress
i
on, w
hi
c
h
i
n
di
cates t
h
at
i
n a
ddi
t
i
on to me
di
at
i
ng t
h
e e
ff
ect o
f
Contract
Frame on Effort, Perceived Fairness had a se
p
arate effect on Effort within each o
f
t
h
e
C
ontract Frame con
di
t
i
ons
.
A
l
t
h
oug
h
Perce
i
ve
d
Fa
i
rness was
hi
g
h
er
i
n t
h
e Bonus con
di
t
i
on t
h
an
i
n t
h
e
P
enalt
y
condition (H
5
) and it affected Effort as predicted in H3 (i.e., hi
g
her per-
c
e
i
ve
d
f
a
i
rness
l
e
d
to greater e
ff
ort), t
hi
s e
ff
ect (
d
ep
i
cte
d
i
n t
h
e
b
ottom pat
h
o
f
F
i
gure 1) was ent
i
re
l
y
d
om
i
nate
d
b
y t
h
e oppos
i
ng e
ff
ect
d
ep
i
cte
d
i
n t
h
e top pat
h
o
f
Fi
g
ure 1. Taken to
g
ether, the results of the first three re
g
ressions su
gg
est that, while
rec
i
proc
i
ty cause
d
part
i
c
i
pants to c
h
oose more e
ff
ort
i
n t
h
e Bonus con
di
t
i
on t
h
an
i
n
t
h
e Pena
l
ty con
di
t
i
on (t
hi
r
d
regress
i
on), t
hi
s e
ff
ect was
d
om
i
nate
d
b
y t
h
e stronger
opposin
g
effect of loss aversion (second re
g
ression), which caused participants to
ch
oose more e
ff
ort un
d
er t
h
e pena
l
ty contract (
fi
rst regress
i
on).
T
h
e
f
ourt
h
regress
i
on, w
hi
c
h
i
nc
l
u
d
e
d
b
ot
h
Perce
i
ve
d
Fa
i
rness an
d
Expecte
d
D
isappointment as explanator
y
variables, increased the ad
j
usted
R
2
to .48, versus .22
w
h
en on
l
y Perce
i
ve
d
Fa
i
rness was
i
nc
l
u
d
e
d
i
n t
h
e t
hi
r
d
regress
i
on, an
d
.31 w
h
en
on
l
y Expecte
d
D
i
sappo
i
ntment was
i
nc
l
u
d
e
d
i
n t
h
e secon
d
regress
i
on. As s
h
own
i
n
T
able 3, the effects of both Perceived Fairness and Ex
p
ected Disa
pp
ointment on
E
ff
ort rema
i
n stat
i
st
i
ca
ll
y s
i
gn
ifi
cant
i
n t
h
e expecte
d
di
rect
i
ons
i
n t
h
e
f
ourt
h
regress
i
on.
Th
ese resu
l
ts con
fi
rm t
h
e
i
nterpretat
i
on o
ff
ere
d
a
b
ove, w
hi
c
h
was
b
ase
d
on t
h
e com-
bined results of the first three re
g
ressions. Specificall
y
, while both Perceived Fair-
n
ess an
d
Expecte
d
D
i
sappo
i
ntment are
i
mportant
f
actors
i
n exp
l
a
i
n
i
ng part
i
c
i
pants’
eff
ort
l
eve
l
s, t
h
e e
ff
ect o
f
Perce
i
ve
d
Fa
i
rness
i
s
d
om
i
nate
d
b
y t
h
e more power
f
u
l
opposin
g
effect of Expected Disappointment
.
8
We also note that a mar
g
inall
y
si
g
ni
-
fi
cant e
ff
ect o
f
Contract Frame on E
ff
ort
(
t
=
−
1.95
,
p
=
.056) remains after controllin
g
f
or
b
ot
h
Perce
i
ve
d
Fa
i
rness an
d
Expecte
d
D
i
sappo
i
ntment
i
n t
h
e
f
ourt
h
regress
i
on,
su
gg
estin
g
that, despite the hi
g
h ad
j
usted
R
2
(.48), there is still some other force not
f
u
ll
y capture
d
i
n our Expecte
d
D
i
sappo
i
ntment measure t
h
at cause
d
part
i
c
i
pants to
ch
oose more e
ff
ort un
d
er t
h
e pena
l
ty contract t
h
an un
d
er t
h
e
b
onus contract.
9
166 Ex
p
erimental Business Research Vol. II
5
.DI
SCUSS
I
O
N
Our findin
g
s can be summarized as follows: Consistent with Luft (1994), we find
th
at emp
l
oyees genera
ll
y pre
f
er
b
onus contracts to econom
i
ca
ll
y equ
i
va
l
ent pena
l
ty
contracts. We exten
d
Lu
f
t’s stu
d
y
b
y
d
emonstrat
i
ng t
h
at emp
l
oyee e
ff
ort
i
s
hi
g
h
er
under a penalt
y
contract than an economicall
y
equivalent bonus contract. Our ana-
l
ys
i
s
d
emonstrates t
h
at t
hi
s
fi
n
di
ng
i
s t
h
e resu
l
t o
f
two e
ff
ects t
h
at wor
k
i
n oppos
i
te
di
rect
i
ons
,
w
h
ere t
h
e
fi
rst e
ff
ect
d
om
i
nates t
h
e secon
d
. T
h
e
fi
rst e
ff
ect
i
s
d
ue to
l
oss
aversion, which makes emplo
y
ees more averse to havin
g
to pa
y
a penalt
y
than to not
r
ece
i
v
i
ng a
b
onus, an
d
causes t
h
em to c
h
oose more e
ff
ort un
d
er t
h
e pena
l
ty contract.
T
h
e secon
d
e
ff
ect re
fl
ects rec
i
proc
i
ty, w
hi
c
h
causes emp
l
oyees w
h
o cons
id
er t
h
e
i
r
contracts to be fairer to choose more effort. Because emplo
y
ees
g
enerall
y
perceived
th
e
b
onus contract to
b
e
f
a
i
rer t
h
an t
h
e pena
l
ty contract, rec
i
proc
i
ty cause
d
emp
l
oy-
ees to c
h
oose more e
ff
ort un
d
er t
h
e
b
onus contract. We
fi
n
d
support
f
or
b
ot
h
o
f
t
h
ese
o
pposin
g
effects, with reciprocit
y
dampenin
g
, but not completel
y
offsettin
g
, the
d
om
i
nant e
ff
ect o
f
l
oss avers
i
on on emp
l
oyee e
ff
ort.
O
ur resu
l
ts
h
ave
i
mportant
i
mp
li
cat
i
ons
f
or un
d
erstan
di
ng w
h
y
i
n pract
i
ce most
actual contracts are framed as bonus contracts. Under conventional economic ana-
l
ys
i
s,
i
t
i
s
i
rre
l
evant w
h
et
h
er a contract
i
s
f
rame
d
i
n
b
onus terms or pena
l
ty terms.
However, Lu
f
t argue
d
t
h
at
b
ecause emp
l
oyees pre
f
er
b
onus contracts, t
h
ey wou
ld
demand hi
g
her pa
y
ments from firms to accept penalt
y
contracts. Thus, assumin
g
no
o
t
h
er
diff
erent
i
a
l
cost
b
etween o
ff
er
i
ng a
b
onus or pena
l
ty contract,
fi
rms max
i
m
i
ze
p
ro
fi
ts
b
y o
ff
er
i
ng
b
onus contracts. However, our resu
l
ts s
h
ow t
h
at
fi
rms
d
o
b
ear a
cost for offerin
g
bonus contracts rather than penalt
y
contracts. That is, emplo
y
ees
c
h
oose more e
ff
ort un
d
er pena
l
ty contracts, so o
ff
er
i
ng a
b
onus contract g
i
ves up
th
e
b
ene
fi
t o
f
t
hi
s
i
ncrease
d
e
ff
ort. Consequent
l
y,
i
t
i
s no
l
onger c
l
ear t
h
at o
ff
er
i
ng
a bonus contract maximizes firm
p
rofit.
Of
course, t
hi
s
b
r
i
ngs us
b
ac
k
to t
h
e or
i
g
i
na
l
quest
i
on o
f
w
h
y
i
n pract
i
ce most
actua
l
contracts are
b
onus contracts. Convent
i
ona
l
econom
i
c t
h
eory o
ff
ers no exp
l
a-
nation because it predicts indifference between bonus contracts and economicall
y
equ
i
va
l
ent pena
l
ty contracts. G
i
ven our resu
l
ts, Lu
f
t’s (1994) exp
l
anat
i
on t
h
at we
ob
serve
b
onus contracts
i
n t
h
e wor
ld
b
ecause emp
l
oyees pre
f
er t
h
em cannot
b
e
a complete explanation because the attendant lo
g
ic fails to reco
g
nize the cost of
f
orgone e
ff
ort assoc
i
ate
d
w
i
t
h
b
onus contracts. In our v
i
ew, a
b
etter an
d
more
compre
h
ens
i
ve exp
l
anat
i
on
i
s
lik
e
l
y to
b
e
f
oun
d
on
l
y t
h
roug
h
a
ddi
t
i
ona
l
researc
h
desi
g
ned to understand the full ran
g
e of costs and benefits associated with each t
y
pe
of
contract.
Al
ong w
i
t
h
Lu
f
t’s (1994) stu
d
y, t
h
e resu
l
ts o
f
t
hi
s stu
d
y c
l
ear
l
y s
h
ow t
h
at con-
ventional economic anal
y
sis fails to capture either emplo
y
ees’ preferences for bonus
contracts or t
h
e
f
act t
h
at pena
l
ty contracts mot
i
vate
hi
g
h
er e
ff
ort. T
h
us, we a
l
rea
dy
k
now t
h
at t
h
ere are
i
mportant costs an
d
b
ene
fi
ts assoc
i
ate
d
w
i
t
h
i
ncent
i
ve con-
t
racts be
y
ond those t
y
picall
y
assumed to exist in conventional economic anal
y
sis.
W
e suspect t
h
ere are st
ill
ot
h
er costs assoc
i
ate
d
w
i
t
h
o
ff
er
i
ng pena
l
ty contracts, or
b
ene
fi
ts assoc
i
ate
d
w
i
t
h
o
ff
er
i
ng
b
onus contracts, t
h
at are not yet re
fl
ecte
d
i
n any o
f
E
FFECTS
E
E
OF
C
F
ONTRACT
F
T
RAME
F
F
ON
E
N
MPLOYEE
EE
E
E
FFORT
E
E
167
the currentl
y
available explanations for wh
y
penalt
y
contracts are rarel
y
observed in
practice. For example, it ma
y
be that emplo
y
ees have wa
y
s to retaliate a
g
ainst a firm
w
h
o o
ff
ers t
h
em a pena
l
ty contract ot
h
er t
h
an to w
i
t
hh
o
ld
e
ff
ort. In our exper
i
ment,
withholdin
g
effort was the onl
y
possible means of retaliation a
g
ainst the firm. How-
e
ver, withholdin
g
effort also increased the chance of havin
g
to pa
y
the penalt
y
, and
t
h
ere
f
ore emp
l
oyees w
h
o were mot
i
vate
d
b
y
l
oss avers
i
on to avo
id
t
h
e pena
l
ty
h
a
d
n
o choice but to bear the hi
g
her cost of choosin
g
hi
g
her effort.
I
n contrast, in some actual work settin
g
s, emplo
y
ees could choose to work hard
to avo
id
t
h
e pena
l
ty
j
ust as t
h
ey
did
i
n our exper
i
ment,
b
ut t
h
en qu
i
t t
h
e
i
r
j
o
b
or ta
k
e
o
ther retaliator
y
actions a
g
ainst the firm that would benefit the emplo
y
ee at the
e
xpense of the firm. If firms anticipate that such emplo
y
ee retaliation will be a likel
y
c
onsequence o
f
us
i
ng pena
l
ty contracts, a cost/
b
ene
fi
t ana
l
ys
i
s may
l
ea
d
t
h
em to
c
onclude that usin
g
bonus contracts is likel
y
to maximize profits in the lon
g
run.
Alternativel
y
, in settin
g
s where emplo
y
ees have other options for extractin
g
m
onetary
b
ene
fi
ts (
f
or examp
l
e emp
l
oyee t
h
e
f
t), emp
l
oyees may
i
n
f
act w
i
t
hh
o
ld
e
ffort (i.e., not exert more effort under a penalt
y
contract than a bonus contract),
but then extract monetar
y
benefits throu
g
h other means to make up for the for
g
one
i
ncent
i
ve pay (Green
b
erg 1990). In t
hi
s case, t
h
ere wou
ld
b
e an extra cost,
b
ut no
o
ffsettin
g
benefit, associated with usin
g
a penalt
y
contract. Consequentl
y
, firms
would likel
y
maximize profits b
y
offerin
g
bonus contracts. Future research could
i
nvest
i
gate w
h
et
h
er suc
h
ot
h
er potent
i
a
l
costs o
f
us
i
ng pena
l
ty contracts can
h
e
l
p
e
xplain wh
y
bonus contracts are t
y
picall
y
observed in practice.
ACKNOWLEDGMEN
T
We appreciate helpful comments from an anon
y
mous reviewer, Jake Birnber
g
,
Ji
m Boatsman, Larry Brown, Bryan C
h
urc
h
, Harry Evans, Yu
h
c
h
ang Hwang, Kat
h
ry
n
K
adous, Steve Kaplan, Ed O’Donnell, Case
y
Rowe, Krist
y
Towr
y
, Bill Waller and
worksho
p
p
artici
p
ants at the Second Asian Conference on Ex
p
erimental Business
R
esearc
h
, t
h
e Amer
i
can Account
i
ng Assoc
i
at
i
on annua
l
meet
i
ng, Ar
i
zona State
Universit
y
, Emor
y
Universit
y
, and the Universit
y
of Pittsbur
g
h. We also thank Fred
J
acobs for providin
g
experimental participants and Frank Luo for helpin
g
conduct
t
h
e exper
i
ment. T
hi
s researc
h
was supporte
d
b
y grants
f
rom t
h
e Ro
bi
nson Co
ll
ege
o
f Business to Hannan and from the Katz
G
raduate
S
chool of Business to Hoffman
a
nd Moser
.
NOTES
1
A
recent stu
d
y
b
y Fre
d
er
i
c
k
son an
d
Wa
ll
er (2004) supports Lu
f
t’s (1994)
fi
n
di
ngs
i
n an exper
i
menta
l
s
ett
i
n
g
w
h
ere
fi
rm part
i
c
i
pants an
d
emp
l
o
y
ee part
i
c
i
pants
i
nteract. Spec
ifi
ca
lly
, emp
l
o
y
ees
d
eman
d
e
d
high
er expecte
d
pa
y
to accept an o
ff
er
f
rame
d
as a pena
l
t
y
contract versus an o
ff
er
f
rame
d
as a
b
onus
contract, and firms accommodated this emplo
y
ee loss aversion b
y
makin
g
hi
g
her offers in the penalt
y
contract
f
rame. We note t
h
at Lu
f
t
did
not
li
m
i
t
h
er exp
l
anat
i
on
f
or w
h
y emp
l
oyees pre
f
er
b
onus con-
t
racts to Ka
h
neman an
d
Tvers
k
y’s (1979) pure prospect-t
h
eory
d
e
fi
n
i
t
i
on o
f
l
oss avers
i
on. Nevert
h
e
l
ess,
168 Ex
p
erimental Business Research Vol. II
all
t
h
e re
l
ate
d
e
ff
ects s
h
e
d
escr
ib
e
d
are cons
i
stent w
i
t
h
t
h
e more genera
l
not
i
on o
f
l
oss avers
i
on w
hi
c
h
reflects the well-documented findin
g
in ps
y
cholo
gy
that the ne
g
ative response to penalties, losses,
punishment, etc. is
g
reater than the positive response to equivalent bonuses,
g
ains, rewards, etc. In
addi
t
i
on,
b
ecause a
ll
t
h
e
l
oss-avers
i
on re
l
ate
d
e
ff
ects
d
escr
ib
e
d
b
y Lu
f
t (1994) an
d
Fre
d
er
i
c
k
son an
d
Wa
ll
er (2004) cause emp
l
oyees to pre
f
er
b
onus contacts to pena
l
ty contracts, t
h
ey a
ll
l
ea
d
to Lu
f
t’s
conc
l
us
i
on t
h
at emp
l
o
y
ers max
i
m
i
ze pro
fi
t
by
o
ff
er
i
n
g
b
onus contracts.
2
I
t was made clear to participants that the
y
were required to pa
y
back an
y
penalt
y
amounts before
l
eavin
g
the room. An additional experimenter was posted at the door to ensure that no participant exited
t
h
e room
b
e
f
ore sett
li
ng t
h
e
i
r accounts w
i
t
h
t
h
e exper
i
ment’s paymaster, an
d
no part
i
c
i
pant attempte
d
to do so
.
3
T
his operationalization of effort is consistent with the a
g
enc
y
theor
y
definition of effort (Baiman 1982)
in that (1) participants had control over the effort level choice, (2) hi
g
her effort increased the prob-
abili
ty o
f
reac
hi
ng t
h
e target (
hi
g
h
) outcome, an
d
(3) part
i
c
i
pants
d
er
i
ve
d
di
sut
ili
ty
f
rom c
h
oos
i
ng a
hi
g
h
er e
ff
ort
l
eve
l
.
4
For example, choosin
g
effort level 1
y
ielded an expected pa
y
off of .30 ($30)
+
.70 ($20)
−
$0.50
=
$
22.50, while choosin
g
effort level 10
y
ielded an expected pa
y
off of .75 ($30)
+
.25 ($20)
−
$5
=
$
22.50
.
5
Th
e tota
l
num
b
er o
f
c
hi
ps
i
n eac
h
o
f
t
h
e 13
b
ags var
i
e
d
as necessary to create t
h
e exact outcome
pro
b
a
bili
ty
di
str
ib
ut
i
on correspon
di
ng to eac
h
e
ff
ort
l
eve
l
.
6
We also verified that the relation between Ex
p
ected Disa
pp
ointment and Effort was in the
p
redicted
d
irection, and that the path was not the opposite one. That is, it is not the case that
g
reater effort led to
g
reater
di
sappo
i
ntment. T
hi
s a
ddi
t
i
ona
l
test o
f
t
h
e causa
l
pat
h
i
s reporte
d
i
n
f
ootnote 8
.
7
Perce
i
ve
d
Fa
i
rness an
d
Expecte
d
D
i
sappo
i
ntment are not s
ig
n
ifi
cant
ly
corre
l
ate
d
w
i
t
h
eac
h
ot
h
er [Pearson
(Spearman) corre
l
at
i
on
=
−
.105
(
−
.
08
7
)
,
p
>
.
40
(
.
4
7
)
].
8
We also used structural equation modelin
g
to test the overall model depicted in Fi
g
ure 1. Under this
a
pproac
h
, a s
i
ng
l
e covar
i
ance matr
i
x
i
s create
d
an
d
use
d
to s
i
mu
l
taneous
l
y est
i
mate a
ll
li
n
k
s
i
n t
h
emo
d
e
l
(K
li
ne 1998). Resu
l
ts
f
rom t
h
e overa
ll
mo
d
e
l
are a
l
most
id
ent
i
ca
l
to t
h
e correspon
di
ng
i
n
di
v
id
ua
l
tests
reported for H2 – H
5
and RQ1 and RQ2. Specificall
y
, Expected Disappointment was hi
g
her under the
Penalt
y
contract and Perceived Fairness was hi
g
her under the Bonus contract. Both Expected Dis-
a
ppo
i
ntment an
d
Perce
i
ve
d
Fa
i
rness
h
a
d
a pos
i
t
i
ve e
ff
ect on E
ff
ort. T
h
e pat
h
coe
ffi
c
i
ents are equa
l
to
those reported in re
g
ression model 4 in Table 3 for Expected Disappointment to Effort (.
6
2), Perceived
Fa
i
rness to E
ff
ort (.48) an
d
Contract Frame to E
ff
ort (
−
1
.57). The primar
y
measure of fit for the
structural equation model is a Chi-square statistic, which tests the null h
y
pothesis that the proposed
model is a
g
ood fit for the data. For the model depicted in Fi
g
ure 1, the Chi-square is not statisticall
y
s
i
gn
ifi
cant
(
χ
2
= .000
,
p
=
.99
5
), indicating that the model is a good fit. To bolster confidence in our
i
nterpretat
i
on o
f
t
h
e causa
l
pat
h
, an a
l
ternat
i
ve mo
d
e
l
was spec
ifi
e
d
w
hi
c
h
reverse
d
t
h
e
di
rect
i
on
b
etween Expecte
d
D
i
sappo
i
ntment an
d
E
ff
ort. T
h
at
i
s, a
l
t
h
ou
gh
we
hy
pot
h
es
i
ze
d
t
h
at Expecte
d
D
i
s-
a
ppointment would result in hi
g
her Effort, a potential alternative explanation is that choosin
g
hi
g
her
e
ff
ort cause
d
part
i
c
i
pants to expect to
b
e more
di
sappo
i
nte
d
if
t
h
ey
h
a
d
to pay t
h
e pena
l
ty or
f
orgo t
h
e
b
onus. T
h
e nu
ll
h
ypot
h
es
i
s t
h
at t
h
e mo
d
e
l
i
s a goo
d
fi
t
f
or t
h
e
d
ata
i
s re
j
ecte
d
f
or t
h
e a
l
ternat
i
ve mo
d
e
l
(
χ
2
=
11.0
6,
p
<
.005), indicatin
g
that the alternative causal explanation is not tenable. A similar model
whi
c
h
reverse
d
t
h
e causa
l
di
rect
i
on
f
or Perce
i
ve
d
Fa
i
rness a
l
so was not tena
bl
e (
χ
2
=
23
.
14,
p
<
.
001).
9
We also ran a re
g
ression includin
g
all three independent variables included in the fourth re
g
ression and
all
re
l
ate
d
i
nteract
i
ons
(
R
2
=
.60). Results are consistent with those reported for the fourth regression in
t
h
at
b
ot
h
Expecte
d
D
i
sappo
i
ntment an
d
Perce
i
ve
d
Fa
i
rness rema
i
n stat
i
st
i
ca
ll
y s
i
gn
ifi
cant (
ps
<
.001
).
I
n addition, neither the 3-wa
y
interaction, nor the 2-wa
y
interactions between Contract Frame and
Perceived Fairness or Contract Frame and Expected Disappointment are statisticall
y
si
g
nificant. The
significant interaction between Perceived Fairness and Expected Disappointment (
t
=
−
3.76
,
p
<
.01
)
re
fl
ects a
di
m
i
n
i
s
hi
ng return to E
ff
ort w
h
en
b
ot
h
Expecte
d
D
i
sappo
i
ntment an
d
Perce
i
ve
d
Fa
i
rness are
high
, an
d
as suc
h
,
h
as no
i
mp
li
cat
i
ons
f
or t
h
e
i
nterpretat
i
on o
f
t
h
e resu
l
ts reporte
d
i
n t
h
e paper. F
i
na
lly
,
t
he effect of Contract Frame drops to nonsi
g
nificance when all interactions are included in the model,
suggest
i
ng t
h
at t
h
e rema
i
n
i
ng negat
i
ve e
ff
ect o
f
Contract Frame on E
ff
ort note
d
i
n t
h
e
f
ourt
h
regress
i
on
may re
fl
ect t
h
e
f
act t
h
at t
h
e mo
d
e
l
exc
l
u
d
e
d
t
h
e
i
nteract
i
on terms
.
E
FFECTS
E
E
OF
C
F
ONTRACT
F
T
RAME
F
F
ON
E
N
MPLOYEE
EE
E
E
FFORT
E
E
16
9
R
EFEREN
C
E
S
B
aker, G. P., M. C. Jensen, and K. J. Murph
y
. (1988). “Compensation and incentives: Practice vs.
t
h
eory.
”
Th
e Journa
l
o
f
Finance
.
43
(
3
)
:
5
93–616.
B
a
i
man, S. (1982). “Agency researc
h
i
n manager
i
a
l
account
i
ng: A survey.”
J
ourna
l
of Accounting Literature
1 (Sprin
g
): 1
6
1–213.
C
harness, C. and M. Rabin. (2002). “Understandin
g
social preferences with simple tests.” The Quarterl
y
Journal o
f
Economic
s
, 117(3), 817–869
.
Dems
ki
, J. S. an
d
G. A. Fe
l
t
h
am. (1978). “Econom
i
c
i
ncent
i
ves
i
n
b
u
d
getary contro
l
systems.” T
h
e
A
ccounting Review,
5
3(2), 336–3
5
9
.
Fehr, E., S. Gächter, and G. Kirchstei
g
er. (1997). “Reciprocit
y
as a contract enforcement device: Experi-
m
enta
l
e
vid
ence.” Econometr
i
ca
,
6
5(
4
)
, 833–860.
Fe
h
r, E., E. K
i
rc
hl
er, A. We
i
c
hb
o
ld
, an
d
S. Gäc
h
ter. (1998). “W
h
en soc
i
a
l
norms overpower compet
i
t
i
on:
Gif
t exc
h
an
g
e
i
n exper
i
menta
l
l
a
b
or mar
k
ets.”
J
ourna
l
of La
b
or Economic
s
, 16(2), 321–354.
Fehr, E., G. Kirchstei
g
er, and A. Riedl. (1993). “Does fairness prevent market clearin
g
? An experimental
i
nvestigation.
”
The Quarterly Journal o
f
Economic
s
,
108(2), 438–4
5
9.
Fe
l
t
h
am, G. an
d
J. X
i
e. (1994). “Per
f
ormance measure congru
i
ty an
d
di
vers
i
ty
i
n mu
l
t
i
-tas
k
pr
i
nc
i
pa
l/
a
g
ent relations.” The Accounting Review
,
69(3), 429–4
5
3.
F
rederickson, J. R. (1992). “Relative performance information: The effects of common uncertaint
y
and
c
ontract type on agent e
ff
ort.”
Th
e Accountin
g
Review, 67
(
4
)
, 647–669.
F
re
d
er
i
c
k
son, J. R. an
d
W. Wa
ll
er. (2004). Carrot or st
i
c
k
? Contract
f
ram
i
ng an
d
t
h
e use o
f
d
ec
i
s
i
on-
i
nfluencin
g
information in a principal–a
g
ent settin
g
. Workin
g
paper, Hon
g
Kon
g
Universit
y
of
Science and Technology
.
Goranson, R. E. and L. Berkowitz. (1966). “Reciprocity and responsibility reactions to prior help.”
Journa
l
of Persona
l
ity an
d
Socia
l
Psyc
h
o
l
ogy
,
3,
22
7–
232
.
Greenber
g
, J. (1978). “Effects of reward value and retaliative power on allocation decisions: Justice,
g
en-
e
rosit
y
or
g
reed?” Journal o
f
Personality and Social Psychology
,
36, 367–379
.
Green
b
erg, J. (1990). “Emp
l
oyee t
h
e
f
t as a react
i
on to un
d
erpayment
i
nequ
i
ty: T
h
e
hidd
en cost o
f
pay
cuts.
”
Journa
l
of App
l
ie
d
Psyc
h
o
l
ogy, 75
(
5
)
, 561–569
.
Greenber
g
, M. S. and D. Frisch. (1972). “Effect of intentionalit
y
on willin
g
ness to reciprocate a favor.”
J
ournal o
f
Experimental Social Psychology, 8, 99–111
.
H
annan, R. L., J. H. Kagel, and D. V. Moser. (2002). “Partial gift exchange in experimental labor markets:
I
mpact o
f
su
bj
ect popu
l
at
i
on
diff
erences, pro
d
uct
i
v
i
ty
diff
erences an
d
e
ff
ort requests on
b
e
h
av
i
or.”
J
ourna
l
of La
b
or Economics, 20
(
4
)
, 923–951
.
H
olmstrom, B. (1979). “Moral hazard and observabilit
y
.”
B
ell Journal o
f
Economics, 10(1), 74–91
.
H
o
l
mstrom, B.
(
1982
)
. “Mora
l
h
azar
d
i
n teams.”
B
e
ll
Journa
l
of Economics
,
13
(
2
)
, 324–340
.
H
o
l
mstrom, B. an
d
P. M
il
grom. (1991). “Mu
l
t
i
tas
k
pr
i
nc
i
pa
l
-agent ana
l
yses: Incent
i
ve contracts, asset
o
wnership, and
j
ob desi
g
n.” Journal o
f
Law, Economics, & Organization, 7, 24–
5
2.
Kahneman, D., J. L. Knetsch, and R. H. Thaler. (1986). “Fairness as a constraint on profit seeking:
ent
i
t
l
ements
i
n t
h
e mar
k
et.”
A
merican Economic Re
v
ie
w
, 76
(
4
)
, 728–741.
Ka
h
neman, D. an
d
A. Tvers
ky
. (1979). “Prospect t
h
eor
y
: An ana
ly
s
i
s o
f
d
ec
i
s
i
on ma
ki
n
g
un
d
er r
i
s
k
.”
E
co
n
o
m
et
r
ica
, 47, 2
6
3–291.
Kline, R. B. (1998). Principles and Practice of Structural E
q
uation Modeling. New York, NY: The
G
u
ilf
or
d
Press.
L
u
f
t, J. (1994). “Bonus an
d
pena
l
ty
i
ncent
i
ves: Contract c
h
o
i
ce
b
y emp
l
oyees,” Journa
l
of Accountin
g
a
n
d
Economic
s
,
18(2), 181–206
.
M
il
g
rom, P. and J. Roberts. (1992).
E
conomics, Or
g
anizations and Mana
g
ement
.
En
g
lewood Cliffs:
Prent
i
ce Ha
ll
.
Ra
bi
n, M. (1993). “Incorporat
i
n
g
f
a
i
rness
i
nto
g
ame t
h
eor
y
an
d
econom
i
cs.”
A
merican Economic Review
,
8
3(5), 1281–1302
.
Young, S. M. and B. Lewis. (199
5
). “Experimental incentive-contracting research in management
a
ccount
i
ng.” In R. H. As
h
ton an
d
A. H. As
h
ton, e
d
s.
J
u
d
gment an
d
Decision-Ma
k
ing Researc
h
i
n
Accounting an
d
Au
d
itin
g
. U.K.: Cambridge University Press: 55–75
.
M
ANAGERIAL
M
M
I
L
NCENTIVES
I
I
A
N
D
C
O
MPETITI
ON
1
7
1
1
7
1
C
h
apter 9
MANA
G
ERIAL IN
C
ENTIVE
S
AND
CO
MPETITI
O
N
R
ac
h
e
l
Croson
University of Pennsylvania
Ar
i
e
S
c
hi
nna
r
University of Pennsy
l
vania
Abs
tr
act
Thi
s paper exper
i
menta
ll
y tests t
h
e
i
mpact o
f
manager
i
a
l
i
ncent
i
ves on compet
i
t
i
ve
(mar
k
et) outcomes. We use a Cournot
d
uopo
l
y game to s
h
ow t
h
at w
h
en managers’
i
ncentives are based on the firm’s absolut
e
p
erformance (
p
rofits), collusion can b
e
s
usta
i
ne
d
. However, w
h
en managers’
i
ncent
i
ves are
b
ase
d
on t
h
e
fi
rm’s
r
e
l
ativ
e
per
-
f
ormance (t
h
e
i
r pro
fi
ts re
l
at
i
ve to t
h
e ot
h
er
fi
rm’s pro
fi
ts), t
hi
s
d
r
i
ves t
h
e mar
k
et to
the competitive and efficient outcome. These results su
gg
est that re
g
ulators need to
c
ons
id
er not on
l
y t
h
e num
b
er an
d
concentrat
i
on o
f
fi
rms
i
n an
i
n
d
ustry,
b
ut a
l
so t
h
e
m
anager
i
a
l
compensat
i
on sc
h
emes w
h
en
d
ec
idi
ng
h
ow muc
h
i
ntervent
i
on
i
s appro-
priate in a
g
iven industr
y
.
1. INTR
O
D
UC
TI
O
N
Th
e quest
i
on o
f
h
ow to mot
i
vate managers
i
n or
d
er to max
i
m
i
ze
fi
rm’s pro
fi
t
i
s an
i
mportant one,
b
ot
h
econom
i
ca
ll
y an
d
psyc
h
o
l
og
i
ca
ll
y. A
l
arge
li
terature exam
i
nes
the impact of mana
g
erial incentives on effort and performance, especiall
y
under
c
on
di
t
i
ons o
f
mora
l
h
azar
d
, w
h
ere t
h
ere ex
i
st pr
i
nc
i
pa
l
-agent pro
bl
ems. A n
i
ce
di
s-
c
uss
i
on an
d
rev
i
ew o
f
t
hi
s
i
ssue can
b
e
f
oun
d
i
n Pren
d
ergast (1999).
I
n contrast, we are interested in the impact of mana
g
erial incentives on collusive
outcomes o
f
fi
rms. T
h
us t
h
e exper
i
ment reporte
d
h
ere
b
u
ild
s on t
h
e wor
k
o
f
V
i
c
k
ers
(1985), Sklivas (1987) and Fershtman and Judd (1987). In these papers, the authors
theoreticall
y
explore the question of which incentive schemes firms mi
g
ht choose for
t
h
e
i
r managers, compar
i
ng t
h
ose w
hi
c
h
rewar
d
managers on
l
y on pro
fi
ts w
i
t
h
t
h
ose
t
h
at rewar
d
managers on some com
bi
nat
i
on o
f
pro
fi
ts an
d
revenue (S
kli
vas) or
p
rofits and sales volume (Vickers, Fershtman and Judd).
I
n t
hi
s paper, we w
ill
compare s
li
g
h
t
l
y
diff
erent compensat
i
on sc
h
emes; one
i
n
w
hi
c
h
managers are pa
id
as a
f
unct
i
on o
f
t
h
e pro
fi
ts o
f
t
h
e
fi
rm, an
d
a secon
d
w
h
ere
©
200
5
Sprin
g
er
.
P
r
inted
i
n the
N
etherlands.
A. Rapoport and
R
.
d
Zwick (
e
(
(
ds.
)
,
E
x
p
erimental Business Researc
h
,
Vol. II
,
1
7
1–1
8
4
.
172 Ex
p
erimental Business Research Vol. I
I
th
ey are compensate
d
b
ase
d
on t
h
e
i
r per
f
ormance re
l
at
i
ve to t
h
e ot
h
er
fi
rm
i
n t
h
e
i
r
i
n
d
ustr
y
. Un
lik
e t
h
e prev
i
ous papers, we w
ill
f
ocus not on t
h
e
i
ncent
i
ves
f
or t
h
e
fi
rms to choose one of these com
p
ensation schemes over another, but instead ex
p
eri-
m
enta
ll
y exp
l
ore
h
ow managers act w
h
en compensate
d
b
y eac
h
one.
We use a s
y
mmetr
i
c Cournot
d
uopo
ly
sett
i
n
g
w
i
t
h
per
f
ect
i
n
f
ormat
i
on an
d
no
uncertaint
y
. When mana
g
ers are compensated based on firm profits, the equilibrium
o
f
t
h
e game
i
nvo
l
ves co
ll
us
i
on. However, w
h
en managers are compensate
d
b
ase
d
on
r
e
l
at
i
ve pro
fi
ts, t
h
e equ
ilib
r
i
um
d
evo
l
ves to t
h
e per
f
ect
ly
compet
i
t
i
ve outcome. We
t
est this simple theor
y
in an experiment. Participants pla
y
a series of one-shot Courno
t
games
i
n a strangers
d
es
i
gn. We
fi
n
d
, cons
i
stent w
i
t
h
t
h
e t
h
eory, t
h
at
i
n
di
v
id
ua
l
s
p
ro
d
uce s
ig
n
ifi
cant
ly
l
ess quant
i
t
y
(are more co
ll
us
i
ve) w
h
en t
h
e
y
are compensate
d
based on their absolute performance than when the
y
are compensated based on their
r
e
l
at
i
ve per
f
ormance.
Th
ese resu
l
ts are use
f
u
l
on a num
b
er o
f
di
mens
i
ons. F
i
rst, t
h
e
y
prov
id
e ps
y
c
h
o-
lo
g
ical support for the theor
y
and its predictions. Second, the
y
hi
g
hli
g
ht the import-
ance o
f
fi
rms’ c
h
o
i
ce o
f
manager
i
a
l
i
ncent
i
ves to max
i
m
i
ze own pro
fi
t. F
i
na
ll
y, t
h
ey
highligh
t an a
ddi
t
i
ona
l
too
l
t
h
at re
g
u
l
ators ma
y
h
ave
i
n prevent
i
n
g
co
ll
us
i
on – t
h
e
y
c
an monitor executive com
p
ensation in addition to (or
p
erha
p
s instead of) out
p
ut in
m
ar
k
ets w
h
ere co
ll
us
i
on
i
s suspecte
d
.
Th
e rema
i
n
d
er o
f
t
hi
s c
h
apter
i
s or
g
an
i
ze
d
as
f
o
ll
ows. Sect
i
on II
i
ntro
d
uces t
h
e
Cournot settin
g
and derives predictions usin
g
the parameters from the experiment.
S
ect
i
on III presents t
h
e exper
i
menta
l
d
es
i
gn an
d
i
mp
l
ementat
i
on t
h
at we use
d
.
S
ect
i
on IV
d
escr
ib
es our resu
l
ts an
d
sect
i
on V conc
l
u
d
es.
2. COURNOT COMPETITION
T
his model incorporates the basic Cournot intuition. Two mana
g
ers work for
s
ymmetr
i
c
fi
rms an
d
f
ace a
k
nown (an
d
h
ere,
li
near)
d
eman
d
f
unct
i
on. Eac
h
f
aces
m
ar
gi
na
l
costs (
h
ere, constant) an
d
i
n
d
epen
d
ent
ly
c
h
ooses t
h
e quant
i
t
y
t
h
e
i
r
fi
rm
will produce. We assume that the mana
g
er chooses the quantit
y
his firm will pro-
d
uce so as to max
i
m
i
ze
hi
s own earn
i
ngs, g
i
ven
hi
s compensat
i
on pac
k
age. We
e
xam
i
ne two cases,
fi
rst, t
h
e case
i
n w
hi
c
h
eac
h
mana
g
er
i
s compensate
d
w
i
t
h
a
fr
act
i
o
n of his firm’s absolute profits and second, the case in which each mana
g
er
i
s compensate
d
b
ase
d
on
hi
s pro
fi
ts re
l
at
i
ve to t
h
e ot
h
er
fi
rm
.
I
n t
h
e exper
i
ment, we use t
h
e
f
o
ll
ow
i
n
g
parameters:
D
eman
d
f
unct
i
on: Pr
i
ce
=
$
100
−
(
q
1
+
q
2
)
Marginal cost:
$
10 per unit
Case A
.
T
h
e manager
i
s compensate
d
b
ase
d
on a
f
ract
i
on o
f
hi
s
fi
rm’s pro
fi
ts;
i
n
t
he experiment he earns the firm’s profits divided by
$
1000. Thus for each
$
1000 of
fi
rm profits, he earns $1. Mana
g
er
i
thus maximizes his earnin
g
s b
y
solvin
g
the
f
o
ll
ow
i
ng pro
bl
em
.
M
ANAGERIAL
M
M
I
L
NCENTIVES
I
I
A
N
D
C
O
MPETITI
ON
173
Ma
x
q
i
{
q
i
*
[
(100
−
q
i
−
q
j
q
)
−
10]} / 1000.
T
a
ki
n
g
t
h
e ot
h
er
fi
rm’s pro
d
uct
i
on as
gi
ven, t
hi
s
yi
e
ld
s
q
i
*
=
q
j
*
=
30,
t
h
e c
l
ass
i
c Cournot equ
ilib
r
i
um outcome.
1
Note t
h
at t
hi
s
l
eve
l
o
f
pro
d
uct
i
o
n
yields
$
900 of firm profits, and thus 90 cents of profit for each manager in the
ex
p
eriment.
2
C
ase B
.
Here, t
h
e manager
i
s compensate
d
b
ase
d
not on
hi
s a
b
so
l
ute pro
fi
t
b
ut
b
ase
d
on
hi
s pro
fi
t re
l
at
i
ve to t
h
e ot
h
er manager. In our exper
i
ment, we
i
mp
l
ement
this in the followin
g
wa
y.
• If both firms earn the same amount of profit, each earns $1 in mana
g
erial
compensat
i
on.
•I
f
one
fi
rm earns more pro
fi
t t
h
an anot
h
er, t
h
e manager o
f
t
h
e more pro
fi
ta
bl
e
firm earns $2 in mana
g
erial compensation, and the mana
g
er of the less profitable
firm earns
$
0 in managerial compensation.
3
N
ote
fi
rst t
h
at t
h
e Cournot outcome a
b
ove
i
s no
l
onger an equ
ilib
r
i
um. I
f
eac
h
firm produces 30 units, then each firm earns
$
900 of profit and each manager earn
s
$
1 (since both firms have the same profit). However, a
g
iven mana
g
er can profitabl
y
d
ev
i
ate
f
rom t
hi
s outcome, pro
d
uc
i
ng 31 un
i
ts o
f
output,
d
ecreas
i
ng
hi
s
fi
rm’s pro
fi
t
to $899 but decreasing the profit of the other firm to $870. Since his firm is now
m
ore profitable than the other firm, he earns $2 of mana
g
erial compensation while
the other manager earns
$
0
.
T
hi
s process cont
i
nues unt
il
b
ot
h
fi
rms are pro
d
uc
i
ng t
h
e per
f
ect
l
y compet
i
t
i
ve
output of 45 units, char
g
in
g
a price equal to mar
g
inal cost of $10 and earnin
g
zero
profits. Each manager thus earns
$
1. At this point, no manager wants to increase
their production further. Increasing a firm’s production to 4
6
units results in a profit
o
f
−
46 for this firm and onl
y
−
45
for the competitor, thus no mana
g
er wants to
i
ncrease (or
d
ecrease) t
h
e
i
r pro
d
uct
i
on
f
rom t
hi
s po
i
nt
.
4
Two prev
i
ous exper
i
ments
h
ave teste
d
b
e
h
av
i
or
i
n sett
i
n
g
s re
l
ate
d
to t
hi
s one. In
P
otters, Rockenbach and Sadrieh (2004) the authors run an ex
p
eriment in which
m
anagers are compensate
d
b
ase
d
on re
l
at
i
ve pro
d
uct
i
v
i
ty. However, t
h
e
i
r
f
ocus
i
s on
t
h
e extent to w
hi
c
h
t
h
e a
g
ents (mana
g
ers) co
ll
u
d
e to ta
k
e a
d
vanta
g
e o
f
t
h
e pr
i
nc
i
pa
l
s
(firms) when compensated in this wa
y
. In our relative compensation treatment, there
i
s no
b
ene
fi
t
f
rom suc
h
co
ll
us
i
on; t
h
e tota
l
to
b
e pa
id
to managers
i
s
fi
xe
d
. A secon
d
paper, Huc
k
, Mu
ll
er an
d
Normann (
f
ort
h
com
i
n
g
),
di
rect
ly
tests t
h
e pre
di
ct
i
ons o
f
t
h
e
V
ickers/Fershtman and Judd models in which firms choose com
p
ensation schemes
(e
i
t
h
er
j
ust pro
fi
ts or pro
fi
ts an
d
sa
l
es) an
d
managers c
h
oose quant
i
t
i
es
i
n response to
174 Ex
p
erimental Business Research Vol. I
I
th
ose contracts. Our paper
i
s a s
i
mp
l
er vers
i
on (exam
i
n
i
ng
j
ust t
h
e managers’
act
i
ons), an
d
exam
i
nes a
diff
erent compensat
i
on sc
h
eme (re
l
at
i
ve pro
fi
ts rat
h
er t
h
an
s
ales volume).
3
. EXPERIMENTAL DE
S
I
G
N AND IMPLEMENTATI
ON
W
e test t
h
e pre
di
ct
i
ons o
f
t
hi
s t
h
eory us
i
ng an exper
i
ment
i
nvo
l
v
i
ng Cournot com-
p
et
i
t
i
on. Man
y
prev
i
ous researc
h
ers
h
ave teste
d
Cournot compet
i
t
i
on exper
i
menta
lly
(see, for example, Holt 199
5
for a review), startin
g
with Fouraker and Sie
g
el (1963).
Th
ese exper
i
ments
h
ave
f
oun
d
t
h
at part
i
c
i
pants o
f
ten p
l
ay Cournot equ
ilib
r
i
a w
h
en
th
e num
b
er o
f
compet
i
tors
i
s su
ffi
c
i
ent
ly
sma
ll
(2 an
d
somet
i
mes 3) an
d
w
h
en t
h
e
y
have the opportunit
y
to learn the
g
ame (repeated pla
y
).
We
w
ant an en
vi
ronment
i
n
whi
c
h
co
ll
us
i
on occurs
i
n t
h
e
b
ase
li
ne case so as to
sh
ow we can ma
k
e
i
t
di
sappear w
h
en mana
g
ers are compensate
d
b
ase
d
on re
l
at
i
ve
p
rofits. Thus we will use the duopol
y
settin
g
in our experiment with perfect and
s
tat
i
onary
i
n
f
ormat
i
on a
b
out t
h
e
d
eman
d
f
unct
i
on,
b
ot
h
compet
i
tor’s (constant)
m
ar
gi
na
l
costs, an
d
a repeate
d
g
ame sett
i
n
g.
O
ur ex
p
eriment involved 91
p
artici
p
ants: 43 in the baseline treatment and 48 in
th
e re
l
at
i
ve payment treatment. Part
i
c
i
pants were recru
i
te
d
f
rom t
h
e un
d
ergra
d
uate
p
opu
l
at
i
on at t
h
e Un
i
vers
i
t
y
o
f
Penns
yl
van
i
a, an
d
were to
ld
t
h
at t
h
e
y
cou
ld
part
i
-
c
ipate in an experiment in which the
y
would keep their earnin
g
s. The experiment
was run
b
y
h
an
d
,
i
n a
l
arge c
l
assroom at t
h
e Un
i
vers
i
ty. Part
i
c
i
pants were seate
d
s
u
ffi
c
i
ent
ly
f
ar apart t
h
at t
h
e
y
cou
ld
not see t
h
e
d
ec
i
s
i
ons o
f
ot
h
ers.
P
articipants were brou
g
ht into the lab and
g
iven a $5 show-up fee. Instructions
were
h
an
d
e
d
out an
d
rea
d
a
l
ou
d
. A copy o
f
t
h
e
i
nstruct
i
ons can
b
e
f
oun
d
i
n Appen-
di
x A. T
h
e
i
nstruct
i
ons
i
nc
l
u
d
e
d
d
eta
il
s o
f
t
h
e part
i
c
i
pants’ compensat
i
on sc
h
emes
which differed between the treatments. Each participant represented a mana
g
e
r
w
h
ose
fi
rm competes
i
n a
d
uopo
li
st
i
c mar
k
et, pro
d
uc
i
ng goo
d
s t
h
at are per
f
ect
s
u
b
st
i
tutes. Part
i
c
i
pants were t
h
en ran
d
om
ly
matc
h
e
d
, an
d
were as
k
e
d
to ma
k
e a
p
roduction (quantit
y
) decision in the Cournot settin
g
. Each mana
g
er could choose
th
e quant
i
ty t
h
ey w
i
s
h
e
d
t
h
e
i
r
fi
rm to pro
d
uce, an
d
t
h
at c
h
o
i
ce
i
n com
bi
nat
i
on w
i
t
h
th
e
i
r counterpart’s c
h
o
i
ce
d
eterm
i
ne
d
t
h
e
i
r an
d
t
h
e
i
r counterpart’s pro
fi
ts. T
h
e
p
arameters for the ex
p
eriment were as described above.
P
art
i
c
i
pants p
l
aye
d
t
h
e game e
i
g
h
t or n
i
ne t
i
mes,
d
epen
di
ng on t
h
e s
i
ze o
f
t
h
e
g
roup t
h
at
h
a
d
arr
i
ve
d
i
n t
h
e
l
a
b
. For eac
h
i
terat
i
on, t
h
e
y
were pa
i
re
d
a
g
a
i
nst
a
different counterpart (stran
g
ers desi
g
n) with no overlap. No individual met the same
c
ounterpart more t
h
an once
i
n t
h
e exper
i
ment. A
f
ter eac
h
i
terat
i
on, t
h
e part
i
c
i
pants
were to
ld
t
h
e
i
r
fi
rm’s pro
fi
ts, t
h
e
i
r counterpart’s
fi
rm’s pro
fi
ts, an
d
t
h
e
i
r own earn-
i
n
g
s
.
5
In the baseline treatment,
p
artici
p
ants were
p
aid based on their firm’s absolute
p
ro
fi
ts earne
d
over t
h
e ent
i
re exper
i
ment. In t
h
e re
l
at
i
ve payment treatment, par-
t
i
c
i
pants’ earn
i
ngs were
d
eterm
i
ne
d
b
y compar
i
ng t
h
e
i
r
fi
rm’s pro
fi
ts re
l
at
i
ve to
their counter
p
art’s
p
rofits in each round (as described above), and summed over the
r
ounds that they played. Average earnings in the experiment were
$
12.63 in th
e
M
ANAGERIAL
M
M
I
L
NCENTIVES
I
I
A
N
D
C
O
MPETITI
ON
17
5
baseline treatment and
$
13.72 in the relative compensation treatment, including the
show-up fee, and the experiment lasted about 45 minutes.
4. RESULTS
We com
p
are behavior in this ex
p
eriment to the two e
q
uilibrium
p
redictions. In the
b
ase
li
ne treatment, we pre
di
ct t
h
at part
i
c
i
pants w
ill
c
h
oose t
h
e Cournot quant
i
ty
(30). In t
h
e re
l
at
i
ve compensat
i
on treatment, we pre
di
ct t
h
at part
i
c
i
pants w
ill
c
h
oose
the competitive quantit
y
(4
5
). Thus we predict that quantities chosen will be hi
g
her
w
h
en managers are compensate
d
b
ase
d
on re
l
at
i
ve pro
fi
ts t
h
an w
h
en t
h
ey are com-
pensate
d
b
ase
d
on a
b
so
l
ute pro
fi
ts
.
These predictions were supported b
y
the data. The avera
g
e quantit
y
produced in
t
h
e
b
ase
li
ne treatment was 34.3, on
l
y s
li
g
h
t
l
y
hi
g
h
er t
h
an t
h
e equ
ilib
r
i
um pre
di
ct
i
on
o
f 30. The avera
g
e quantit
y
produced in the relative compensation treatment as 43.
6
,
o
nl
y
sli
g
htl
y
lower than the equilibrium prediction of 4
5
.
S
i
nce we
h
ave mu
l
t
i
p
l
e o
b
servat
i
ons
f
or eac
h
part
i
c
i
pant, we
fi
rst ca
l
cu
l
ate
e
ac
h
person’s avera
g
e pro
d
uct
i
on over t
h
e roun
d
s
h
e p
l
a
y
e
d
. F
ig
ure 1
g
rap
h
s t
h
e
d
istribution of those productions in the two treatments, arran
g
ed in increasin
g
order
.
A t-test compar
i
ng t
h
ese
di
str
ib
ut
i
ons
fi
n
d
s a s
i
gn
ifi
cant
diff
erence
b
etween t
h
em
(
p
<
.
0001)
.
We also report the results of an OLS re
g
ression of quantities chosen, usin
g
each
per
i
o
d
’s o
b
servat
i
on. We contro
l
f
or
i
n
di
v
id
ua
l
e
ff
ects, sess
i
on e
ff
ects, an
d
t
h
e
per
i
o
d
num
b
er (repet
i
t
i
on). Resu
l
ts are s
h
own
i
n Ta
bl
e 1, a
b
ove.
There is a si
g
nificant difference between the two treatments; in particular, the
quant
i
ty pro
d
uce
d
i
s s
i
gn
ifi
cant
l
y
l
ower
i
n t
h
e
b
ase
li
ne treatment t
h
an
i
n t
h
e re
l
at
i
ve
compensat
i
on treatment. In a
ddi
t
i
on, we a
l
so see a sma
ll
b
ut s
ig
n
ifi
cant coe
ffi
c
i
ent
o
n the period number. Quantities tend to increase over time, su
gg
estin
g
that particip-
a
nts may
b
e try
i
ng to co
ll
u
d
e
i
n ear
l
y roun
d
s,
b
ut converg
i
ng towar
d
equ
ilib
r
i
um
o
nce t
h
e
y
exper
i
ence t
h
e
g
ame
.
6
While comparative-statics of this experiment support the theor
y
’s predictions,
t
h
e
l
eve
l
s are not qu
i
te as pre
di
cte
d
. T
h
at
i
s, w
hil
e managers pro
d
uce more un
d
er
re
l
at
i
ve compensat
i
on t
h
an un
d
er a
b
so
l
ute compensat
i
on (t
h
e
b
ase
li
ne), t
h
ey
d
on’t
p
roduc
e
enou
g
h more. The coefficient on treatment in the above re
g
ression is si
g
-
nifi
cant
l
y greater t
h
an t
h
e pre
di
cte
d
coe
ffi
c
i
ent o
f
−
1
5
(
p
<
.01). T
h
us we
i
nterpre
t
our resu
l
ts as qua
lifi
e
d
support
f
or t
h
e t
h
eory
.
A further anal
y
sis investi
g
ates the time-trend of production decisions. Althou
g
h
e
ac
h
per
i
o
d
represents a one-s
h
ot game, part
i
c
i
pants
i
n t
h
e exper
i
ment may
b
e
l
earn
i
ng
h
ow to p
l
ay, an
d
b
e
h
av
i
or may converge towar
d
or away
f
rom t
h
e equ
ilib
-
rium. Fi
g
ure 2
g
raphs avera
g
e quantities produced in each round of the
g
ame in the
two treatments. Note t
h
e axes
i
n t
hi
s
fi
gure; t
h
e m
i
n
i
mum
i
s 30, w
hi
c
h
i
s t
h
e pre
di
cte
d
C
ournot production. The maximum is 45, which is the predicted relative production.
As can be seen, there is a definite trend of increasin
g
quantities in the relative
payment treatment. T
h
e tren
d
i
n t
h
e
b
ase
li
ne (Cournot) treatment
i
s
l
ess c
l
ear.
176 Ex
p
erimental Business Research Vol. I
I
Table 1. OLS Regression o
f
Quantity Chosen
Estimate t-statistic p-value
Intercept 36.78 66.11 0.0000
B
ase
lin
e
Tr
eat
m
e
n
t
−
4.65 18.20 0.0001
Period 0.444 4.46 0.0001
Session dummies yes
Individual dummies yes
N
7
58
R
2
(ad
j
.) .4765
Fi
g
ure 1. Each Participant’s Avera
g
e Quantities Chosen.
Baseline
(
Cournot
)
Treatment
0
10
2
0
3
0
40
5
0
6
0
Quantity Chosen
R
elat
i
ve Pa
y
ment Treatmen
t
0
10
20
30
40
50
60
Quantit
y
Chosen
M
ANAGERIAL
M
M
I
L
NCENTIVES
I
I
A
N
D
C
O
MPETITI
ON
1
77
F
igure 2. Average Quantities C
h
osen Over Time
.
T
a
bl
e 2. OLS Regression of Quantity C
h
ose
n
Base
l
ine (Cournot) Re
l
ative Paymen
t
Estimate t-statistic p-va
l
ue Estimate t-statistic p-va
l
ue
I
ntercept 32.44 3
5
.96 0.0000 40.98 62.20 0.000
0
P
eriod 0.180 1.13 0.2
5
96 0.628 4.
5
1 0.0000
S
ess
i
on
d
umm
i
es yes yes
I
ndividual dummies
y
es
y
es
N
3
44 N 41
4
R
2
(ad
j
.) .3884
R
2
(ad
j
.) .293
8
I
n
d
ee
d
, separate regress
i
ons
f
or eac
h
treatment s
h
ow a s
i
gn
ifi
cant t
i
me-tren
d
i
n t
h
e
f
ormer, but not in the latter
.
5
.
CO
N
C
L
US
I
O
N
S
AND IMPLI
C
ATI
O
N
S
O
ur exper
i
menta
l
resu
l
ts support t
h
e mo
d
e
l
’s comparat
i
ve-stat
i
c pre
di
ct
i
ons:
h
ow
m
ana
g
ers are compensate
d
(
b
ase
d
on a
b
so
l
ute or re
l
at
i
ve pro
fi
ts)
h
as
i
mportant
i
mplications for collusive behavior. Further research might investigate individual
b
e
h
av
i
or
i
n t
hi
s sett
i
ng
b
y
l
oo
ki
ng at eac
h
part
i
c
i
pant’s
hi
story an
d
see
i
ng
h
ow t
h
ey
react to part
i
cu
l
ar outcomes. Future researc
h
m
igh
t a
l
so expan
d
t
h
e scope o
f
t
h
e
i
nquiry to include the decision(s) of the firms in choosing these contracts.
Q
uant
i
t
i
es
C
hose
n
30
35
4
0
4
5
12345678
9
Iteration Number
B
ase
li
ne (Cournot
)
R
e
l
at
i
ve
178 Ex
p
erimental Business Research Vol. I
I
I
n any exper
i
ment proport
i
ng to say somet
hi
ng a
b
out t
h
e wor
ld
, externa
l
va
lidi
ty
q
uest
i
ons are o
f
extreme
i
mportance. One
li
m
i
tat
i
on o
f
t
hi
s ana
ly
s
i
s an
d
exper
i
ment
i
s that it applies onl
y
to firms whose products are perfect substitutes (are not hori-
zonta
ll
y or vert
i
ca
ll
y
diff
erent
i
ate
d
). T
h
at sa
id
, a num
b
er o
f
ot
h
er asymmetr
i
es can
b
e a
dd
e
d
to t
h
e mo
d
e
l
w
i
t
h
out c
h
an
gi
n
g
i
ts resu
l
ts,
i
nc
l
u
di
n
g
as
y
mmetr
i
c (
b
ut
c
onstant) mar
g
inal costs, as
y
mmetric proportions of absolute profits that mana
g
ers
are compensate
d
, an
d
asymmetr
i
c measures o
f
re
l
at
i
ve pro
fi
ta
bili
ty.
I
n pract
i
ce, man
y
compensat
i
on contracts
i
nvo
l
ve
fi
xe
d
sa
l
ar
i
es an
d
are not
b
ase
d
on beatin
g
the competition. However, there ma
y
be other reasons wh
y
mana
g
ers
wou
ld
care a
b
out re
l
at
i
ve pro
fi
ts. For examp
l
e,
if
part o
f
manager
i
a
l
compensat
i
on
i
s
th
rou
gh
stoc
k
an
d
opt
i
ons, an
d
t
h
e mar
k
et
i
ncorporates re
l
at
i
ve per
f
ormance
i
nto
i
ts valuations, then mana
g
ers’ compensation will include relative performance.
Furt
h
ermore, re
l
at
i
ve per
f
ormance may
i
n
fl
uence w
h
et
h
er a manager
k
eeps
hi
s
j
o
b
or
g
ets promote
d.
I
n addition to validatin
g
the theor
y
, these results have important lessons for
ant
i
trust regu
l
ators. To
d
eterm
i
ne w
h
et
h
er an
i
n
d
ustry
i
s co
ll
us
i
ve
i
t
i
s not su
ffi
c
i
ent
(an
d
ma
y
not even
b
e necessar
y
) to
l
oo
k
at t
h
e
i
n
d
ustr
y
’s output, one s
h
ou
ld
a
l
so
look at mana
g
erial incentives of the individual firms. Similarl
y
, re
g
ulatin
g
mana
g
e-
ri
a
l
i
ncent
i
ves may
h
ave a
bi
gger
i
mpact t
h
an s
i
mp
l
y
d
eny
i
ng spec
ifi
c mergers. Even
i
n ver
y
concentrate
d
(two-part
y
)
i
n
d
ustr
i
es
i
n our exper
i
ment, w
h
en
i
ncent
i
ves were
r
elative rather than absolute, outcomes were com
p
etitive. Thus even in industries
w
h
ere concentrat
i
on an
d
ot
h
er usua
l
measures o
f
co
ll
us
i
ve potent
i
a
l
are t
h
e same,
th
e amount o
f
i
ne
ffi
c
i
enc
y
t
h
at
i
s o
b
serve
d
i
s
lik
e
ly
to
d
epen
d
on t
h
e
i
ncent
i
ves o
f
t
he mana
g
ers
.
Thi
s researc
h
a
l
so ra
i
ses an a
ddi
t
i
ona
l
cost to
fi
rms compensat
i
ng t
h
e
i
r managers
b
ase
d
on re
l
at
i
ve per
f
ormance. On t
h
e one
h
an
d
, t
h
ese compensat
i
on sc
h
emes can
overcome principal/a
g
ent problems when there exist informational as
y
mmetries. On
th
e ot
h
er
h
an
d
, t
h
ey may
l
ea
d
to
i
ncent
i
ves w
hi
c
h
re
d
uce
fi
rms’ pro
fi
ts. F
i
rms nee
d
t
o
b
a
l
ance t
h
e costs an
d
b
ene
fi
ts w
h
en cons
id
er
i
n
g
var
yi
n
g
compensat
i
on sc
h
emes.
NOTE
S
1
W
e have calculated this solution for the case of s
y
mmetric firms. But it is robust to as
y
mmetries in
c
onstant marginal cost, in the exact proportion of profits which each manager is compensation (whether
they are the same or different), and size of the firm (capacity) so long as that constraint does not bind.
O
ne assumpt
i
on a
b
out Cournot compet
i
t
i
on on w
hi
c
h
we re
l
y qu
i
te
h
eav
il
y
i
s t
h
e assumpt
i
on o
f
homo
g
eneous products. If the firms are producin
g
products which are verticall
y
or horizontall
y
differ-
e
ntiated, then Cournot is no lon
g
er the appropriate model.
2
O
ne concern with Cournot ex
p
eriments like this one is the
fl
at maximum critique
(
Harrison 1989
)
, which
argues t
h
at payo
ff
s are not sens
i
t
i
ve to part
i
c
i
pants’ act
i
ons aroun
d
equ
ilib
r
i
um. T
h
at
i
s,
if
my partner
i
s pro
d
uc
i
n
g
t
h
e Cournot equ
ilib
r
i
um quant
i
t
y
, t
h
e costs to me
f
rom
d
ev
i
at
i
n
g
f
rom t
h
e equ
ilib
r
i
um are
q
uite low. This can add noise to the outcomes. As will be seen, the second treatment (case B, relative
c
ompensation), does not suffer from this critique; there a deviation is quite costl
y
. This critique predicts
t
h
at t
h
e var
i
ance o
f
quant
i
t
i
es c
h
osen
i
n t
h
e
fi
rst treatment w
ill
b
e
hi
g
h
er t
h
an t
h
ose c
h
osen
i
n t
h
e secon
d
treatment. T
hi
s pre
di
ct
i
on
i
s
i
n
f
act true; t
h
e stan
d
ar
d
d
ev
i
at
i
on o
f
quant
i
t
i
es c
h
osen
i
n t
h
e
fi
rst treatment
i
s 9.76 and in the second is 7.31. An F-test su
gg
ests that this difference is si
g
nificant, p
<
.
01
.
M
ANAGERIAL
M
M
I
L
NCENTIVES
I
I
A
N
D
C
O
MPETITI
ON
179
3
The reasonableness of this relative pa
y
ment scheme relies on the s
y
mmetr
y
of the two firms. If instead
th
e
fi
rms vary,
f
or examp
l
e, on marg
i
na
l
cost, t
h
en compar
i
ng a
b
so
l
ute pro
fi
ts
i
s c
l
ear
l
y not a reason-
a
bl
e
b
enc
h
mar
k
. However,
if
managers are compensate
d
re
l
at
i
ve
l
y
b
ut
b
ase
d
on stan
d
ar
di
ze
d
b
enc
h
-
mar
k
s (e.g., return on cap
i
ta
l
, pro
fi
ts re
l
at
i
ve to s
i
ze, . . . ), t
h
e same compet
i
t
i
ve resu
l
ts
h
o
ld
.
4
Others have used experimental desi
g
ns in which participants are compensated based on their relative
p
a
y
offs, but in different contexts and for different purposes. Andreoni (199
5
) and Kurzban and Hauser
(
2002) use re
l
at
i
ve payo
ff
s
i
n pu
bli
c goo
d
s games to
diff
erent
i
ate
ki
n
d
ness an
d
con
f
us
i
on. Croson an
d
Dono
h
ue (2003), Croson an
d
Dono
h
ue (
f
ort
h
com
i
ng) use re
l
at
i
ve payo
ff
s to capture rea
l
-wor
ld
b
enchmarkin
g
incentives in a suppl
y
chain mana
g
ement
g
ame.
5
In addition, we ran a third treatment in which 31 participants pla
y
ed a Cournot
g
ame similar to our
b
aseline treatment. However, after each round of the
g
ame the
y
were not told the profits of their
counterpart. T
h
eoret
i
ca
ll
y t
hi
s s
h
ou
ld
not ma
k
e a
diff
erence, an
d
i
n
d
ee
d
emp
i
r
i
ca
ll
y t
h
ere were no
diff
erences
b
etween t
hi
s treatment o
f
i
ncomp
l
ete
i
n
f
ormat
i
on an
d
t
h
e Cournot (
b
ase
li
ne) treatment we
r
e
p
ort here. Instructions and data from this treatment are available from the authors.
6
A
similar re
g
ression usin
g
a discrete measure of period (dummies for periods 2 throu
g
h 9)
y
ields
identical results. We also look for and fail to find an interaction between the treatment and the
p
eriod
num
b
er; t
h
us any o
b
serve
d
l
earn
i
ng
i
s occurr
i
ng at t
h
e same spee
d
i
n t
h
e two treatments.
R
EFEREN
C
E
S
Andreoni, James (199
5
). “Coo
p
eration in Public-Goods Ex
p
eriments: Kindness or Confusion?”
A
m
e
r
ica
n
E
conomic Re
v
ie
w
,
8
5
(4), 891–904
.
C
roson, Rac
h
e
l
an
d
Karen Dono
h
ue (2003). “T
h
e Impact o
f
POS Data S
h
ar
i
ng on Supp
l
y C
h
a
i
n Manage-
m
ent: An Exper
i
menta
l
Stu
d
y.” Pro
d
uction an
d
Operations Mana
g
ement
,
12
,
1–11
.
C
roson, Rac
h
e
l
an
d
Karen Dono
h
ue (
f
ort
h
com
i
n
g
). Be
h
av
i
ora
l
Causes o
f
t
h
e Bu
ll
w
hi
p E
ff
ect an
d
t
h
e
O
bserved Value of Inventor
y
Information. Mana
g
ement Science
.
Fershtman, Chaim and Kenneth Judd (1987). “Equilibrium Incentives in Oligopoly.” American Economic
Rev
i
ew
,
77
,
92
7–
940.
F
ouraker, Lawrence and Sidney Siegel (19
6
3). Bargaining Behavior. McGraw-Hill: New York.
H
arrison, Glenn (1989). “Theor
y
and Misbehavior of First Price Auctions.”
A
merican Economic Re
v
ie
w
,
79
,
749–62
.
H
ouser, Dan
i
e
l
an
d
Ro
b
ert Kurz
b
an (2002). “Rev
i
s
i
t
i
ng
ki
n
d
ness an
d
con
f
us
i
on
i
n pu
bli
c goo
d
s games.”
The American Economic Review
,
92(4), 10
6
2–10
6
9
.
H
olt, Charles (199
5
). Industrial Or
g
anization. In Handbook of Experimental Economics (Ka
g
el and Roth,
e
ds.), Princeton University Press: Princeton, NJ. 349–444
.
H
uc
k
, Ste
ff
en, W
i
e
l
an
d
Mu
ll
er an
d
Hans-T
h
eo Norman (
f
ort
h
com
i
ng). Strateg
i
c De
l
egat
i
on
i
n Exper
i
-
m
enta
l
Mar
k
ets. Internat
i
ona
l
Journa
l
o
f
In
d
ustr
i
a
l
Or
g
an
i
zat
i
on.
Potters, Jan, Bettina Rockenbach and Abdolkarim Sadrieh (2004). Collusion Under Yardstick Com
p
eti-
t
i
on: An Exper
i
menta
l
Stu
d
y. Wor
ki
ng Paper, T
ilb
urg Un
i
vers
i
ty.
Pren
d
ergast, Can
di
ce (1999). “T
h
e Prov
i
s
i
on o
f
Incent
i
ves
i
n F
i
rms.”
J
ourna
l
of Economic Literature
,
X
XXVII, 7–
6
3
.
Sklivas, Steven (1987). “The Strate
g
ic Choice of Mana
g
erial Incentives.” RAND Journal o
f
Economics
,
18
(
3
)
, 4
5
2–4
5
8.
Vickers, John (1985). “Delegation and the Theory of the Firm.”
Th
e Economic Journa
l
,
95
,
138–147.