Rich in America Secrets to Creating and Preserving Wealth PHẦN 3 pot
Bạn đang xem bản rút gọn của tài liệu. Xem và tải ngay bản đầy đủ của tài liệu tại đây (364.37 KB, 23 trang )
ers; in other words, they buy stock in whichever industry or company
seems to be doing well at the moment. Running with the herd is
not something limited to amateurs. Many professional investors have
fallen into a similar trap (or believed they could take advantage of the
trends and make momentum their friend).This was the case with tech-
nology stocks, which were the leading pick through the 1990s; since
2000, that has changed radically.
Our surveys also reveal substantial swings in our respondents’
attitudes toward asset allocation. Back in 1993, following a period of
lackluster equity returns, investors felt that the best investment was
municipal bonds, whereas their least favored investment was U.S. gov-
ernment securities. Unfortunately, respondents were also slightly neg-
ative about growth stocks, which would have proven to be been an
excellent investment at the time. However, compared to the years that
followed, their expectations were sensible—87 percent said they would
be content if they could realize a 10 percent average return on their
portfolio that year.
Respondents were also reasonably bullish—55 percent felt that the
next two years would be favorable or very favorable to investors. Only
15 percent felt those years would be unfavorable. By 1995, investors
had turned bearish, with only 31 percent expecting an increase in the
U.S. stock market over the next year. Perhaps because the stock market
indeed did advance, by 1996 investors had become more bullish—57
percent expected the U.S. stock market to increase in value over the
next year. By 1998, investors were beginning to wonder how long the bull
market would last. More than half the respondents (57 percent) felt it
would end within two years (and they were right). Only 15 percent felt
it would continue more than three years (and they were wrong).
Still, respondents remained bullish in 1998 about the U.S. stock
market over the long term. Over the next 10 years, 25 percent of those
surveyed expected to see annualized returns of 11 to 20 percent on
their stock market investments. Another 20 percent expected returns
greater than 20 percent. (The median response for anticipated returns
44 Rich in America
02 Chapter Maurer 6/20/03 4:57 PM Page 44
was 12 percent.) It is clear that the market, currently mired at levels
lower than in 1998, will have to do extraordinarily well for this predic-
tion to come true. At U.S. Trust, we don’t think it will.
By 2001, respondents were coming to terms with the stock mar-
ket’s reversal since mid-2000. Only 8 percent said that their investment
portfolios had not declined in the last year—73 percent said theirs had
declined a great deal or at least some, and 19 percent said slightly. Still,
57 percent said that they were not going to make any changes in their
portfolio because of these declines. Only 2 percent had sold off all of
their stocks or stock mutual funds and had moved their money to safer
investments.
As of 2002, 78 percent of respondents felt that the top investment
sectors were health care, pharmaceuticals, and biotechnology; the
same proportion picked defense and aerospace. Right behind these
sectors were real estate (chosen by 66 percent of respondents) and con-
sumer products (63 percent). Another 55 percent also felt comfortable
with energy and natural resources stocks.
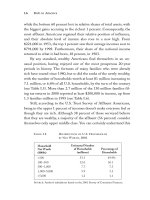
We also asked respondents to tell us how they apportioned the
assets in their portfolio. The breakdown appears in Figure 2.1. Table
2.1 provides an interesting comparison of investment portfolios based
on household net worth. Fifty-seven percent of respondents said that
the recent downturn in the stock market has not caused them to make
any changes in their portfolio. Twenty-two percent saw the downturn
as a buying opportunity, whereas 18 percent sold off some securities
and moved their money into what they considered to be safer invest-
ments. Two percent of respondents simply sold everything in their port-
folio. Of those who sold their stocks, 34 percent transferred their
proceeds to cash, 22 percent invested them in bonds, 20 percent in real
estate, 18 percent in private equity, and 6 percent in foreign stock.
Seventy percent of respondents said that the current volatility
didn’t prompt them to seek additional advice. But of the 30 percent
who did seek such advice, 84 percent consulted a fee-based investment
advisor, 73 percent went to a financial planner, 68 percent saw a stock-
Investments 45
02 Chapter Maurer 6/20/03 4:57 PM Page 45
broker, 38 percent chose a CPA, 32 percent went to a banker, 21 per-
cent sought out an attorney, and 19 percent consulted with an insur-
ance agent.
If the market continues its slump, 54 percent of respondents said
they would postpone capital improvements to their home, 49 percent
46 Rich in America
Cash
equivalents
19%
Venture
capital
2%
Private
business
8%
Domestic blue-
chip stocks
23%
International
stocks
4%
Investment
real estate
14%
U.S. government
securities
5%
Corporate
bonds
5%
Municipal
bonds
10%
Domestic small-
cap stocks
10%
Domestic blue-
chip stocks 21%
Domestic small-cap
stocks 11%
International
stocks 6%
Municipal
bonds 10%
Corporate
bonds 7%
U.S. government
securities 7%
Cash
equivalents
18%
Investment
real estate
10%
1996
2002
Private
business
8%
Venture
capital
2%
FIGURE 2.1 AVERAGE PERCENTAGE OF PORTFOLIO HELD
IN
VARIOUS INVESTMENT TYPES, 1996 & 2002
SOURCE: U.S. Trust Survey of Affluent Americans X, XXI, 1996, 2002
02 Chapter Maurer 6/20/03 4:57 PM Page 46
would cut back on any new big-ticket items (such as a new television),
43 percent would postpone the purchase of a new car or boat, 38 per-
cent would eat out less often, 36 percent would postpone or reevaluate
vacation plans, 34 percent would contribute less money to their favorite
charities, and 26 percent would simply cut back on everyday expenses.
An Investment Scenario
Some years ago, one of our portfolio managers recommended that his
clients buy stock in a large department store chain. This particular
analyst had a contrarian philosophy—he tended to pick stocks that
were out of favor rather than those that other analysts liked. This stock
was especially unpopular at the time, but the analyst, who had spent
many hours studying the company and its management, believed it
had a strong blueprint for its future and expected the stock to make a
dramatic comeback.
Investments 47
Top 1% of
Net Worth
95−99% 90−95% 80−90% 60−80% 0−60%
Taxable Equity
Taxable Bonds
Tax-Deferred
Equity
Tax-Deferred
Bonds
Tax-Exempt
Bonds
Interest-Bearing
Accounts
Other Financial
Assets
53.8%
4.8
7.1
4.5
9.2
9.9
10.7
38.7%
4.2
22.5
8.8
5.9
10.6
9.3
33.0%
2.9
25.1
10.1
3.8
14.2
11.0
26.2%
2.6
28.4
11.3
2.1
18.6
10.8
16.0%
3.0
27.1
12.9
1.9
23.4
15.9
11.6%
1.7
24.8
13.2
1.6
29.7
17.4
TABLE 2.1 COMPOSITION OF FINANCIAL ASSET PORTFOLIOS
BY
HOUSEHOLD NET WORTH
SOURCE: Tabulations from 2001 Survey of Consumer Finances.
02 Chapter Maurer 6/20/03 4:57 PM Page 47
Among his clients was a widow named Muriel. Although du-
bious of his advice, she bought the stock. Contrarian picks don’t
necessarily move the day you buy them. They are bought for their
future potential, not their immediate performance. Muriel said that
she understood this concept, but she became impatient fairly quickly.
One day she called the analyst and said, “I just drove by the store
and I saw only 60 cars in the parking lot. Is it time to sell?” The
analyst explained that this wasn’t the time to sell, and that while he
appreciated her offbeat information-gathering techniques, she should
hold on.
The next week he got another call. “I just drove by the parking
lot,” Muriel said, “and this time I only counted 50 cars. Should I sell?”
The analyst again urged her to be patient. Sure enough, the next
week she called again. “This time there are only about 35 cars. I really
should sell, shouldn’t I?”
From then on Muriel called every week with a report on how
many cars were in the parking lot. She didn’t sell the stock, although
the week she saw only 10 cars she could barely restrain herself.
Strangely enough, her research analysis bore fruit. A year later she was
calling to say that there were now 100 cars in the lot, and within two
years, as the number of cars increased, so did the company’s stock
price. What now decreased was the number of times Muriel called us.
The stock went on to become a winner.
The rest of Muriel’s family were equally idiosyncratic investors.
Marvin, Muriel’s husband, who had owned a successful business that
he eventually sold when the couple reached their 60s, refused to buy
any stocks at all, and put every penny he had into his business, claim-
ing that the only investment he could count on was an investment
he controlled. Luckily for him, the business flourished, although he
died shortly after the sale. Both Marvin and Muriel had been shrewd
about their estate, and had started giving money to their three sons in
a tax-wise manner; eventually, after Muriel died, each of the sons
48 Rich in America
02 Chapter Maurer 6/20/03 4:57 PM Page 48
received his full inheritance. And each of the sons handled his invest-
ments differently.
The eldest son couldn’t find investments that made money fast
enough. He didn’t have a job, and his investment philosophy flew in
the face of ours. Sober thoughts never entered his mind. When we
told him honestly that we couldn’t guarantee him the 20 percent
return he demanded each year, he left us to invest on his own. Because
he had started investing in the 1990s boom, he felt that double-digit
returns were to be expected.
The middle son, however, was frugal to the point of exasperation—
he inherited his parents’ fear of risk, and he asked us to construct the
most conservative portfolio possible. He decided that he preferred all
his money in Treasury bills and bonds. Even when we showed him
that his money, although safe, would lose its value because his return
wouldn’t be sufficient to compensate for inflation, he didn’t care.“I can’t
sleep at night knowing that I could wake up with less money than I had
the day before,” he said.
The youngest son wasn’t even slightly interested in his money or
in investing. While the eldest son had tried his hand at the family
business, but failed, and the middle son was still involved, this son
decided never to enter the business, but to teach grade school instead.
After obtaining his credentials, he moved to a town where few people
knew his family, much less that he was very wealthy. He turned his
portfolio over to us with complete discretion, and if we hadn’t sent him
regular statements, he might never have asked about his balances. He
lived on his school salary, and that was enough for him.
Once a year the family meets to discuss their money, among other
issues. Needless to say, these meetings are interesting: The youngest
son acts as though he doesn’t care, the middle son is afraid that he will
lose everything he has by taking any investment risks, and the eldest
son has lost a great deal in his eagerness to become as rich as possible
as quickly as possible. He is still looking for that magic bullet.
Investments 49
02 Chapter Maurer 6/20/03 4:57 PM Page 49
Creating and Preserving Wealth
by Investing
The art and science of investing are evolving—the conventional wis-
dom of the past decade is not necessarily wise today, but the lessons
learned along the way must be added to our current store of wisdom.
When I began my career at U.S.Trust, the firm was in the forefront of
investing in the growth companies of the mid-twentieth century—
firms including IBM, Xerox, General Electric, and Procter and Gamble.
Identifying and investing in these excellent companies seemed easy,
and betting on the performance of the Nifty 50, as the group was
known, was a sure way to make money—until their values fell dramat-
ically in the bear market of 1973 and 1974, and most of these stocks
lost their popularity as well.
Still, many academic studies have shown that if investors had not
sold when these stocks bottomed, but held on to them or their succes-
sor companies until the end of the twentieth century, they would still
have made excellent returns of about 12 percent. The Nifty 50 were
essentially good businesses whose valuations had become inflated
because so many investors felt they were the only stocks to own (see
Table 2.2). Yet holding on to them longer wasn’t a mistake—some of
these 50 faired well, and others failed, but the final outcome wasn’t
bad. The question remains: Could a more disciplined approach to
valuation and asset allocation have permitted skilled investors to pro-
duce better results by rebalancing their portfolios prior to the mar-
ket’s precipitous decline? Unfortunately, many professional and private
investors abandoned these stocks and invested in other asset classes
that often didn’t produce equivalent value.
The point is that investing requires discipline, a long-term time
horizon, and the recognition that, given all the variables at work, mar-
kets are rarely predictable. The world is filled with uncertainties that
make forecasts difficult. On any given day you are likely to find as
many professionals on one side of a prediction as on the other.
50 Rich in America
02 Chapter Maurer 6/20/03 4:57 PM Page 50
Investments 51
Philip Morris Cos. Inc. 17.80% 24.0
Pfizer Inc.
17.39% 28.4
Bristol-Myers 15.60% 24.9
Pepsico Inc. 15.58% 27.6
General Electric Co. 15.44% 23.4
Merck & Co. Inc. 14.85% 43.0
Heublein Inc. 14.75% 29.4
Squibb Corp. 14.46% 30.1
Gillette Co. 14.07% 24.3
Anheuser-Busch Inc. 13.41% 31.5
Lilly Eli & Co. 13.38% 40.6
Johnson and Johnson 13.34% 57.1
Schering Plough Corp. 13.22% 48.1
First National City Corp. 13.20% 20.5
Coca-Cola Co. 13.18% 46.4
American Home Products Corp. 13.09% 36.7
American Hospital Supply Corp. 12.24% 48.1
Procter & Gamble Co. 11.89% 29.8
Texas Instruments Inc. 11.83% 39.5
AMP Inc. 11.19% 42.9
Dow Chemical Co. 11.19% 24.1
Chesebrough Ponds Inc. 10.95% 39.1
McDonald’s Corp. 10.58% 71.0
Upjohn Co. 10.08% 38.8
American Express Co. 10.02% 37.7
Baxter Labs 9.97% 71.4
Schlumberger Ltd. 9.87% 45.6
Minnesota Mining & Manufacturing Co. 9.69% 39.0
International Business Machines 9.54% 35.5
Disney Walt Co. 8.92% 71.2
Int’l Telephone & Telegraph Corp. 8.74% 15.4
Lubrizol Corp. 7.29% 32.6
Sears Roebuck & Co. 6.79% 29.2
Schlitz Joe Brewing Co. 6.78% 39.6
Avon Products Inc. 6.15% 61.2
Int’l Flavors & Fragrances 5.77% 25.0
Halliburton Co. 4.97% 35.5
Revlon Inc. 4.77% 69.1
Louisiana Land & Exploration Co. 4.68% 26.6
Penney J.C. Inc. 4.62% 31.5
Black and Decker Corp. 2.38% 50.0
Annualized
Returns
1972 Actual
P-E Ratio
Company
Simplicity Patterns
2.31% 43.5
Eastman Kodak Co.
1.82% 47.8
TABLE 2.2 THE NIFTY FIFTY: 1972–DECEMBER 31, 2001
02 Chapter Maurer 6/20/03 4:57 PM Page 51
Like it or not, there is no magic when it comes to this kind of in-
vesting. Good investing consists of common sense, a great deal of hard
work, and tremendous discipline. Although experts in the field have
long known this, in the 1990s many individual investors lost track of
these traits. Those years created a cluster of investors who felt that all
they had to do was buy a stock—particularly if it was in the so-called
TMT group (technology, media, telecommunications)—and it would
rise. The only risk seemed to be that their stocks wouldn’t rise as fast
as everyone else’s. These investors regularly watched CNBC, making
them feel as though they were knowledgeable, and they never learned
the lesson that markets are composed of risks as well as rewards.
Even many professional investors failed to stick to their discipline and
suffered—or perhaps I should say, they and their clients suffered. Fred
Taylor, U.S. Trust’s vice chairman and chief investment officer during the
last 22 years, warned clients in the spring of 1998 that many domestic
equities were overvalued. Three years later he admitted that, although U.S.
Trust emphasized a disciplined, long-term approach to investing through-
out the cult-like market mania of the 1990s, like many investment organ-
izations even we had not been immune to the irrational exuberance of the
moment. Still, Fred says, “We welcome the return to reason.”
52 Rich in America
TABLE 2.2 (Continued)
Annualized
Returns
1972 Actual
P-E Ratio
Company
Digital Equipment Corp. 1.06% 56.2
Xerox Corp. 0.15% 45.8
Kresge (S.S.) Co. −0.69% 49.5
Burroughs Co. −1.82% 46.0
Emery Air Freight Corp. −2.31% 55.3
M.G.I.C. Investment Corp. −6.07% 68.5
Polaroid Corp. −18.51% 94.8
Rebalanced Portfolio 11.76% 41.9
Equally Weighted 11.62% 41.9
S&P 500 12.14% 18.9
SOURCE: Adapted from Forbes, “The Nifty Fifty Revisited.”
02 Chapter Maurer 6/20/03 4:57 PM Page 52
What many people forgot, or didn’t bother to learn, is that there
is a difference between creating wealth and investing wealth. People
began to believe that the quickest and easiest road to creating wealth
was to speculate in the stock market and reap great rewards. Hundreds
of books were written about how anyone could become a millionaire
overnight by picking the right stocks, and the media were filled with
stories of investors who made a fortune simply by investing in the
right Internet stocks.
The problem is that this is not actually the way wealth is created.
A handful of these investors did, indeed, make a great deal of money—
but only if they got out of the markets early, which is the way all bub-
bles work. The other 99 percent did not get out early, and they lost
money—sometimes a great deal of it. After all those breathtaking
news stories of newly created millionaires during the 1990s, the early
twenty-first century was filled with tragic tales of people who had lost
their fortunes during the 2000s.
Risk
Creating wealth does involve risk—but not the kind of risk encountered
when investing in the markets. For those who became affluent and
stayed that way,risk may have meant starting a business with their entire
life savings, or taking out a loan that they could ill afford to default on,
or borrowing money from relatives who needed to be paid back. Perhaps
they had an idea that needed a great deal of luck, timing, and hard work
to carry off properly. Perhaps they worked at a large organization, but as
they rose up the ladder took on risks that differentiated them from the
others who were also fighting their way to the top. Muriel’s husband
Martin, who hated stock market risk, took another kind of risk as a
young man when he walked away from a corporate career and founded
his own business, with no guarantee that it would work.
Very few people created all their wealth through investments
alone. Yes, there are always going to be a few stars, such as well-known
Investments 53
02 Chapter Maurer 6/20/03 4:57 PM Page 53
investor Warren Buffett, who seems to be able to outsmart the market
year after year. But the reason Mr. Buffett is famous is because he is
such an exception. He wouldn’t be so well known if there were tens of
thousands of others just like him. Nonetheless, given the sizeable per-
centage of their net worth that is held in financial assets (see Table
2.3), investing wisely is of critical importance to the affluent.
For the most part, if you have money, you won’t want to place it
all in risky investments. You’ll want the investing side of your life to be
as intelligently managed as the rest of it, or perhaps more so. Risk is
always a factor in investing, but taking undue risk should not be part
of the equation. To help you preserve your money, maximize your
potential returns, and manage the inherent risks, you should work
with a good investment advisor or wealth management specialist. His
or her (and your) concerns will be defining your investment objectives,
ascertaining your risk tolerance, determining your time frame, and
understanding your tax situation.
This process (see Figure 2.2) is called investment planning, and
completing it will result in a personal policy that will be, in effect, a
business plan for investing your assets. Your investment plan will help
you develop a balanced portfolio of different asset classes. These asset
classes, which will be discussed throughout the book, are common
stocks (domestic and international), fixed-income investments (high-
quality and high-yield bonds), alternative investments (private equity,
real estate, hedge funds), and cash.
The return aspect of investing is straightforward. Return can be
quantified. Each year, you know exactly how much return you have
earned. Most people want the maximum possible.
The risk aspect of investing is much more difficult to quantify. It’s
even difficult to agree on its definition, as different schools of thought
exist. The current wisdom is that risk equals volatility (also known as
those gut-wrenching ups and downs for which the market is famous).
The more volatility within an asset class, the higher the probability
54 Rich in America
02 Chapter Maurer 6/20/03 4:57 PM Page 54
Net Worth
Category
Financial
Assets
Owner
Occupied
Housing Other Property
Business
Assets Other Assets
1995 2001 1995 2001 1995
2001 1995 2001 1995 2001
Top 1% 39.3% 44.7%
7.7% 8.4%
12.5% 12.2% 37.1% 32.5% 3.5%
2.3%
Next 4% 42.6 47.0 22.0 18.1
16.8 14.5 12.8 17.9 6.0 2.6
Next 5% 40.1 50.5 32.3 28.2
14.4 8.8 7.5 9.3 5.8 3.3
Next 10% 32.7 41.0 45.0 37.9
9.4 8.3 4.7 8.2 8.2 4.6
Next 20% 26.3 33.0 55.3 49.9
5.8 6.1 2.9 4.1 9.7 6.9
Bottom 60% 17.2 21.1 61.3 59.8
3.2 2.9 1.5 1.5 16.7
14.6
T
ABLE
2.3 C
OMPOSITION OF
A
SSET
H
OLDINGS BY
N
ET
-W
ORTH
R
ANKING
, 1995
AND
2001
S
OURCE
: Tabulations from 1995 and 2001 Survey of Consumer Finances.
55
02 Chapter Maurer 6/20/03 4:57 PM Page 55
that you might sustain a permanent loss. After the TMT sector bub-
ble burst, investors gained a much better understanding of risk. When
your stock falls from $100 to $5 a share, you quickly come to under-
stand that you have placed your money in a risky asset class.
Diversification
The accepted way to reduce risk is through diversification. The more
diversified your portfolio, the more buffered you are against risk. How-
ever, diversification works only if the investments you are making
have truly different risk characteristics. In other words, your port-
folio should have many different types of investments—ones that have
as little to do with each other as possible. If your investments are
commonly affected by one factor, and that factor then drives them
all down, you obviously weren’t very well diversified. For example,
U.S. Trust once had a client who had made a great deal of money as
an oil executive. His idea of diversification was to own a basket of
different stocks in the oil business. Although he owned equities,
corporate bonds, and various other vehicles, almost every one of them
56 Rich in America
Inv
es
tm
e
nt
Plannin
g
FIGURE 2.2 INVESTMENT PLANNING PROCESS
02 Chapter Maurer 6/20/03 4:57 PM Page 56
was oil-related. When oil took a hit, his portfolio lost an unpleasantly
large portion of its value.
Diversification should exist across asset classes—and within them.
As noted, this means owning various kinds of investments, including
bonds, real estate, stocks, private equities, and hedge funds. Within
those vehicles, you need to be further diversified; within stocks, your
portfolio could be divided into domestic and international stocks, as
well as segregated by company size into what’s known as large-,
medium-, small-, and micro-cap stocks. Cap stands for capitalization.
At this writing, the most heavily capitalized stock is Microsoft, at $280
billion; General Electric (GE) is second at $289 billion.
During the investment planning process, you can construct a
number of diversified portfolios and measure their hypothetical risk
and return characteristics. This process of examining possible port-
folios is known as optimization, and the goal is to develop a portfolio
with the highest likelihood of maximizing returns based on the level of
risk you are willing to assume. A portfolio that satisfies your objectives
is known as an efficient portfolio, and when you array a group of those
portfolios based on different levels of return and risk, you have con-
structed the efficient frontier of portfolio investing. The entire process is
driven by making the appropriate assumptions based on both observ-
ing past characteristics and predicting the future. Although not perfect,
the process does allow the professional investor and the client a mech-
anism for making important judgments.
To illustrate the benefits of diversification, we have included a
chart showing the performance of different asset classes over the past
decade (see Figure 2.3) and a chart that shows the relative correlation
between various asset classes (see Table 2.4). We have also included a
chart that forecasts the returns on asset classes, adjusted for risk, fees
and taxes (see Table 2.5).
Some people don’t like diversification, because it is an admission
that you don’t know what will happen in the future—no matter how
much you study, you can’t be certain about your investments. And yes,
Investments 57
02 Chapter Maurer 6/20/03 4:57 PM Page 57
58
1991 1992 1993
1994 1995
1996 1997 1998
Emerging Small Cap
Emerging Foreign Large Cap
REITS Large Cap Large Cap
Markets Value Mar
kets Stocks Value
Value Growth
Best
59.91% 29.14%
74.84% 7.75% 38.35%
35.75% 35.18% 38.71%
Small Cap Small Cap Foreign
HF Absolute Large Cap Large Cap
Large Cap Large Cap
Growth Stocks Stoc
ks Return Stocks
Growth Stocks Stoc
ks
51.19% 18.41%
32.67% 2.97% 37.77%
23.12% 32.85% 27.02%
Small Cap HF Long/ HF Fund
Large Cap Large Cap
Large Cap Small Cap Foreign
Stocks Short of Funds
Growth Growth Stoc
ks Value Stocks
46.05% 18.40% 26.32%
2.66% 37.19% 22.45%
31.78% 20.09%
Small Cap HF Absolute Small Cap
REITS Small Cap Large Cap
Large Cap HF Long/
Value Return Value
Growth Value Gro
wth Short
41.70% 15.42% 23.84%
0.81% 31.04% 21.64%
30.49% 15.98%
Large Cap Large Cap
HF Long/ Large Cap Small Cap
Small Cap Small Cap Large Cap
Growth Value Shor
t Stocks Stocks
Value Stocks Value
41.16% 13.81%
23.49% 0.38% 28.44%
21.37% 22.36% 15.63%
REITS HF Fund HF Absolute
Small Cap Small Cap HF Long/
HF Long/ Bonds
of Funds Return
Value Value Shor
t Short
35.68% 12.33%
20.78%
−1.55% 25.75% 21.32%
21.93% 8.67%
Large Cap REITS Small Cap
Small Cap HF Long/ Small Cap
REITS HF Absolute
Stocks
Stocks Stocks Shor
t Stocks
Return
33.03% 12.18% 18.91%
−1.82% 23.47% 16.49%
18.87% 5.94%
HF Long/ Emerging
REITS Large Cap Bonds
HF Absolute HF Fund Small Cap
Short Markets
Value
Return of Funds Gro
wth
25.70% 11.40% 18.55%
−1.99% 18.48%
15.22% 16.20% 1.23%
Large Cap Large Cap Large Cap
Small Cap REITS
HF Fund HF Absolute Small Cap
Value Stocks Value
Growth
of Funds Return
Stocks
24.61% 9.04% 18.12%
−2.43% 18.31% 14.39%
15.03%
−2.55%
HF Absolute Small Cap
Small Cap Bonds HF Absolute
Small Cap Small Cap
HF Fund
Return Growth Gro
wth
Return Growth
Growth of Funds
16.57% 7.77% 13.36%
−2.92% 17.78% 11.26%
12.95%
−5.11%
Bonds Bonds Large Cap
HF Long/ Foreign F
oreign Bonds Small Cap
Stocks Short
Stocks Stocks
Value
16.00% 7.40%
10.15%
−3.40% 11.27% 6.14%
9.68%
−6.45%
HF Fund Large Cap Bonds
HF Fund HF Fund Emerging
Foreign REITS
of Funds Growth
of Funds of Funds
Markets Stocks
14.50% 5.00% 9.75%
−3.48% 11.10% 6.03%
1.55%
−18.82%
Foreign Foreign Large Cap
Emerging Emerging
Bonds Emerging Emerging
Worst
Stocks Stocks
Growth Markets Mark
ets
Markets Markets
12.20%
−12.22% 2.90%
−7.32%
−5.21% 3.61%
−11.59%
−25.34%
The benchmarks used for the follo
wing asset classes:
Bonds
= Lehman Aggregate Bond Inde
x
Emerging Markets
= MSCI Emerging Markets (Free) Inde
x
Foreign Stocks
= MSCI EAFE Index (Net of Dividends)
Hedge Fund Absolute Return Strategies
= 1/3 each of the following Hedge Fund Research Indices:
Relative Value, Convertible Arbitrage and Merger Arbitr
age
Hedge Fund of Funds
= Hedge Fund Research Fund of Funds Inde
x
Hedge Fund Long/Short Strategies
= Hedge Fund Research Equity Hedge Inde
x
Large Cap Stocks
= Russell 1000 Index
Large Cap Growth
= Russell 1000 Growth Index
Large Cap Value
= Russell 1000 Value Index
1999
2000
2001
2002
5 Years 10 Years
Emerging REITS
REITS Bonds HF Long/
HF Long/
Markets
Short Short
66.41% 25.88% 15.50%
10.27% 11.87%
14.33%
HF Long/ Small Cap Small Cap
REITS HF Absolute HF Absolute
Short Value Value
Return Return
44.22% 22.83% 14.03%
5.22%
9.62% 11.88%
Small Cap HF Absolute
Bonds HF Absolute Bonds
Small Cap
Growth Return
Return
Value
43.09% 15.31%
8.42% 4.43%
7.54% 10.86%
Large Cap Bonds
HF Absolute HF Fund
HF Fund Large Cap
Growth
Return of Funds
of Funds Value
33.16% 11.63%
8.35% 1.09%
5.35% 10.81%
Foreign HF Long/ HF Fund
HF Long/ REITS
REITS
Stocks Short of Funds
Short
26.72% 9.09% 2.80%
−4.38%
3.04% 10.24%
HF Fund Large Cap Small Cap
Emerging Small Cap
Large Cap
of Funds Value
Stocks Markets
Value Stocks
26.47% 7.01% 2.49%
−6.00%
2.71% 9.18%
Small Cap HF Fund HF Long/
Small Cap Large Cap
HF Fund
Stocks of Funds Shor
t Value
Value of Funds
21.26% 4.07% 0.40%
−11.43% 1.16%
8.86%
Large Cap Small Cap
Emerging Large Cap Large Cap
Bonds
Stocks Stocks Mark
ets Value
Stocks
20.91%
−3.02%
−2.37%
−15.52%
−0.58% 7.51%
HF Absolute Large Cap
Large Cap Foreign Small Cap
Small Cap
Return Stocks V
alue Stocks
Stocks Stocks
14.52%
−7.79%
−5.59%
−15.94%
−1.36% 7.16%
Large Cap Foreign Small Cap
Small Cap Foreign
Large Cap
Value Stocks Gro
wth Stocks
Stocks Growth
7.35%
−14.17%
−9.23%
−20.48%
−2.91% 6.71%
Bonds Large Cap Large Cap
Large Cap Large Cap
Foreign
Growth Stocks Stoc
ks
Growth Stocks
−0.83%
−22.42%
−12.45%
−21.65%
−3.84% 3.99%
Small Cap Small Cap Large Cap
Large Cap Emerging
Small Cap
Value Growth
Growth Growth Mar
kets Growth
−1.49%
−22.43%
−20.42%
−27.89%
−4.58% 2.62%
REITS Emerging
Foreign Small Cap Small Cap
Emerging
Markets Stocks
Growth Growth Mar
kets
−6.48%
−30.61%
−21.44%
−30.26%
−6.59% 1.31%
REITS
= NAREIT Index
Small Cap Stocks
= Russell 2000 Index
Small Cap Growth
= Russell 2000 Growth Index
Small Cap Value
= Russell 2000 Value Index
Annualized
F
IGURE
2.3 L
EADERSHIP OF
M
AJOR
A
SSET
C
LASSES
(1991–2002)
S
OURCE
: CTC Consulting
02 Chapter Maurer 6/20/03 4:57 PM Page 58
T
ABLE
2.4 C
ORRELATIONS
B
ETWEEN
A
SSET
C
LASSES
Asset Class
Asset Style
1 2 3 4 5 6 7 8 9 10
11 12 13 14 15
−0.25
−0.17 −0.12
−0.01 −0.01
−0.14 −0.14
−0.01 −0.09
−0.14 −0.11
−0.02 −0.24
−0.13 1.00
0.13 0.19 0.13 0.28 0.28 0.43 0.43 0.21 0.40
0.31 0.30 0.29 0.04 1.00
0.27 0.20 0.34
−0.02
−0.02 −0.06
−0.06 −0.01
−0.05
−0.09 0.02 0.13 1.00
0.15 0.20 0.25 0.17 0.17 0.29 0.29 0.12 0.28 0.24
0.37 1.00
0.05 0.09 0.08 0.66 0.66 0.50 0.50 0.45 0.75
0.89 1.00
0.01 0.04
−0.01 0.68 0.68 0.96 0.96 0.56 0.83 1.00
0.08 0.12 0.11 0.85 0.85 0.93 0.93 0.60 1.00
−0.04 0.10 0.08 0.64 0.64 0.60 0.60 1.00
0.06 0.10 0.06 0.76 0.76 0.98 1.00
0.06 0.10 0.06 0.76 0.76 1.00
0.11 0.13 0.18 0.98 1.00
0.11 0.13 0.18 1.00
0.62 0.71 1.00
0.82 1.00
1.00
Cash
Fixed-Income
Equity
Alternative
Real Estate
1 Short-Term Investments
2 Municipal Bond Portfolio
3 Taxable Diversified Bond
Portfolio
4 Passive Large Cap Equity
5 Active Large Cap Equity
6 Passive Sm/Mid Cap Equity
7 Active Sm/Mid Cap Equity
8 Active International Equity
9 Private Eq/LBO
10 Venture Capital
11 Long/Short Equity Hedge
12 Low Volatility Strategies
13 Distressed Equity Hedge
14 REITs
15 Real Estate Partnerships
CORRELATION MATRIX 2003–2007
The correlation co-efficient between two asset classes measures the e
xtent to which two assets are related.
It measures the sensitivity of returns for one asset class or portfolio
to that of another.
All correlations are based on the historical (
p
rimarily monthly) returns of benchmark indices for the
p
eriod Jan. 1990 to Dec. 2001.
59
02 Chapter Maurer 6/20/03 4:57 PM Page 59
Asset Class
Cash
Short-Term Investments
2.60% 0.00% 2.60% 1.40%
0.20% 2.40% 100.00% 100.00% 0.00%
1.54%
−1.46%
4.50% 0.00% 4.50% 3.50%
0.40% 4.10% 50.00% 50.00% 50.00%
4.10% 1.10%
35.00%
15.00%
5.65% 0.00% 5.65% 6.70%
0.40% 5.25% 50.00% 50.00% 50.00%
3.41% 0.36%
1.50% 7.00% 8.50% 21.90%
0.20% 8.30% 15.00% 15.00% 85.00%
7.95% 4.54%
1.50% 7.50% 9.00% 22.90%
0.80% 8.20% 50.00% 50.00% 50.00%
7.53% 3.79%
Fixed-Income
Municipal Bond Portfolio
Taxable Diversified Bond Portfolio
Equity
Passive Large Cap Equity
Active Large Cap Equity
Passive Sm/Mid Cap Equity
Active Sm/Mid Cap Equity
Active International Equity
Alternative Investments
Private Eq/LBO
Venture Capital
Long/Short Equity Hedge
Low Volatility Strategies
Distressed Equity Hedge
Real Estate
REITs
Real Estate Partnerships
Expected Inflation
**CTC Consulting derived the forecasted risks and returns for these asset classes.
**The management fees reflect CTC Consulting's expected fee schedule for each asset class. Actual fees may vary by manager and
by client.
N
OTE
: Table rates based on a $5 million account.
Before Fees
Income
(Yield)
Capital
Appreciation
Gross
Expected
Return
Standard
Deviation
Annual
Management
Fees**
Short-Term
Capital
Gains
Long-Term
Capital
Gains
Net
Annualized
Return
Net
Return
Turnover
Rate
Federal Bond Income/Short-Term Gains Tax Rate:
Federal Dividend/Long-Term Capital Gains Tax Rate:
Net Real
Return
After Fees and Taxes
Total Return*
2003–2007
1.20% 8.90% 10.10% 24.00%
0.90% 9.20% 50.00% 50.00% 50.00%
8.49% 4.71%
1.20% 8.40% 9.60% 23.00% 0.25%
9.35% 25.00% 25.00% 75.00% 8.89%
5.41%
1.80% 7.70% 9.50% 23.50%
1.00% 8.50% 50.00% 50.00% 50.00%
7.80% 4.02%
0.00% 16.00% 16.00% 35.00%
4.80% 11.20% 20.00% 20.00% 80.00%
10.72% 7.30%
0.00% 15.00% 15.00% 40.00%
4.60% 10.40% 20.00% 20.00% 80.00%
9.95% 6.56%
2.00% 13.25% 15.25% 11.00%
4.25% 11.00% 60.00% 60.00% 40.00%
8.85% 5.46%
3.00% 7.25% 10.25% 7.00%
3.25% 7.00% 85.00% 85.00%
15.00% 5.03% 1.87%
1.00% 13.00% 14.00% 20.00% 4.00%
10.00% 95.00% 45.00% 55.00%
7.04% 3.23%
6.00% 2.00% 8.00% 13.50%
1.00% 7.00% 60.00% 60.00%
40.00% 4.93% 1.82%
6.00% 6.00% 12.00% 24.00% 4.00%
8.00% 30.00% 30.00% 70.00% 6.92%
3.76%
3.00%
T
ABLE
2.5 T
EN
-Y
EAR
F
ORECASTED
R
ISKS AND
R
ETURNS
60
02 Chapter Maurer 6/20/03 4:57 PM Page 60
Zero
Inflation
Low Stable
Inflation
Rising
Inflation
Falling
Inflation
Entire
Period
US LT
Government
Bonds
1926–19451926–1945 1954–1965 1972–1981 1982–2000 1926–2000
Average Return
4.72% 2.06% 2.81% 12.55% 5.32%
Treasury Bills 1.07% 2.55% 7.78% 6.23% 3.82%
S&P 500
Index
S&P 500
Index
7.13% 15.67% 6.47% 16.88% 11.05%
Inflation Rate 0.07% 1.43% 8.62% 3.29% 3.08%
Risk-free Real
Rate
1.00% 1.12% −0.84% 2.94% 0.74%
TABLE 2.6 STOCKS, BONDS, T-BILLS (1926–2000)
SOURCE: Ibbotson Associates and U.S. Trust calculations. The risk-free real rate is
measured as the difference between the T-bill yield and inflation.
Investments 61
strategists exist who say they can predict what the future will bring.
These people believe that you can put all your eggs in one or a few
baskets. For the most part, they have not been proven correct.
Furthermore, we think that it is less risky to have a highly diversi-
fied portfolio than it is to own only the one least risky investment. For
example, if you were to invest only in Treasury bills, you wouldn’t
encounter much risk in terms of your principal. Treasury bills are
government-guaranteed so you don’t have to worry about losing any
money. But in 2003 you will only make about 1 to 3 percent on them,
which means that, although you are not exposed to the risk of loss, you
are exposed to the risk of inflation. In nominal terms, you can’t lose
money, but in real terms, you can, because if your Treasury bills earn
2 percent and inflation is at 4 percent, your money isn’t keeping up
with rising prices (and that’s before taking taxes into account). If the
purpose of money is to be able to buy things and the cost of buying
things is going up faster than the value of your money, you will lose
purchasing power (see Table 2.6).
02 Chapter Maurer 6/20/03 4:57 PM Page 61
The fact is, you can’t avoid risk. All investments are potentially
unstable. In other countries, many of the most conservative investors
who have saved money, built up their wealth, and invested in the least
risky investment (such as their own government bonds) ended up los-
ing all their money when their governments went broke or devalued
their currency.
Time
Besides diversification, another element is important to consider while
investing. That element is time. What is your time horizon? How long
are you going to wait before you judge the success of your investments?
Historically, U.S. Trust has taken a long-term view. We ask our clients
to think in long-term horizons, which can mean five years and beyond.
Today, too many investors feel pressure to shorten their time hori-
zon. They want to make money immediately. They want to work with
an advisor who had the best record for the last quarter of a year. They
want to see their investment rise within a few days. They want profits,
and they want them right away. This attitude has meant that many
portfolio managers are making decisions based on that constricted
time scale. They face tremendous pressures to succeed quickly, which
means they must shorten their time horizons.
Our insistence on using a long-term horizon differentiates
U.S. Trust from other wealth managers, but for us, this stance has
proven successful for 150 years. We have been able to adopt this longer
horizon because we are among the largest institutions at which the
majority of investment activities involve individual wealth, which is
therefore taxable, as opposed to wealth that accumulates for chari-
table institutions and pension plans tax free. Because taxes are involved,
we have incentives to avoid the pressure of short-term thinking. This
is because a big incentive exists within the tax system to hold assets
for a minimum of one year—it’s preferable to pay a 15 percent capital
62 Rich in America
02 Chapter Maurer 6/20/03 4:57 PM Page 62
gains tax instead of a 35 percent income tax. Also, the longer you hold
an asset, the longer you defer your tax bill.
We also are able to take a long-term approach because the major-
ity of our clients have been with us for a long time, and they’re not
looking to change investment advisors every time their portfolios dip.
Smart investors learn over time that dips are inevitable, and that we
are to be judged by long-term, rather than short-term, performance.
Still, there are risks involved in a long-term point of view as well.
The world is changing at a much more rapid pace than in the past, and
therefore we must stay abreast of current events, which can have a dev-
astating effect on the markets. (This is not an endorsement of what’s
known as market timing, which in effect means watching the market on
a minute-to-minute basis and trading because you believe you know
where the overall market will be in the very near future. As mentioned,
no one is clairvoyant, and that’s what market timing needs to be uni-
formly successful.)
These days it can be tough to maintain a long-term perspective,
especially with the daily barrage of media reports on the stock market.
But most of these reports reflect the short-term picture, and merely
explain what caused the market to go up or down that day. These
momentary ups and downs don’t tend to be worth monitoring. Think
of it this way: In general, people are risk-averse. Although it would
seem as though a $1 loss is equivalent to a $1 gain in emotional im-
pact, the average investor is actually about 2
1
⁄2 times more sensitive to
loss. So a $1 loss hurts as much as a $2.50 gain feels good. Or to put it
in investing terms, if you invest a million dollars in the stock market,
and it suffers a 20 percent decline, you’ve lost $200,000. To match or
offset the negative feeling of losing $200,000, you’d have to make
$500,000, or 2
1
⁄2 times the amount you lost, to feel equally positive
(according to Amos Tversky and Daniel Kahneman, 1986). Psycholo-
gists have posited several theories as to why this is the case, but the
bottom line is, it’s not rational.
Investments 63
02 Chapter Maurer 6/20/03 4:57 PM Page 63
On any given day, the market is likely to go down close to 50 per-
cent of the time. If you were very risk-averse, you would find that
news painful. If you stretch your time period out to one year, however,
the stock market will probably go down only a third of the time and
up two-thirds. This more closely approximates the 1 to 2.5 ratio of
good to bad that makes us as individuals feel okay.This means that if
you look at the stock market more than a few times a year, you won’t
be happy. If you look at your statement just once a year, however,
you’ll feel better. If you looked only once every three to five years,
you’d be even happier. Now we all know this sounds good in theory,
but it will not happen in practice, nor should it, given the world in
which we live.
64 Rich in America
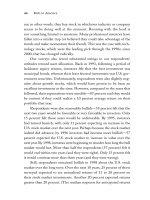
−35.0%
−7.5%
1.2%
4.3%
4
6.5%
20.1%
18.9%
17.9%
54.0%
28.6%
RANGE OF EQUITY RETURNS FOR DIFFERENT
HOLDING PERIODS (1933–2001)
One-year periods
Five-year periods
10-year periods
20 years
15 years
How time horizon affects asset allocation
While stocks have the highest average return of any
financial asset, they are also the most unpredictable
over short periods. The chart below shows the range
of returns for stocks held for various lengths of time
between 1933 and 2001. Eighteen of the 69 years
from 1933 to 2001 had negative returns, and the
one-year returns during that period ranged from
(−35.0%) to 54.0%. While the average return of 13.8%
was high, few investors would tolerate that kind of
uncertainty. Only three of the 63 five-year holding
periods had negative returns. There were no negative
returns for 10-year or longer holding periods.
FIGURE 2.4 RANGE OF EQUITY RETURNS
02 Chapter Maurer 6/20/03 4:57 PM Page 64
Long-term investing helps to protect against an irrational emo-
tional response, just as a good advisor will protect us against similar
emotional responses. People are overly susceptible to the emotions
they feel when they lose money. But investments that give you good
return over long periods of time involve short-term setbacks. The best
investors tend to be those who don’t worry about day-to-day fluctua-
tions. They look at the long term. So should you (see Figure 2.4). That
doesn’t mean you can afford to be oblivious to day-to-day economic
and geopolitical news, but you must view this news through the filter
of a long-term investor with an appropriate asset allocation.
Investment Truisms
There are many truisms to live by in the world of investing. Probably
the most important is simply to be sensible. Anything that seems too
good to be true probably is. There are no real shortcuts. When some
salesperson appears on television and promises that he or she can
quadruple any investment in 30 days, the only person whose wealth is
truly going to quadruple is that of the salesperson.
The most obvious and recent example of this maxim is the famous
Internet bubble. Bubbles generally occur every 30 to 40 years, and it
takes another generation to forget them. The generation that started
investing in the 1990s, having never seen a bubble, grew up thinking
that a 20 percent annual return was a reasonable expectation. For a
while, it seemed to be. Everything was easy. You didn’t need to hire
a professional. Cab drivers were making money buying call options.
The trend was up. These new investors didn’t know about risk. They
thought risk meant not placing 100 percent of their money in equities,
and not having all of these stock holdings in the technology sector.
The problem with this sort of thinking is that a 20 percent return
is not reasonable over a prolonged period of time, as anyone who has
invested their money since March 2000 will tell you. Some investors
Investments 65
02 Chapter Maurer 6/20/03 4:57 PM Page 65
who were around for the 1970s bear market and the collapse of those
Nifty 50 stocks mentioned previously were reluctant to participate in the
market of the 1990s. Instead, they sat on the sidelines, fully invested in
fixed-income securities. And although these people missed the spec-
tacular collapse, they were still worse off, because the returns for the last
12 years in equities still exceeded returns in the fixed-income markets.
Know Yourself
Know your financial objectives and investing goals. If you don’t know
what you want, you won’t be able to achieve it.
Let’s say you’ve just sold your business for $5 million. You feel
richer than you ever thought possible. But what is your objective now?
Do you want to preserve and protect your new wealth? Do you want
to make it grow? Do you want to take risks? If you don’t feel comfort-
able taking risks, then you have to invest very conservatively and be
satisfied with lower returns. This may mean you’ll have to adjust your
standard of living to live within your investment returns now so you
can save excess returns to negate the erosion of your purchasing power
caused by inflation.
A major part of wealth management is managing yourself though
the various phases in your lifecycle. When you first start out in life,
you care mainly about paying your rent and buying a few luxuries
now and then, like a fancy meal. As you get older, your priorities
change. Perhaps you’ll start a family or settle on a career that brings
with it a variety of challenges and rewards. At each point, you’ll need
to create or modify your investment plan. In business, you need both a
long-term and a short-term strategy. The same applies to individuals.
People who are successful at accumulating wealth have such plans in
place and know what they want to accomplish.
During our first session with our client Walter, he told us exactly
what he expected his financial life to look like. At the time, he was
66 Rich in America
02 Chapter Maurer 6/20/03 4:57 PM Page 66