introduction to spss RESEARCH METHODS & STATISTICS HANDBOOK PHẦN 6 ppsx
Bạn đang xem bản rút gọn của tài liệu. Xem và tải ngay bản đầy đủ của tài liệu tại đây (129.48 KB, 10 trang )
51
Go to Edit, Replace and change O into Observed and then E into Expected. Make
sure you click on More and check that the „Find Whole Words Only‟ box is checked.
Note that if you had not selected the table, Word would have changed everything in
the document.
As you can see, the columns are no longer wide enough. Select the table and go to
Table, Cell Height and Width and change it to something suitable. Try at least one
inch.
Now try formatting the table. Just as with Excel, you must select the line you want
and then add the bordering. The slow way to do that is to go to Format, Borders and
Shading each time. The fast way to do it is to use the borders icon in toolbar at the
top of your screen.
Now select the top row. Point to the left of the word „OBSERVED‟, so that the
insertion point turns into an arrow. Click, and the row is selected. Put a ¾ point line
on the bottom of the row, and change the line width option to a 2¼ point line for the
top of the row.
(By the way, to put in special characters like ½ or go to Insert, Symbol and then
choose what you want. While we‟re on the subject, to put an equation into Word, go
to, Insert, Object „Microsoft Equation 3.0‟. Play with it, if you want).
Returning to the table. On the bottom row, put in a 2¼ point line. To insert a column
select the OBSERVED column by pointing above the word OBSERVED until it
changes to a black arrow, then click. Now using the right mouse button, insert a
column. Enter in the information, as given on the spreadsheet.
It is also possible to vertically centre text, such as the table, by going to File, Page
Setup, Layout and changing vertical alignment to centre. You might need to go to
File, Print Preview or Page Layout view in order to see the full effects.
If the table sticks out over the edge of the page. Select the table and autofit it from
Table, Cell Height and Width, Column. As you can see, the titles are now too big.
You can get round that by shrinking the font size or abbreviating the titles. Improvise.
Graphics and Arrows
Well, actually just arrows. If you need to do a few graphic bits in Word, such as
arrows and boxes, your best bet is do use the Drawing facility. Turn the Drawing
toolbar on in a similar way to turning on the Borders toolbar.
Type the return key a few times under the table. This now allows us to enter freeform
text using the Drawing facility. Click on text box, towards the left of the toolbar. Now
drag an area under the table and type the text into the box. The size and font of the
text in the box is formatted in the normal way. Make it 14 point. Double click on the
edge of the text box and increase the box to one point and the edge to dashed. Choose
fill colour and choose light gray.
52
Now draw an arrow pointing to the last column. Double click on the arrow to change
the options such as its width, size of arrowhead etc. Make the arrowhead wider and
longer, and make the line 2 points.
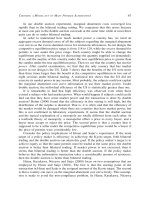
SOURCE
OBSERVED
EXPECTED
OBSERVED-
EXPECTED
(OBSERVED-
EXPECTED)^
2
(OBSERVED-
EXPECTED)^
2/EXPECTED
OPY
13
8.80
4.20
17.60
2.00
OPN
14
18.20
-4.20
17.60
0.97
OFY
2
6.20
-4.20
17.60
2.84
OFN
17
12.80
4.20
17.60
1.37
Creating Tables in Word
To create Tables in Word, go to the point in the document where you want the table
inserted and go
Table
Insert Table
You will then be asked how many columns and rows you want. Select the number of
each that you want then press the AutoFormat button. This is basically a step by step
guide to creating the layout of a table. Selection the options you want and then click
the “Continue” button for each dialogue box, until you come to the end. You should
then have a table you can add rows/columns to and do all the editing described in the
lesson above.
Creating Templates
So far we have seen how you can format styles to make typing large bodies of text
both pretty and functional. But as you have no doubt noticed by now, when you leave
a document you also leave the formatting with it. How can you change that?
Templates
When you open a new document, Word defaults to the normal template. The normal
template basically is a document with no formatting and with everything set to
default. To make things a little more exciting we have to define a template.
Go to File, New and choose template. Go to File, Save As and see how it selects save
as document template? Cancel that last command. Now, set up some styles that will
be useful for when you eventually come to type up your next few pieces of work.
Chi-Square Table
53
Think back to the session where you created those styles. In this template, do the
same. You don‟t actually need any text, though it may help if you type in a few lines
to show what the different styles actually do.
The whole point of doing this is that when you come to do future work, anything
saved in the template will be present. So, if you want a standardised title page then
create it now, obviously leaving gaps for titles and dates, etc.
When you are happy with your template, go to File, Save As. Call it something like
„Essays‟ or „Coursework‟. All the styles and any standard text will now be saved as
the template. Close the template down, and close Word. Now, when you re-enter
Word it still gives you the default „Normal‟ template. Go to File, New and choose the
template name and OK. As if by magic, the formatting and styles appear.
When you open a new document, several other templates are offered to you. Try
opening Elegant Letter.dot. Note the blanks you have to fill in to create quick letter?
Other Bits
Made a mistake? In Word we undo mistakes by going to Edit, Undo. You can also
redo things by going to Edit, Redo. If you had a long list of variables on consecutive
lines and wanted to sort them alphabetically (make sure there is a „hard return‟ after
each variable, using Edit, Replace if necessary by replacing a space with a hard
return from Special Characters), you can select what you want sorted and go to Table,
Sort. You can also splice the document into two windows, for those fancy multi-task
operations, by using Window, Split and then clicking where you want to have the
split. Get rid of it by moving the split into the toolbar. Now, from Tools, choose
Spelling and run a spell check. You can also run a Grammar check. Open a
document. With that document open, do a word count, from Tools, Word Count.
54
MS Excel Exercises
A spreadsheet is a cross between a calculator and a word processor, with a bit of
statistical package thrown in. Its main use is in automating repetitive number
crunching tasks or for formatting and cleaning data files. A spreadsheet consists of a
matrix of rows and columns, each identified by a cell name (its „address‟). As you
move around the sheet, you are selecting different cells, and you can type in data and
formulae.
Entering Data and Using Formulae
Your mission today is to copy in the spreadsheet (exactly – including bold print,
larger font, border lines, etc.) and learn how to use formulae and names to
demonstrate different coefficients.
Entering Text
Most text is entered just as in Word. Note that if a line is too long for a cell then it will
run over the other cells. This usually causes no problems, though it may seem
counter-intuitive. Copy the top half of the spreadsheet, and don‟t forget to use
formatting. Change the print layout to landscape from File, Page Setup, Landscape.
This is very similar to Word. Watch out for the borders - look on the toolbar towards
the right hand side. Don't forget to use Edit, Undo if it goes pear-shaped.
Don't bother entering the numbers in the second part of the sheet (where it starts with
Phi) - these will change later. Do note that the formatting for the coefficients is
different - select these four cells and go to Format, Cells, Number and then switch
the decimal places to 2.
Most of the sheet is text, but some cells are named or are formulae. This is where the
fun begins.
Names and Formulae
Basically, a named cell is one which has a pseudonym. Hence, when referring to a
name cell, rather than type in cell addresses, which are not meaningful, we can use
names, which are.
In the Data Entry Area, name cell D23 as „PP‟ by going to Insert, Name, Define and
calling it PP, meaning variable 1 Present and variable 2 Present. Name E23 as „PA‟
etc. See how just under „Arial‟ the cell address changes to the name.
55
Formulae are used in cells to perform calculations. If you type in the formula then the
coefficients will change automatically as you change the data entry area. Hence you
can see for example how joint non-occurrence is not used by Jaccard‟s, even the
figure is huge compared to the rest.
A formula always starts with an „=„ sign. So, in cell G24 (named „Sum‟) the line
should be „=PP+AP+PA+AA‟. If you enter data into the named cells in the data entry
area, you will see that the Sum automatically changes.
The Formulae
If we weren‟t using names, the formula for Jaccard‟s would be
=D23/(D23+D24+E23). Note the use of brackets - this is highly important but not
very useful. Using the names created earlier, you can now type into cell C33 the
formula =PP/(PP+AP+PA). This is more meaningful, and emphasises the simplicity
of Jaccard‟s as well as the fact that it ignores joint non-occurrence (i.e. AA). Provided
there are values in the data entry area, Jaccard‟s coefficient will be calculated
instantly.
Try entering the formulae for the other coefficients. These are:
Phi
AA PP AP PA
AA AP AA PA PP AP PP PA
* *
( )*( )*( )*( )
(Looks vaguely familiar? It‟s Pearson‟s dichotomised. Squareroot is achieved by
raising to the power of 0.5 i.e. ^0.5)
Don‟t forget - careful with those brackets.
Testing the Formulae
Enter different values into the data entry area and see how the different coefficients
give wildly different results. Moral of the story: make sure the coefficient you use is
appropriate or risk completely invalid results.
Other related questions:
What are the effects of the value (e.g. 0, 10 and 1000) of the AA cell on different
coefficients?
Doing Calculations in Excel
Now we take this a stage further and show how formulae are used in more advanced
calculations. Since much of this has been done before, the instructions in this exercise
will be more brief.
56
We‟re going to investigate the past record of MSc candidates on the exam using the
variables result (pass/fail) and bribed examiner (yes/no). To do this we will use chi
squares.
Contingency Tables
Type in the contingency table, then select it all and copy it further down the page to
make the observed table. Careful of the formatting. Numbers should be changed by
Format, Cells, Number, and setting decimal places to 2. Borders are Format, Cells,
Border (or you can use the borders icon from the tool bar).
Note that in the observed table, the values are called various names. Remember, that‟s
Insert, Name, Define. Use formulae to calculate the totals columns, for example the
„Yes‟ column is „=OPY+OFY‟, with O standing for observed, P for pass. Got the
picture?
As you are all aware, the chi squared test examines the observed (i.e. empirically
obtained) results with the statistically expected set of results. Clearly if there is a
significant difference between observed and expected then there is hypothesised to be
some mechanism causing this difference and hence we can conclude that the observed
results are not due to chance factors.
Chi squared is given by:
Expected
ExpectedObserved
2
2
)(
To calculate the statistically expected results, we use probability theory. If you are
comfortable with this, then carry on. If not, then check with the textbooks.
Note the formulae used to obtain the expected results. For example, expected for pass
and yes is pass total multiplied by yes total all divided by the number of observations
i.e. „=(Yes*Pass)/Sum‟. Do this for all expected results.
Under the values part, put „=OPY‟ under the O column (where the number 13 is), and
=„EPY‟ under the E column (where the number 8.80 is). Now type the rest of the
numbers into the O and E columns. Under the O-E column, first type '=', then click
two cells to the left with the value of OPY in it. Now type '-', and click one cell to the
left with the value of EPY in it. Press return. See how it automatically enters the cell
address?
Select the cell you just typed the formula into and drag down onto the three cells
below it. Go to Edit, Fill, Down and the formula will be copied down. Note how the
formula changes automatically, relative to where the values are? Do the same for
squaring the result and dividing it into E.
57
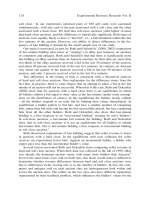
Manual Chi Square Effort
Contingency Table:
Bribed Examiner
Yes
No
Total
Result
Pass
OPY
OPN
Pass
Fail
OFY
OFN
Fail
Total
Yes
No
Sum
Observed:
Bribed Examiner
Yes
No
Total
Result
Pass
13
14
27
Fail
2
17
19
Total
15
31
46
Expected:
Bribed Examiner
Yes
No
Result
Pass
8.8
18.2
Fail
6.2
12.8
Values:
O
E
O-E
(O-E)^2
(O-E)^2/E
13
8.80
4.20
17.60
2.00
14
18.20
-4.20
17.64
0.97
2
6.20
-4.20
17.64
2.85
17
12.80
4.20
17.64
1.38
Chisq.=
7.19
58
For our last trick - to sum, automatically click on the cell where you want the chi
square value to go and then on the summation symbol () on the toolbar. Drag over
the last column and press return to obtain the sum.
The chi square value can be checked with statistics table to judge its significance.
Degrees of freedom are given by (r-1) (c-1) i.e. the numbers of rows in the
contingency table minus one multiplied by the number of columns in the table minus
one.
Some Questions For You To Consider
What happens if the sample size drops below 45? What if it drops below 5 in any
cell?
59
APPENDIX
BASIC STATISTICS
60
Basic Statistics
A statistic is a structured piece of data, carrying meaningful information. Research
begins when we start to investigate these statistics systematically, i.e. to analyse them.
Broadly, there are two sorts of statistical analysis:
Descriptive statistics: this involves analysing the parameters of the sample and
assessing the characteristics of the population.
Inferential statistics: most often this involves hypothesis testing using a sample to
test differences in a population.
To begin with, we will concern ourselves with descriptive statistics.
Data: Its Collection and Its Disposal
So, how do we obtain data? To convert information into data requires some sort of
coding framework consisting of variables, or attributes, relating to the domain of
concern. People (cases) are sampled representatively so that clues as to the nature of
the population can be calculated.
Attributes (Variables)
1:
2:
3:
4:
5:
Case 1
Case 2
Case 3
Case 4
Case 5
Case 6
Issues in Coding Data
Issues involved in the choice of content categories:
exhaustivity - ensure all cases are covered by the options or levels in the category
exclusivity - each case must have only one possible option or level in the category
relevance - the item must pertain to the domain of concern
adequate coverage of domain - the domain must be adequately covered
specificity - the definition of each category must be precise to allow for consistent
coding (this also relates to inter-rater reliability - more later).
This data can be displayed in a number of ways: as percentages, ratios, in a bar chart,
cumulative frequency chart, pie chart, etc. Each of these describes the characteristics
of the sample, hence the term descriptive statistics.
Often these data sources are noisy and hence we must take care in the construction of
coding frameworks and we must determine which forms of analysis are feasible. We