INTRODUCTION TO QUANTITATIVE RESEARCH METHODS CHAPTER 5 ppt
Bạn đang xem bản rút gọn của tài liệu. Xem và tải ngay bản đầy đủ của tài liệu tại đây (652.5 KB, 38 trang )
5
`DATA! DATA! DATA!'
Analysing data from the inquiry
'Data! data! data!' he cried impatiently.
'I can't make bricks out of clay'
Sherlock Holmes,
The Adventure of the Copper Beeches
`Data' never comes to the social scientist clean, like cement for bricks. As we
found in Chapters 3 and 4, the society a person lives in ± and a person's
beliefs ± can directly affect what counts as a `clue' and what counts as
`evidence'. Holmes himself was not entirely free from the racial and gender
stereotypes of his time. Holmes says, for example, that `emotional qualities
are antagonistic to clear reasoning', but he is equally able to proclaim as fact
that `women are never to be entirely trusted' (The Sign of Four). Operational
definitions can be affected by the society we live in. But it is wrong to then
conclude that we can never retrieve useful quantitative data from the study
of psychology or society. Holmes, for all his faults, could see alternative
points of view, even if he did not like them: `if you shift your own point
of view a little, you may find it pointing in an equally uncompromising
manner to something entirely different' (The Boscombe Valley Mystery).
Recognition of the problems of validity and making sense of common
sense is a good first step in creating a valid and reliable research study.
Always ask to see a person's research design; always ask to see their defini-
tions. The same principle holds for exploring statistical data. Always ask for
the data! Numbers are not neutral ± they form patterns and they tell a story.
LOOKING AT THE CLUES: The Statistical Sleuth
Good detective work involves making sense of the clues, making sense of
the variables, collected. Hercule Poirot, for instance, sometimes guesses
who committed a murder before he has the evidence. `As I say, I was
convinced from the first moment I saw her that Mrs. Tanios was the person
I was looking for, but I had absolutely no proof of the fact. I had to proceed
carefully' (Christie, 1982: 247). Proof of the fact is a part of data analysis in
social science research. Proceeding carefully is exactly what you need to do
when you start trying to make sense of individual clues.
Why Explore Data?
Some research studies have well-defined hypotheses that are tested by the
researcher. Some studies, such as People's Choice, have broad research ques-
tions that invite exploration. In both cases good data analysts plot their data
before they use sophisticated statistical procedures. Graphical displays of
data are one of the most important aids in identifying and understanding
patterns of data and relationships among variables. Indeed Chambers et al.
(1983: 1) go as far as saying that `there is no statistical tool that is as power-
ful as a well-chosen graph'.
Over the past two decades a number of new methods for displaying data
have been developed that allow for more informative examination of data.
Most of these methods belong to a family of techniques known as explor-
atory data analysis (see Tukey, 1977). These tools are particularly appropriate
for the statistical sleuth ± or the `data snooper', ± as Abelson (1995) aptly
put it. The data snooper is an analyst who is vigilant of odd patterns or
irregularities in data. These irregularities may suggest that something
strange is going on ± for example, calculation errors, data entry errors,
data not conforming to distributional assumptions or, in more serious
cases, data that are fraudulent.
Graphs and plots draw out hidden aspects of the data and relationships
among variables that a person may not have anticipated. These `data-driven
discoveries' may spark new investigations previously not considered and
may eventually lead to changes in the theories or hypotheses driving the
original investigation.
Graphs and plots may complement textual material that in turn may
provide a more complete picture of the issue under investigation. Good
graphical representations are also good communication. They are easily
grasped and therefore easily remembered.
PLOTTING DATA
Stem and Leaf Displays
Variables vary and one of the best ways to see how they vary is to use a
stem and leaf display. The stem and leaf display is a quick and easily
constructed picture of the shape of a distribution (Tukey, 1977). You do
not need a high-powered computer to generate one; if you have a piece
of paper and a pencil you can make a stem and leaf display by following
some simple steps.
The basic idea of a stem and leaf display is that the digits that make up
the numerical values are used in sorting and displaying the numbers. The
digit(s) at the beginning of each datum (or leading digits) in a distribution
serve to sort the data; the remaining or trailing digits are used to display the
data. The leading digits are also referred to as stems while the trailing digits
are referred to as leaves.
BALNAVES AND CAPUTI
11 0
A set of very simple rules (based on Moore and McCabe, 1993; Velleman
and Hoaglin, 1981) allows us to construct stem and leaf displays:
1 Separate each value into a stem and a leaf. You will need to choose a
suitable pair of adjacent digit positions for each datum, say, tens digits
and units digits. Usually, stems have as many digits as necessary for
displaying the data appropriately for your purpose. On the other hand,
each leaf usually has just one digit.
2 Construct a column of all the possible sets of leading digits or stems for
the range of values in the distribution in descending order. Draw a
vertical line to the right of these stems.
3 For each score, record the leaf on the line labelled by its stem and
arrange the leaves in increasing order from left to right.
These rules are applied and illustrated in Example 5.1.
Example 5.1: Stem and leaf display
Performance on an arithmetic test is measured in a small class of children.The scores
are as follows:
16 18 14 23 17 13 19 21 16
To construct a simple stem and leaf display we begin by choosing a pair of adjacent
digits. In this case a suitable pair of digits would be the tens digit and the units digit.
For the value 16 we would split the value 1 (tens digit) and 6 (units digit) where `1'
would be the stem and `6' would be the leaf. Now split each value between the two
digits.We construct a column for the stems and then write the leaves corresponding
to each stem in ascending order.
Stem Leaf
1 3466789
213
3
Represents values 21
and 23
An important feature of stem and leaf displays is that they represent all of
the data in the distribution. The data are preserved exactly in the `stem±leaf'
arrangement. It is possible to reconstruct the exact values that are repre-
sented in the display.
DATA! DATA! DATA!
111
In Example 5.1 we defined the leaves associated with each stem to range
from 0±9. Sometimes this range is inappropriate. This is especially the case
when you have lots of data. If we had 1,000 observations that ranged
between 10 and 30, a stem and leaf display based on stems whose leaves
ranged from 0±9 would produce a display with only three very long stems ±
not a very helpful display. One way to accommodate larger datasets and to
obtain a plot that is more meaningful is to `split' the stem and correspond-
ing leaves into smaller segments. For instance, each stem could have two
segments, 0±4 and 5±9. We will use 1
.
to represent values that lie between 10
and 14, and 1* to represent values that lie between 15 and 19. In other
words, the symbols `
.
` and `*' denote the leaves 0±4 and 5±9 respectively.
If we apply these new stems to the data in Example 5.1, we then have a new
stem and leaf display that looks as follows:
Stem
Leaf
1
.
34
1*
66789
2
.
13
You can see that we have a different-looking display. The shape of the
distribution has changed. How you split the stem is up to the data snooper.
He or she needs to choose a stem that will best identify the salient features
of the data under investigation.
Stem and leaf displays can also be used to compare two distributions.
Such plots are sometimes referred to as back-to-back plots. For example, we
may be interested in comparing subjective computer experience using the
Subjective Computer Experience Scale among a sample of 10 male and 10
female undergraduate psychology students (Rawstorne et al., 1998). High
scores indicate greater negative computer experience. The data in Table 5.1
are followed by the back-to-back plot.
We can clearly see that the distributions for males and females are differ-
ent. Whether these distributions are statistically different is a question we
will answer in the next chapter.
Visual representations of data can provide us with clues when we suspect
`fishiness' in a set of data. Abelson (1995) cites an example from the cele-
brated Pearce-Pratt studies on tests of clairvoyance (Rhine and Pratt, 1954).
An experimenter (Pratt) turned over decks of symbol cards and recorded
the sequence, while the clairvoyant (Pearce), who sat in another building,
recorded his impressions of what the sequence of symbols had been. A third
party then compared the lists and recorded correct matches. There were five
possible symbols, so the probability of a match by chance was 20 per cent.
However, the reported success rate for matches was 30 per cent ± a statis-
tically significant result!! This was quite an extraordinary result, but one
BALNAVES AND CAPUTI
112
that led critic Hansel (1980) to think about other possible explanations,
including fraud! The key observation Hansel made was to note that the
success rate was highly variable. Some days yielded upwards of 40 per
cent correct, but other days only 15 per cent correct. Why? Inspecting the
site on the Duke University campus, Hansel constructed an elaborate
hypothesis of fraud. The receiver Pearce, motivated by notoriety as a pre-
sumed psychic, cheated. `On many of the days, he slipped out of the other
building as the trials began, hid across the hall from Pratt's office, and stood
on a table from which he could see Pratt's symbols through a pair of open
transoms. With enough time to copy some or all of them, he left his hiding
place and simulated an arrival from the other building. On his symbol
sheet, he made sure not to look too perfect, but otherwise produced strong
``data''. Pratt, his back to the transoms, was an innocent party to the decep-
tion' (Abelson, 1995: 82).
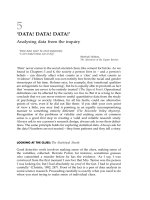
A stem and leaf plot of the ESP data got Hansel thinking. The plot is
reproduced in Figure 5.1 and represents successful hits per 50 trials.
Hansel found a gap at around the values 10, 11 and 12 ± the gap where we
would expect a success rate of 20 per cent! The distribution appears to have
two modes ± a cluster for success days and a cluster for failure days! Could
cheating be occurring? Hansel thought so.
Histograms
Stem and leaf displays are useful, but they become cumbersome to con-
struct if you have very large numbers of observations and especially if you
do not have access to a computer. One way of dealing with this problem is
DATA! DATA! DATA!
TABLE 5.1 Example of back-to-back plot
Males Females
32 40
45 41
48 60
50 65
55 66
53 55
52 57
45 58
32 67
60 62
Males Females
22
3
855 4 01
5320 5 578
0
6 02567
113
to divide the range of values into intervals and report the number (or
frequency) of observations that fall into each interval. Assume you are a
statistics lecturer and you have 100 students enrolled in your introductory
statistics class. Assume also that your students have sat their final exam for
which they can obtain a mark out of 100. Table 5.2 provides the appropriate
layout.
This table is commonly referred to as a frequency distribution. Sometimes it
is more interesting to examine the relative rather than actual frequency of an
interval. The relative frequency of an interval is obtained by dividing the
frequency of the interval by the total number of observations. This fraction
can also be reported as a percentage. Relative frequency distributions
are useful if you wish to compare either parts of the same distribution or
distributions from two or more groups.
BALNAVES AND CAPUTI
2 4
2 333
2 0000001
1 89
1 677
1 445
1 3333
1
0 8889999
0 6
0 55
0 3
A gap in
the data
!!
FIGURE 5.1 A stem and leaf display of ESP data (source: Abelson,1995: 82)
TABLE 5.2 Frequency distribution table for grouped data
Interval Midpoint Frequency Relative frequency
90^100 95 5 0.05
80^89 85 8 0.08
70^79 75 15 0.15
60^69 65 25 0.25
50^59 55 36 0.36
40^49 45 8 0.08
30^39 35 3 0.03
20^29 25 0 0.00
11 4
A histogram is a graphical representation of a frequency distribution. The
horizontal axis is broken into segments representing the intervals of the
scores. The vertical axis represents the frequency of observations. Above
each interval on the horizontal axis we draw a bar with height representing
the frequency associated with that interval. An example of a histogram of
the examination marks data is presented in Figure 5.2.
Boxplots
The boxplot is another useful exploratory data analytic technique for repre-
senting data visually. Boxplots are useful because the plot depicts the im-
portant features of the distribution. A very simple way of examining a
distribution is to look at the values that represent:
1 the middle of the distribution (we refer to this value as the median);
2 the smallest (minimum) and largest (maximum) value in the distri-
bution;
3 the number that represents the middle value between the median and
the minimum value (we will refer to this value as the first quartile); and
4 the number that represents the middle value of the scores between the
median and the maximum value (we will refer to this value as the third
quartile).
The term hinge is also used to describe a value in the middle of each half of
the distribution defined by the median. Hinges are similar to quartiles. The
DATA! DATA! DATA!
Examination Marks
95.085.075.065.055.045.035.0
40
30
20
10
0
FIGURE 5.2 Histogram of hypothetical examination marks
115
difference between hinges and quartiles is that hinges are defined in terms
of the median. They are often located closer to the median than quartiles.
The important features of most distributions of scores can be summarized
by five values: the minimum and maximum values, and the median and the
first and third quartiles. These five values are known as the five-number
summary. A boxplot is simply a visual representation of the five-number
summary (Velleman and Hoaglin, 1981).
The first step is to construct a `box' whose ends are defined by the first
and third quartiles. The length of the box is the difference in the values
of the quartiles. The second step is to draw a line within the box
represented by the median value. The third step is to draw lines outside
the box corresponding to the minimum and maximum values. These
lines are also known as whiskers. Sometimes the location of the whiskers
is defined differently. Some data analysts prefer to define the whiskers
of a boxplot in terms of the values that are 1.5 times the difference
between the quartiles. If there are scores beyond these modified whisker
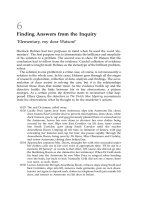
values, then they are plotted individually. Figure 5.3 gives the anatomy of
a boxplot.
We can tell a great deal about a distribution of scores by examining its
corresponding boxplot. Consider two hypothetical variables X and Y.A
distribution of values for these variables is presented in Table 5.3.
By just `eye-balling' the data it appears that the values for X are more
skewed than the values for Y. The boxplots for the distribution of X and Y
are presented in Figure 5.4. Some features of these plots are noteworthy.
One observation is that the boxplot for X has only one whisker, an indica-
tion that the distribution is skewed. You will also see that the line represent-
ing the median is slightly `off-centre'. This is further evidence that the
distribution for X is skewed. On the other hand, you will notice that the
median for the distribution of Y is in the middle of the `box' component of
the boxplot, suggesting that the plot is not skewed.
BALNAVES AND CAPUTI
Whiskers
Median
Quartil
e
Quarti
le
FIGURE 5.3 The anatomy of a boxplot
11 6
With a little experience, the data snooper can use boxplots to identify
particular features of a distribution. There are two key questions the data
snooper can ask when examining a boxplot. First, is one whisker longer
than the other whisker? If the answer is yes then this is an indication that
the distribution is skewed. With skewed distributions, the bar representing
the median will be off-centre. The second question one can ask when invest-
igating a boxplot is whether the `box' component of the plot is compressed
DATA! DATA! DATA!
ng
1010N =
YX
10
8
6
4
2
0
1
FIGURE 5.4 Boxplots for two hypothetical variables X and Y
TABLE 5.3 Hypothetical data for variables
X and Y
Variable X VariableY
1.0 0 1.0 0
1.0 0 3.0 0
1.0 0 4 .0 0
2.00 5.00
3.00 6.00
3.00 7.00
4.00 8.00
5.00 5.00
4.00 5.00
3.00 4.00
117
or elongated. The `box' component represents the spread of the middle half
of the distribution of values. If the `box' looks compressed, then the values
in the middle half of the distribution are `close together', falling within a
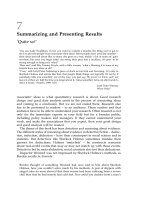
narrow range of values. Figure 5.5 shows these characteristics in two side-
by-side boxplots.
Boxplots are useful visual aids. But one should not rely solely on them for
understanding a set of data. In some cases, a boxplot can be misleading. For
instance, if the data you have just collected are bimodal (have two modes),
then a boxplot of those data will not indicate the presence of those modes.
In this case, a stem and leaf display would identify the bimodality of the
data, and provide the data analyst with a more accurate `picture' of the
data. Boxplots therefore should never be interpreted in isolation.
Tables, Graphs and Figures
`Getting information from a table is like extracting sunlight from a cucum-
ber.' Although this quote from Farquhar and Farquhar (1891) comes at the
turn of the 19th century, there are still instances in which the words ring
true in the 21st century.
Our knowledge about best practice with tables and graphs has improved
since Farquhar and Farquhar's day. Wainer (1992) found, from an analysis
of the use of tables and graphs to represent measurements, that they are
best used for three main purposes:
1 Tables and graphs can be used to identify and to extract single bits of
information; for example, what types of crimes were committed in
Sydney, Australia in 1999?
2 Tables and graphs can be used for trends, clusters or groupings; for
example, have the types of crimes in Sydney changed during 1995
to 1999?
BALNAVES AND CAPUTI
Compressed distribution
Whiskers are different
lengths – skewed
distribution
Median off ce-ntre
FIGURE 5.5 Side-by-side boxplots
118
3 Tables and graphs can be used to make group comparisons; for example,
we can ask the question, which crime is most frequent? Are the types of
crimes committed in Sydney different from those in London?
Tables and graphs represent a convenient and an effective way of summar-
izing information. A good table should enable the reader to understand at a
glance information that would be difficult to grasp if presented in the text.
A good table is simple and conveys information concisely.
The components of tables and graphs have also been the subject of study.
Sternberg (1977) said that a table has several key components:
1 Tables should be numbered. It is important to be able to identify a table
accurately when it is being discussed in the text,
2 Tables should be labelled appropriately and concisely. The title should
be unambiguous and understandable without reference to the text,
3 Tables usually contain columns. These columns should be clearly
labelled.
Sternberg identified four types of column headings. The first type of head-
ing is a stubhead. This column is typically located on the left of the table
and usually lists the independent variables in the study. The second type of
heading is called a boxhead; these are the headings at the top of a table.
Boxheads may cover more than one column. These subdivisions of a box-
head are referred to as column heads. The final type of heading that
Sternberg identified was a spanner head. Spanner heads cover the entire
body of a table. Some of these heading types are illustrated in the example
in Table 5.4, from Ho and Zemaitis (1981: 24).
The body of the table can contain both numerical and written content. In
the case of numerical content, the level of precision should be no more than
the data justify. Tables can also have footnotes. These should be informative
and concise.
Figures also enable the researcher to present information concisely.
Figures are useful because we can see at a glance conspicuous features
of the data. However, figures and graphs do have one important dis-
advantage ± they do not necessarily reveal precise values. Tables, on the
other hand, are precise and concise tools for conveying data and statistical
information (Sternberg, 1977).
Figures and graphs, like tables, should be titled. The title (also referred to
as the figure caption) should describe clearly and concisely what the graph
is reputed to demonstrate. The reader should be able to understand what
the figure or graph is about from the title without needing to refer to the
text. Figures should also be numbered. We usually use Arabic numbers to
refer to figures (Sternberg, 1977).
Finally, the text should not reproduce material presented in tables and
graphs. Obviously, it is important to discuss graphs and tables. They are,
after all, summaries (visual summaries in the case of graphs) of data and
DATA! DATA! DATA!
11 9
information, and therefore need to be explained and elaborated in the text.
However, it is not good practice to replicate the content of a table or graph
in the text.
Does a Picture Always Paint a Thousand Words? Some issues with
representing data in graphical and tabular form
Although graphs and tables can be effective and efficient ways of conveying
and summarizing large amounts of information, there are occasions where
these tools can be used to mislead the inexperienced statistical sleuth.
One common trick used by researchers (and market researchers and
advertisers in particular) is manipulating the scale intervals on a graph in
order to exaggerate the result or finding. Let us assume that we have sur-
veyed the residents of a large Australian city to examine the preferred
telecommunications carrier. The researchers find that 53 per cent of respon-
dents preferred Carrier A while 47 per cent of respondents preferred Carrier
B. We can present these findings in a histogram as shown in Figure 5.6.
An inspection of this graph suggests that, although there is a difference
between preferences, this difference is small. Now consider the same data
presented in a somewhat different manner in Figure 5.7.
By changing the scale values in the vertical axis we have exaggerated the
difference between the preference for the two carriers. Note that in the
second figure we start the values on the vertical axis with 44, not 0 as is
the case in Figure 5.6. The experienced data snooper will check the values
on the scales depicted in graphs. As a rule of thumb, the scale values on the
vertical axis should begin with 0.
BALNAVES AND CAPUTI
TABLE 5.4 The anatomy of a table (used by permission)
Table number
Table label
Table1
3
3
Number and proportion of male and female subjects who scored high and low on
the CONCOSS
Level of CONCOS
3
Proportion of High
Sex of subjects High
3
Low
3
CONCOS
Males 20 26 .43
Females 38 30 .55
Boxhead
Column head
12 0
The manipulation of information in a table or graph is not always
intended to mislead the reader. Abelson (1995) provides an example of
data manipulation or `reframing' (quite legitimately) that assists the articu-
lation of the results. Abelson cites a study by Beall (1994) that examines the
stereotype of women as more emotionally expressive than men. Abelson
notes that Beall presented male and female participants with a number of
vignettes. These vignettes depicted relatively simple social behaviours such
as touching someone's arm. Each vignette involved either a hypothetical
man or woman engaging in the behaviour. The behaviours were held
constant in these two versions. Each participant was asked to report the
intensity of the emotion using a seven-point scale. The data in Table 5.5
represent the mean intensity rating averaged over the vignette completed
by participants.
DATA! DATA! DATA!
0
20
40
60
80
100
Carrier A Carrier B
percentage
FIGURE 5.6 Preference for telecommunications carrier
44
45
46
47
48
49
50
51
52
53
Carrier A Carrier B
percentage
FIGURE 5.7 A different way to display preference for telecommunications carrier
121
The means in this table tell us that female participants attribute more
emotional intensity to the behaviours than do males, but females do not
attribute more emotional intensity when the characters are male. As
Abelson notes, trying to understand the interaction between gender of the
participant and gender of the character is not straightforward in terms of
the original labelling of the columns in Table 5.5. A simple rearranging or
reframing of the data will assist in aiding the interpretation of the inter-
action. Table 5.6 presents the reframed data. Note that the columns now
represent the gender of the character relative to the subject ± is the gender of
the character either the same as or opposite to the gender of the participant?
Now the interpretation is more straightforward: Females attribute more
emotional intensity to characters that are of the same gender and opposite
gender than do males, but both males and females attribute more emotional
intensity to characters of their own gender (Abelson, 1995: 116). Reframing
the data has not tampered with its integrity. It has simply aided the reader
in understanding the point that the author wishes to make. It's a matter of
looking at the clues from a different angle or perspective.
USING SPSS AND EXCEL TO PLOT DATA:
Accounting for Tastes dataset
We will use a real dataset to show how SPSS and Excel, statistical and
spreadsheet software, can be used to plot and describe data. The SPSS
dataset, tastes.sav, has been taken by the authors from Bennett, Emmison
and Frow's comprehensive 1995 survey on the everyday culture of
Australians. The innovative survey is reported in Accounting for Tastes:
BALNAVES AND CAPUTI
TABLE 5.5 Mean ratings of intensity of emotion
Gender of story character
Gender of subject Male Female
Male 4.52 4.20
Female 4.46 4.66
Column means 4.49 4.43
Source: Abelson,1995: 116
TABLE 5.6 Reframed data: mean ratings of intensity of emotion
Gender of story character
relative to participant
Gender of subject Male Female
Male 4.52 4.20
Female 4.66 4.46
Column means 4.59 4.33
Source: Abelson,1995
12 2
Australian Everyday Culture. Like our other case studies, it is an excellent
example of care taken in theory, the relationship between quantitative and
qualitative, operationalization and sampling.
Methodology and Operationalization
Bennett et al. (1999) wanted to find out about the relationship between
social class and culture. Do countries like Australia have a ruling class
that directly affects cultural choice (like going to the theatre, listening to
pop music)? Is there a `single powerful and universally binding scale of
cultural legitimacy which produces effects'? (1999: 269).
Accounting for Tastes is both a theoretical critique of Pierre Bourdieu's
ideas of social class and a presentation of their own ideas of `regimes of
value' (1999: 258±264). According to Bennett et al., regimes of value are
templates which structure cultural preferences. The templates might not
in all cases be explicitly set out: `but they are expressed and refined at
every level of cultural legislation, from literary and film criticism, to dis-
cussion at work about last night's television programs, to transient com-
ments about someone's good or bad taste in jewellery or in souped-up cars
or in colour schemes for the house' (1999: 259±260). Regimes of value can be
stable over time because they are grounded in administrative, economic,
technological, and legal infrastructures. `They are never simply expressive
of, and never simply reflect, a class structure, or the ethos of an age cohort
or a gender or a structure of sexual preference' (1999: 260).
To operationalize the Australian Everyday Cultures Project (AECP) class
model, Bennett and his colleagues collected information about their parti-
cipants' current occupation to determine their employment status as well as
managerial or supervisory status. `On these initial filters we superimposed
a measure of the occupation's skill level based on the groups of the
Australian Standard Classification of Occupations (ASCO) devised by
the Australian Bureau of Statistics' (1999: 18). The resulting `class model'
consisted of nine categories: Never employed, employers, self-employed,
managers, professionals, para-professionals, supervisors, sales and clerical
workers, and manual workers.
`Cultural tastes' were defined by everything that the AECP could
conceive as `culture': `including home-based leisure activities, fashion, the
ownership of cars and electronic equipment, eating habits, friendships,
holidays, outdoor activities, gambling, sport, reading, artistic pursuits,
watching television, cinema-going, and the use of libraries, museums and
art galleries' (1999: 2).
The sampling frame for the AECP survey was based on the August 1994
Australian Electoral Roll. `A total of 5000 non-institutionalized adults were
obtained by firstly stratifying by state and territory and then applying
systematic random sampling within these strata' (1999: 270). Of 5,000
questionnaires a total of 500 were returned undelivered; 450 were returned
DATA! DATA! DATA!
12 3
as refusals, with a total of 2,756 usable returns, making a response rate of
61.9 per cent. Table 5.7 shows the stratified sample and the official statistics.
Bennett et al. (1999) also conducted a major pilot in Brisbane and
associated areas before conducting the survey. This included extensive
qualitative focus groups in order to explore frame of reference. Data from
these groups are represented in the study, providing an ethnographic
component to the study. Bennett and his colleagues acknowledged the
limitations that definition of constructs may place on their findings:
The categories that organise our survey are constructs, artifices of method which
frames the questions in a certain way, chooses a particular form of the indepen-
dent variables, weights the data to conform to the national census figures, and
subjects them to complex statistical manipulations (each with its inbuilt assump-
tions) to produce the `findings' which then form the raw material for theoretical
interpretation. (1999: 15)
While Accounting for Tastes had theoretical reservations regarding quantita-
tive survey methods, it argued that these problems related mainly to how
the results of such methods are presented, rather than the unsuitability of
quantitative methods per se. `We said earlier that our interest in such
methods was prompted partly by a wish to subject cultural studies to a
disciplined form of engagement with ``the real''. The danger, though, is that
if interpreted in the light of the positivist assumptions which often accom-
pany them, the results of quantitative methodologies can often be mistaken
for reality itself' (1999: 15). Here we have echoes of both Hoftstede and
Lazarsfeld.
Working with SPSS
The dataset for Accounting for Tastes is available through the Australian
National University Social Sciences Data Archive (.
edu.au/). The description below, provided through the archive, provides
BALNAVES AND CAPUTI
TABLE 5.7 Accounting for tastes: comparison of stratified sample with official stastistics
1995 Everyday 1994 Australian Bureau of Statistics
Australian State/Territory Culture Survey estimates
Northern Territory (19) 0.7 1.0
Australian Capital Territory (51) 1.9 1.7
Tasmania (72) 2.6 2.6
Western Australia (246) 8.9 9.6
South Australia (253) 9.2 8.2
Queensland (529) 19.2 18.0
New South Wales (867) 31.5 33.9
Victoria (719) 26.1 25.0
N 2,756 100.0 100.0
12 4
an overview of the dataset and the study itself. Many scholars send their
datasets to data archives in order to provide other researchers with access to
the raw data. There is normally a small fee for ordering the dataset and
specific permissions required for using those datasets.
Social Science Data Archives
The Australian National University
Research Topic (Abstract)
The Australian Everyday Consumption project represents the first ever study of
Australians' cultural consumption. The study aims to delineate the cultural activ-
ities of Australians and their relationship to social class. The survey covers a broad
range of cultural pursuits, and variables include the books, newspapers and
magazines people read; the film and television programs they watch; the types
of cars they drive and possession of other consumer durables; their musical inter-
ests; the suburbs they live in; their homes and levels of home ownership; whether
they gamble; their hobbies; whether they play and/or watch sport; membership of
clubs; what they eat; their pets; how often they attend galleries, concerts and/or
the theatre; the clothes they wear; their families and friends; working conditions
and working hours; comparisons with spouse and parents; personal and house-
hold financial details; religious beliefs and practices; and their attitudes towards
societal classes, culture, politics and government, finance and the economy, trade
unions, gender and employment, and Aboriginal land rights. Background vari-
ables include respondents age, sex, marital status, level of education, country of
birth, work status, income and occupation.
Subject Terms
Accommodation; Arts; Assimilation (cultural); Attitudes; Broadcasting; Careers;
Clothing; Clubs; Community involvement; Diet; Education; Employment; Ethnic
groups; Family; Films; Food; Gambling; Human relations; Income; Leisure; Living
standards; Mass media; Motor cars; Music; Newspapers; Performing arts; Politics;
Radio; Radio programmes; Reading; Religion; Social classes; Social responsibility;
Sports; Television; Television programmes; Travel; Values; Working conditions;
Working hours.
Kind of Data
Survey
Time Dimensions
cross-sectional (one-time) study
Definition of Total Universe (Universe Sampled)
All non-institutionalised Australian adults, aged 18 years and over who were on
the July 1994 Commonwealth Electoral Roll.
Sampling Procedures
Stratified random sample
Number of Units (Cases)
number of units in original sample: 5,000
number of losses: 2,244
number of replacements: 0
number of cases (unweighted): 2,756
DATA! DATA! DATA!
12 5
Dates of Data Collection
first date of data collection: November 1994
last date of data collection: March 1995
Method of Data Collection
self-completion (mail out, mail back)
Dimensions of Dataset
number of cases: 2,756.
number of variables per case: 633
Accessibility
A copy of the User Undertaking Form must be signed before data may be
accessed.
The datafile tastes.sav is in SPSS format. SPSS is one of the most com-
monly used statistical packages in the social sciences. We will use Version
9.0 of SPSS to show how histograms, stem and leaf displays and boxplots
are obtained from SPSS. The Statistical Inquirer, multimedia courseware pro-
vided with this text, provides introductory lessons in descriptive statistics.
The courseware also provides brief, dynamic, exercises on the functions of
SPSS. The exercises use a real dataset from the doctoral work of Patrick
Rawstorne at the University of Wollongong. This dataset is available as an
SPSS file for practice in SPSS.
Once you have opened a data file in SPSS, such as the Accounting for
Tastes tastes.sav file that we are using here, the data editor in SPSS will
look like this.
BALNAVES AND CAPUTI
op
12 6
Let's consider the variable `housinc', annual household income. We may
be interested in exploring the distribution of annual household incomes. In
this chapter we have looked at histograms, stem and leaf displays and
boxplots as ways of representing data visually. There are a number of
ways of using SPSS to construct these plots. One way is to use the Explore
option. Select Descriptive Statistics from the Analyze menu. Choose the
Explore option from Descriptive Statistics.
Once you have selected Explore, the following dialog box will appear.
Select the variable you wish to analyse, in this case `housinc', and move it
to the Dependent List window by clicking on the uppermost arrow button.
Select the Plots display button located in the lower left-hand corner of the
dialog box.
The next step is to select the types of plots you wish to construct. This is
done by clicking on the Plots button located on the lower right-hand corner
of the window. [Note that you also have the option of comparing boxplots.
You could, for example, include a grouping variable in the Factor List win-
DATA! DATA! DATA!
r
12 7
dow. This would allow you to draw boxplots for each level of the grouping
variable, such as gender.] The following window should appear.
Ensure that the Histogram option is checked. The boxplot and stem and leaf
display options are default selections. Then click Continue and OK. This will
generate the output.
Here is the stem and leaf display output associated with the same data.
Frequency Stem & Leaf
106.00 0 . 00000000000013
106.00 0 . 555777777777777
190.00 1 . 000000000000333333333333333
174.00 1 . 6666666666666666999999999
162.00 2 . 11111111111133333333333
286.00 2 . 55555555555555999999999999999999999999999
.00 3 .
216.00 3 . 6666666666666666666666666666666
.00 4 .
265.00 4 . 55555555555555555555555555555555555555
.00 5 .
222.00 5 . 55555555555555555555555555555555
.00 6 .
192.00 6 . 555555555555555555555555555
.00 7 .
134.00 7 . 5555555555555555555
.00 8 .
62.00 8 . 555555555
.00 9 .
57.00 9 . 55555555
111.00 Extremes (>110000)
Stem width: 10000.00
Each leaf: 7 case(s)
BALNAVES AND CAPUTI
12 8
The boxplot output summarizes the distribution:
We can see from these displays that the data on household income are
slightly skewed. The histogram and stem and leaf representations are
asymmetrical; most of the values are between $10,000 and $45,000. From
the boxplot display we see that the whiskers are of different lengths and the
median is just slightly off-centre ± clues that the data may be skewed. The
boxplot display also indicates the presence of possible extreme values
(annual household incomes of $110,000).
Histograms and boxplots can also be constructed by selecting Histogram
or Boxplot from the Graphs menu.
DATA! DATA! DATA!
12 9
If you select the Boxplot option, the following dialog box appears.
Ensure that you have selected Summaries of separate variables by clicking on
it. Click on Define to obtain the next dialog box.
We will select the variable `housinc', labelled annual household income,
and move it to the Boxes Represent window by clicking on the arrow button.
Click on OK to generate the output.
If you select Histogram from the Graphs option you will see the following
dialog box.
BALNAVES AND CAPUTI
13 0
Select the variable from the variable list and move it to the Variable window
by clicking on the arrow button. Click on OK to generate the histogram.
Working with Excel
There are alternative software packages that enable you to create histo-
grams, stem and leaf displays and boxplots. Microsoft's Windows 97
version of Excel is not a statistical package. None the less, it provides a
number of very useful data manipulation and data analytic tools. Excel does
not provide a menu option that will allow you to construct stem and leaf
displays or boxplots. However, it is possible to write macros in Excel that
would allow you to construct these plots.
There are a number of ways to construct a histogram using Excel. One
way is to make use of the data analysis tools available in the Analysis
ToolPak. The data analysis procedures are available from the Tools menu.
The following example uses the `housinc' variable from the tastes.sav
data file.
From this menu you can select the Data Analysis option and access
the following dialog box. The Data Analysis dialog box lists a number of
statistical procedures, including the option for constructing a histogram.
DATA! DATA! DATA!
131
Select Histogram and click OK. You should now have the next dialog box.
In this box we include the cell range that includes the data we wish
to analyse. You select this range by simply clicking on the first cell
(not the cell containing the variable label) of the column containing the
data and then clicking on the last cell. Click OK. This procedure will
generate a frequency distribution on a separate Excel worksheet. You
can then use the chart wizard to construct a graph of this frequency
distribution.
DESCRIBING DATA
Numerical Summaries: What are they and why are they important?
We have looked at ways of graphically representing a set of numerical
values for a particular variable. We can use these techniques to compare
sets of values or distributions. However, there is a problem associated with
using some graphical techniques to compare distributions. The problem is
related to the fact that plots such as stem and leaf displays represent all the
data at an individual level. It is important to be able to summarize the main
features or properties of a distribution of scores. The experienced data
snooper responds to the request `Give me the facts' not by taking short
cuts but by summarizing the facts in a meaningful way and without sub-
stantial loss of information.
Most distributions have three important features, namely, the shape of
the distribution, the location or central tendency of the distribution and
the spread of scores in that distribution. For a particular distribution
it is possible to derive measures or indices for these distributional
characteristics.
BALNAVES AND CAPUTI
13 2
Describing Location or Centrality
Some Notation
To assist us in defining some indices of location and spread, it is useful to
use some mathematical notation. Any kind of mathematical notation is
enough to send some people into fits of panic. For those of you who are
`notation phobic', remember that mathematics is just another language that
we can learn ± admittedly a very specialized language, but parts of it are
easy to learn. The game is afoot!!
Assume we are measuring a variable ± the number of standard drinks
consumed by Australian men aged between 20 and 21. For illustrative
purposes let us also assume that we have data for five men. The
values are 3 5 2 4 4 respectively. We can use the letter X to represent the
variable of interest, in this case, number of standard drinks consumed by
Australian men aged between 20 and 21. In this example, the variable takes
on five values. Let the individual values be represented by x
1
, x
2
, x
3
, x
4
, and
x
5
respectively. The subscript identifies a particular individual. That is, x
1
represents the value for person 1 (the value 3), x
2
represents the value for
person 2 (the value 5), and so on. If we had n individuals then the nth value
for the variable X would be represented as x
n
, and the value for the ith
individual would be represented by x
i
:
In defining some numerical summaries we want to add up or sum values.
The operation of summing values is abbreviated or represented by Æ, the
Greek letter upper-case sigma. The operation of summing n values, x
1
,
x
2
,FFF,x
n
, that is x
1
x
2
FFF x
n
, can be represented as Æx
i
.
The most used and familiar measure of centrality is the arithmetic
mean or average. Computing the mean is quite simple. You simply
add up the values and divide by the number of values that you have.
If we have n values, x
1
,x
2
,FFF,x
n
, then the mean, M, is represented
algebraically as:
M x
1
x
2
FFF x
n
=n
Another important measure of centrality is the median. We introduced this
index when we discussed boxplots earlier. You will recall that the median is
defined as the point at or below which 50 per cent of the values fall. If we
were to rank-order our data from lowest to highest values, then the median
is the middle value in the rank order. Therefore, the median may be thought
of as the `typical' value in a set of data.
Assuming we have n values, we can use the formula n 1=2to
calculate the rank position of the median. If we have an odd number of
values, this formula will give an integer value for the rank position.
However, if we have an even number of values, the rank will not be integer.
In this case we define the median as the rank of the two middle values in
the distribution.
DATA! DATA! DATA!
13 3