Báo cáo nông nghiệp:" Ảnh hưởng của cấu trúc rừng ngập mặn đến quy luật giảm chiều cao sóng biển ở Việt Nam" pdf
Bạn đang xem bản rút gọn của tài liệu. Xem và tải ngay bản đầy đủ của tài liệu tại đây (1.26 MB, 8 trang )
J. Sci. Dev. 2011, 9 (Eng.Iss. 1): 55 - 62 HANOI UNIVERSITY OF AGRICULTURE
EFFECT OF MANGROVE FOREST STRUCTURES ON SEA WAVE ATTENUATION
IN VIETNAM
Ảnh hưởng của cấu trúc rừng ngập mặn đến quy luật giảm chiều cao sóng biển
ở Việt Nam
Tran Quang Bao
1
, Melinda J. Laituri
2
1
Vietnam Forestry University
2
Warner College of Natural Resources, Colorado State University, Fort Collins, CO 80523, USA
Corresponding author email:
Received date: 15.03.2011 Accepted date: 03.04.2011
TÓM TẮT
Bài báo phân tích quy luật giảm chiều cao sóng ở rừng ngập mặn ven biển Việt Nam. Số liệu
nghiên cứu được thu thập từ 32 ô tiêu chuẩn trên hai vùng sinh thái khác nhau. Trên mỗi ô tiêu
chuẩn, tiến hành đo đếm cấu trúc rừng ngập mặn và chiều cao sóng biển khi đi sâu vào các đai rừng
ngập mặn ở các khoảng cách khác nhau. Kết quả nghiên cứu cho thấy, chiều cao sóng biển có liên hệ
chặt với khoảng cách đi sâu vào đai rừng theo dạng phương trình hàm mũ (P val. <0,00; R
2
>0,95).
Quy luật giảm chiều cao sóng biển phụ thuộc vào các biến: chiều cao sóng ban đầu, khoảng cách đi
sâu đai rừng và cấu trúc rừng ngập mặn. Phương trình liên hệ này đã được sử dụng để xác định bề
rộng đai rừng ngập mặn tối thiểu cho phòng hộ ven biển Việt Nam.
Từ khoá: Cấu trúc rừng, đai rừng ngập mặn, giảm sóng biển, rừng ngập mặn.
SUMMARY
This paper analyzes wave attenuation in coastal mangrove forests in Vietnam. Data from 32
mangrove plots of six species located in 2 coastal regions are used for this study. In each plot,
mangrove forest structures and wave height at different cross-shore distances are measured. Wave
height closely relates to cross-shore distances. Ninety one exponential regression equations are
highly significant with R
2
> 0.95 and P <0.001. Wave height reduction depends on initial wave height,
cross-shore distances, and mangrove forest structures. This relationship is used to define minimum
mangrove band width for coastal protection from waves in Vietnam.
Key words: Forest structures, mangrove forest, mangrove band width, wave attenuation.
1. INTRODUCTION
Mangrove forests span the interface between
marine and terrestrial environments, growing in the
mouths of rivers, in tidal swamps, and along
coastlines where they are regularly inundated by
salty or brackish water (Sterling et al., 2006).
Mangrove forests play a vital role in coastline
protection, mitigation of wave and storm impacts
and mudflats stabilization, and protection of near
shore water quality. They also provide critical
habitat for fish and wildlife. Many species new to
sciences have recently been documented in
mangrove forest areas in Vietnam (Thompson et
al., 2009). The trunks and roots above the ground of
mangrove forests have a considerable influence on
the hydrodynamics and sediment transport within
forests (Quartel et al., 2007). In 2002, Vietnam had
approximately 155,290 ha of mangrove forests.
More than 200,000 ha of mangrove forests have
been destroyed over the last two decades by
conversion to agriculture and aquaculture (e.g.,
shrimp farming) as well as by development for
recreation (VNEA, 2005). Mangrove forests are
55
Effect of mangrove forest structures on sea wave attenuation in Vietnam
thought to play an important role in flood defense
by dissipating incoming wave energy and reducing
the erosion rates (Hong et al., 1993; Wu et al.,
2000). However, the physical processes of wave
attenuation in mangroves have been not widely
studied, especially in Vietnam, because of
difficulties in analyzing the flow field in the
vegetation field and the lack of comprehensive data
(Kobayashi et al., 1993).
Coastal mangrove forests can mitigate high
waves, even tsunamis. By observing causalities of
the tsunami of December 26, 2004, Kathiresan et
al., (2005) highlighted the effectiveness of
mangrove forest in reducing the impact of waves.
Human death and loss of wealth decreased with
areas of dense mangrove forests. A review by
Alongi (2008) concluded that significant reduction
in tsunami wave flow pressure when mangrove
forest was 100 m in width. The energy of wave
height and wave spectrum is dissipated within
mangrove forest even at small distance (Luong et
al., 2008). The magnitude of energy absorption
strongly depends on mangrove structures (e.g.,
density, stem and root diameter, shore slope) and
spectral characteristics of incident waves (Massel et
al., 1999; Alongi, 2008). The dissipation of wave
energy inside mangrove forests is mostly caused by
wave-trunk interactions and wave breaking (Luong
et al., 2006).
Mazda et al. (1997a) on their study in the Red
River Delta, Vietnam showed that the wave
reduction due to drag force on the trees was
significant on high density, six-year-old mangrove
forests. Hydrodynamics in mangrove swamps
changes in a wide range with their species, density
and tidal condition (Mazda et al., 1997b). High tree
density and above ground roots of mangrove forest
cause a much higher drag force of incoming waves
than the bare sandy surface of the mudflat does.
The wave drag force can be expressed in an
exponential function (Quartel et al., 2007).
The general objective of this paper is to
analyze the relationship between wave height and
mangrove forest structures, and then to define
minimum mangrove forest band width for coastal
protection from waves for coastline of Vietnam.
2. MATERIALS AND METHODS
2.1. Study Sites
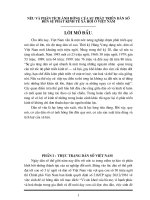
The study was conducted in two coastal
mangrove forests of Vietnam. The northern study
site is located in the Red River delta, that is the
second largest delta in Vietnam and flows into the
Bay of Tonkin (Fig. 1). The tides in the Bay of
Tonkin are diurnal with a range of 2.6 - 3.2 m.
Active intertidal mudflats, mangrove swamps and
supratidal marshes in estuaries and along open
coastlines characterize the coastal areas (Mather et
al., 1999; Quartel et al., 2007). Mangrove in the
Red river delta is one of the main remaining large
tracts of mangrove forest in Vietnam, which are
important sites for breeding/stop-over along the
East-Asian or the Australia flyways. In this
northern region, four mangrove locations were
selected for the research, including Tien Lang and
Cat ba of Hai Phong; Hoang Tan of Quang Ninh;
and Tien Hai of Thai Binh. In each of location, four
mangrove forest plots were set up to measure
mangrove structure and wave height at different
cross-shore distances.
The southern study site was Can Gio
mangrove forest. It is the first Biosphere Reserve in
Vietnam located 40 km southeast of Ho Chi Minh
City
and has a total of 75,740 ha (Fig. 1). Can Gio
lies in a recently formed, soft, silty delta with an
irregular, semi-diurnal tidal regime (Luong et al.,
2006). The major habitat types in Can Gio are
plantation mangrove, of which there is about
20,000 ha, and naturally regenerating mangrove.
The site is an important
wildlife sanctuary in
Vietnam
as it is characterized by a wetland
biosystem dominated by mangrove
. The intertidal
mudflats and sandbanks at Can Gio are an
important habitat for migratory shorebirds.
Eighteen mangrove forest plots were set up in Can
Gio to collect data of mangrove structures and
wave height. These plots are selected representative
for differences in mangrove structure in the region
(e.g., age, species, height, tree density).
2.2. Data Collection
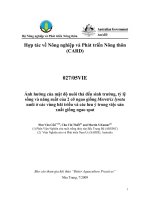
A total 32 mangrove forest plots were set up in
five locations of two regions along coastal Vietnam.
In each plot of 400 m
2
(20 m x 20 m), about 2-5
routes are designed to measure wave height at
different cross-shore distances (i.e., 0 m, 20 m, 40 m,
60 m, 100 m, and 120 m) from the edge to the center
of the mangrove stand (Fig. 2). The numbers of
measurable replications in each route were from 2 to
10. Mangrove forest structures, such as breast-height
diameter, height, tree density, canopy closure and
species were collected in each plot. Wave
attenuation was analyzed in relation to distances,
initial wave height and mangrove forest structures.
56
Tran Quang Bao, Melinda J. Laituri
-
06012018024030
Kilometers
Legend
Research Area
Vietnam
Tonkin Bay
(b)
(a)
Figure 1. Map of Vietnam showing the location of study areas
(a) Sonneratia caseolaris forest in Hai Phong, and (b) Rhizophora mucronata forest in Ho Chi Minh City.
Figure 2. A diagram designed to measure wave height on a cross shore transect
57
Effect of mangrove forest structures on sea wave attenuation in Vietnam
3. RESULTS AND DISCUSSION
3.1. Effect of Mangrove Structures on Wave
Height
The structures of 32 mangrove forest plots in
five coastal research areas are relatively simple.
There are only six dominant species (i.e.,
Rhizophora mucronata; Sonneratia caseolaris;
Sonneratia griffithii; Aegiceras corniculatum;
Avicennia marina; Kandelia candel) with high tree
density (2000 ÷ 13000 trees ha
-1
) and canopy
closure averaging above 80%. Diameter and height
ranges from 7.5 to 12 (cm) and 1.6 to 11.3 (m),
respectively. Generally, DBH and height of
mangrove forests increases toward the south. It may
be explained by the differences in resources supply
(i.e., more mudflats, and warmer climate in the
south). Average wave height observed in all plots
ranges from 20 to 70 (cm).
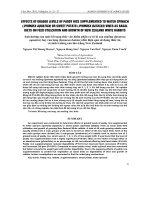
From the data on wave height (cm) measured
at different distances (m) from the edge to the
center of the mangrove stand, we applied regression
models to inspect the relationship between wave
height and cross-shore distances to the forest. The
results show that wave height decays exponentially
and is significantly related to distances. All 92
exponential regression equations of five research
areas with different mangrove forest species are
highly significant with P values of <0.001 and R
2
>
0.95. The exponential reduction of wave height
in mangroves can be explained by dense network of
trucks, branches and above ground roots of the
mangrove trees increasing bed roughness and
causing more friction and dissipating more wave
energy (Quartel et al., 2007).
The effect of mangrove forest band width on
wave height can be generalized in an exponential
equation (1)
w
Bb
h
eaW
*
*=
(1)
Where:
W
h
is the sea wave height behind forest
band (cm)
B
B
w
is the forest band width (m)
a is intercept in log base e of equation (1)
b is slope coefficient in log base e of
equation (1)
To establish a general equation for all
measurements in five locations, from the data listed
in 92 regression coefficients of equation (1) we
analyze the relation of these coefficients (i.e.,
intercept and slope) with different independent
variables. We have found interesting results of
relationship of regression coefficients to initial
wave height and mangrove forest structures:
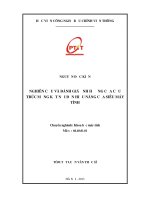
1) Intercept coefficient (a) is highly correlated
to initial wave height (i.e., wave height at the edge of
mangrove forest, distance= 0), R
2
=0.989, P <0.0001.
It is a linear equation, in which a coefficient is
directly proportional to initial wave height.
0
10
20
30
40
50
60
0 20 40 60 80 100 120
Forest Band Width (m)
Sea Wave Height (cm)
Cat ba
Hoang Tan
Can gio
Tien lang
Wh = 24.941e
-0.01*Bw
R
2
= 0.993
Wh = 14.289e
-0.0067*Bw
R
2
= 0.972
Wh = 54.801e
-0.0168*Bw
R
2
= 0.998
Wh = 27.154
e-0.0055*Bw
R
2
= 0.981
Figure 3. The reduction of wave height by cross shore distances. Examples from measured data of
route 1 and the first replication of plots in Cat Ba, Hoang Tan, Can Gio, Tien Lang, respectively
58
Tran Quang Bao, Melinda J. Laituri
0
10
20
30
40
50
60
70
80
90
0 20 40 60 80 100
a coefficient
Initial Sea Wave Height (cm)
Figure 4. Bivariate plots of coefficient a in equation (1) and initial wave height (cm)
R
2
= 0.93; RSME = 2.54cm
0
10
20
30
40
50
60
0 102030405
Prediction (cm)
Measurement (cm)
0
R
2
= 0.81; RSME = 3.93cm
0
5
10
15
20
25
30
35
40
45
50
0 102030405
Prediction (cm)
Measurement (cm)
0
(a) (b)
Figure 5. Bivariate plots of predictive and actual values of wave height (cm) at
two distances from the edge to the center of forest
(a) distance = 40m; (b) distance = 80m
a = 0.9899*I
wh
+ 0.3526 (2)
Where: a is the coefficient in the exponential
equation (1)
I
wh
is the initial sea wave height (cm)
2) Slope coefficient (b) is in regression with
mangrove forest structures, about 71% of total
variations of b coefficient is associated with height,
density, and canopy closure (R
2
= 0.713, P<0.0001).
These independent variables are inversely related to
the exponential coefficient of equation (1).
b = 0.048 - 0.0016 * H - 0.00178 * Ln(N) -
0.0077 * Ln(CC) (3)
Where: b is the exponential coefficient in the
equation (1)
H is th average tree height (m)
N is the tree density (tree ha
-1
)
CC is the canopy closure (%)
By plugging two equations (2) and (3) into the
equation (1), we have an integrated equation (4)
demonstrating the relationship of wave height
reduction to initial wave height and mangrove
forest structure.
(
)
hwh
W 0.9899*I 0.3526 *=+
(
)
0.048-0.0016*H -0.00178*Ln(N)-0.0077*Ln(CC) *Bw
*e
(4)
To validate the accuracy of the model (4), the
predicted values are compared with actual data.
Fig. 5 (a, b) shows a high correlation between
predicted wave height and observed wave height at
two cross-shore distances of 40m and 80m
(R
2
>0.8). The root squared mean errors (RSME) of
the predictions are 2.54cm and 3.93cm,
respectively.
59
Effect of mangrove forest structures on sea wave attenuation in Vietnam
3.2. Minimum Mangrove Band Width for Coastal
Protection from Waves
The integrated equation (4) is the prediction of
wave height from cross-shore distance (i.e.,
mangrove band width), mangrove structures, and
initial wave height. Mangrove band width is
identified by equation (5) derived from equation
(4). In the equation (5), for a given predicted wave
height (i.e., safe wave height) and initial wave
height, the mangrove band width depends on the
mangrove forest structures.
b
aW
B
h
w
)ln()ln(
−
=
Where: B
w
is forest band width (m)
W
h
is safe wave height behind forest
band (cm)
a is a function of initial wave height
(equation 2)
b is a function of forest structure
(equation 3)
To identify average initial wave height for
equation (5), we have collected maximum wave
height at different typical regions along coastline of
Vietnam (Table 1). In two years from 2004 to 2005,
the maximum wave height approximately ranged
from 1.25m to 5.0m. In reality, wave height depends
on the characteristics of storm events. Wave height
is caused by strong wind and heavy rain, whereas in
normal weather wave height is usually low in
Vietnam. We selected a threshold of 3m of maximum
wave height to calculated minimum mangrove band
width for coastal protection.
Safe wave height behind forest band in
equation (5) is 30cm, it is the averagedg value of
wave height by interviewing 50 people (e.g.,
farmers, peasants, managers) working in
aquaculture and agriculture in research areas.
By plugging the values of initial wave height
(300cm), and safe wave height (30cm) into
equation (5), as a result, the required mangrove
band width (B
B
w
) is only a function of forest
structure index depending on height, density, and
canopy closure (equation 3).
(5)
Let V = - b
= [- 0.048 + 0.0016 *H + 0.00178*ln(N)
+ 0.0077*ln(CC)] (6)
Where V is an index of mangrove forest
structure. A theoretical line of minimum forest
band width in relation to vegetation index is
demonstrated in Fig. 6.
The index of mangrove structure is classified
into 5 levels of wave prevention based on its
relation to wave height (Fig. 6; Table 2). Required
mangrove band width decays exponentially by
vegetation index (V). When mangrove forest is tall,
dense, and has high canopy closure (i.e., high V
index), a narrower forest band is required. In
contrast, when mangrove forest is short, low tree
density and of low canopy closure (i.e., low V
index), a wider mangrove band is required.
Table 1. Maximum Sea Wave Height in coastal Vietnam
Maximum sea wave height (m)
Regions
6
h
30 12
h
30 17
h
00
Hai Phong 2.97 3.69 3.60
Quang Ninh 1.25 1.25 1.50
Vung Tau 1.25 125 1.50
Thanh Hoa 0.75 1.35 1.50
Da Nang 3.50 5.00 3.50
* Sources: Department of Hydrometeorology, observed from Jan 01, 2004 to Dec. 31, 2005
0
100
200
300
400
500
600
700
0.000 0.005 0.010 0.015 0.020 0.025 0.030 0.035 0.040
Forest Structure Index (V)
Requi red Forest Band Width (m)
Required Forest Band Width (m)
I
II
III
IV
V
Figure 6. Theoretical curve showing relationship between mangrove structure index (V)
and mangrove band width (m)
60
Tran Quang Bao, Melinda J. Laituri
Table 2. Classification of mangrove forests for preventing sea waves
Levels V index Required Band Width (m) Name of levels
I ention < 0.005 > 240 very weak prev
II 0.005 – 0.010 weak pre
0.010 – 0.015
120 - 240
80 - 120
vention
III
IV
moderate prevention
strong prevention
0.015 – 0.028 40 - 80
V > 0.0280 < 40 very strong prevention
* Maximum wa cm
res and Corresponding Level of Wave Prevention
No. Locations
ve height is assumed 300
Table 3. Index of Mangrove Structu
Dominant Species V index Level
1 Cat Ba
Aegiceras corniculatum
0.00484 I
Avicennia marin
H
5 Tien Lang
a
0.01408 III
Rhizophora mucronata
aris
0.01631 IV 2 Can Gio
Sonneratia caseol
0.01374 III
Sonneratia caseolaris
Avicennia marina
0.00587
0.00474
II
I
3 oang Tan
Aegiceras corniculatum
0.00318 I
Kandelia candel
0.00749 II
4 Thai Binh
Aegiceras corniculatum
laris
0.00242 I
Sonneratia caseo
0.00504 II
* V: inde ve st
n 0.005, in this
level wh e minimum
man
the m
V index in this level
of m
4. CONCLUSIONS
Mangrove forests are very important
ents. They have a
ng shorelines, minimizing
wave
2
x of mangro ructure
- Level 1: V index is less tha
en V index is increasing. Th
grove band width is decreasing quickly from
600m to 240m.
- Level 2: V index is ranging from 0.005 to
0.015. In this level the increasing of V index causes
inimum band width fairly quickly decreasing
from 240m to 120m.
- Level 3: V index is ranging from 0.010 to
0.015. In this level, the increasing of V index
resul
ts in a gradually decreasing of minimum band
width from 120m to 80m.
- Level 4: V index is ranging from 0.015 –
0.028. The increasing of
resul
ts in a slowly decreasing of minimum band
width from 40m to 80m.
- Level 5: V index is greater than 0.028. The
increasing of V index causes a minimal decreasing
inimum band width always less than 40m.
Applying the threshold of V index in Table 3,
we have identified the levels of wave prevention for
32 m
angrove forest plots. The results show that the
levels of wave prevention of southern plots about
3÷4 are higher than those of northern plots about
1÷2. This indicates that the southern mangrove
forest can protect coastline better than the northern
mangrove forest does (Table 3).
ecosystems located in the upper intertidal zones of
the tropics. They are the primary source of energy
and nutrients in these environm
special role in stabilizi
damage, and trapping sediments. However, in
recent decades mangrove forests in Vietnam are
threatened by conversion to agriculture and
aquaculture. The primary objectives of this study
were to define minimum mangrove band width for
coastal protection from waves in Vietnam.
We have set up 32 plots in 2 coastal regions of
Vietnam to measure wave attenuation from the
edge to the center of forest (distances). The results
show that wave height closely relates to cross-shore
distances in an exponential equation. All single
equa
tions are highly significant with P <0.001 and
R >0.95.
We have established an integrated exponential
equation applied for all cases, in which a
coefficient (i.e., intercept in log transformation of
exponential equation) is a function of initial wave
height, and b coefficient (i.e., slope in log
transforma
tion of exponential equation) is a
function of canopy closure, height, and density. The
integrated equation was used to define appropriated
61
Effect of mangrove forest structures on sea wave attenuation in Vietnam
mangrove band width. With the assumption that the
average maximum wave height is 300cm and safe
wave height behind forest band is 30cm, required
mangrove forest band width in associated with its
structures was defined.
Mangrove structure index (V) is classified into
5 levels of protection waves. The southern
mangrove forests of Vietnam protect waves better
than the northern mangrove forests do (i.e., higher
V index).
REFERENCES
Alongi, D. M. (2008). Mangrove forests:
Resilience, protection from tsunamis, and
respons
es to global climate change. Estuarine
Coastal and Shelf Science. 76, 1-13.
Hong, P.N., and Mangroves of
Ka
Lu
Lu
earch. 24, 219-249.
St
-21 and pp. 91-92.
ong.
Vi
s of Ramsar Convention
W
ts. Environmental Modelling
H.T. San (1993).
Vietnam. IUCN, Wetland Programme, Bangkok,
Thailand, 158pp.
thiresan, K., and N.Rajendran (2005). Coastal
mangrove forests mitigated tsunami. Estuarine
Coastal and Shelf Science. 65, 601-60
6.
Kobayashi, N., A. W. Raichle, and T. Asano,
(1993). Wave Attenuation by Vegetation.
Journal of Waterw
ay, Port, Coastal, and Ocean
Engineering. 119 (1), 30-48.
ong, V. H. P., and S. R. Massel (2008). Energy
disspation in non-uniform mangrove fo
rests of
arbitrary depth. Journal of Marine Systems. 74,
603-622.
ong, V. H. P., and S. R. Massel (2006).
Experiments on wave moti
on and suspended
sediment concentration at Nang Hai, Can Gio
mangrove forest, Southern Vietnam.
Oceanlogia, 48 (1), 23-40.
assel, S. R
M ., K. Furukawa, and R.M. Brinkman
(1999). Surface wave propagation in mangrove
forests. Fluid Dynamics Res
Mathers, S., and J. Zalasiewicz (1999). Holosence
sedimentary architechture of the Red River
Delta, Vietnam. Journal of Coastal Research, 15
(2), 314-325.
Mazda, Y., M. Magi, M. Kogo, and P.N. Hong
(1997). Mangroves as a Coastal Protection from
Waves in the Tong King Delta, Vietnam.
Mangroves and Salt Marshes, 1, 127-135.
Mazda, Y., E. Wolanski, B. King, A. Sase, D.
Ohtsuka, and M. Magi (1997). Drag Force due to
Vegetation in Mangrove Swamps. Mangroves
and Salt Marshes, 1, 193-199.
Quartel, S., A. Kroon, P.G.E.F. Augustinus, P. Van
Santen, and N.H.Tri (2007). Wave Attenuation
in Coastal Mangroves in the Red River Delta,
Vietnam. Journal of Asian Earth Sciences. 29,
576-584.
erling, J. E., M.M. Hurley, and D.L.Minh (2006).
Vietnam: A Natural History, Yale University
Press, pp. 1
Theobald, D.M. (2003). GIS Concepts and ArcGIS
Methods. 1st Edition, Conservation and Planning
Technologies Publisher, USA. pp. 238-266.
Thompson, C., and T. Thompson (2008). First
Contact in the Greater Mekong: new species
discoveries.
www.panda.org/greatermek
Cited 10/10/2009.
etnam Environment Protection Agency - VEPA
(2005). Overview of Wetlands Status in Vietnam
Following 15 Year
Implementation.
u, Y., R.A. Falconer, and J. Struve (2001).
Mathematical Modelling of Tidal Currents in
Mangrove Fores
Software. 16, 19-29.
62