Ubuntu Linux Toolbox 1000+ Commands for Ubuntu and Debian Power Users phần 7 pdf
Bạn đang xem bản rút gọn của tài liệu. Xem và tải ngay bản đầy đủ của tài liệu tại đây (366.78 KB, 35 trang )
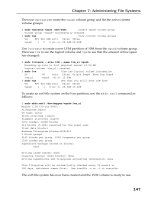
Table 9-2: Standard Signals to Send to Processes
The kill command can send signals to processes by process ID or job number while the
killall command can signal processes by command name. Here are some examples:
$ kill 28665 Send SIGTERM to process with PID 28665
$ kill -9 4895 Send SIGKILL to process with PID 4895
$ kill -SIGCONT 5254 Continue a stopped process (pid 5254)
$ kill %3 Kill the process represented by job %3
$ killall spamd Kill all spamd daemons currently running
$ killall -SIGHUP sendmail Have sendmail processes reread config files
Signal Number Signal Name Description
1
SIGHUP
Hang up from terminal or controlling process died
2
SIGINT
Keyboard interrupt
3
SIGQUIT
Keyboard quit
4
SIGILL
Illegal instruction
6
SIGABRT
Abort sent from abort function
8
SIGFPE
Floating point exception
9
SIGKILL
Kill signal
11
SIGSEGV
Invalid memory reference
13
SIGPIPE
Pipe broken (no process reading from pipe)
14
SIGALRM
Timer signal from alarm system call
15
SIGTERM
Termination signal
30,10,16
SIGUSR1
User-defined signal 1
31,12,17
SIGUSR2
User-defined signal 2
20,17,18
SIGCHLD
Child terminated or stopped
19,18,25
SIGCONT
Continue if process is stopped
17,19,23
SIGSTOP
Stop the process
18,20.24
SIGTSTP
Stop typed at terminal
21,21,26
SIGTTIN
Terminal input for background process
22,22,27
SIGTTOU
Terminal output for background process
182
Chapter 9: Checking and Managing Running Processes
82935c09.qxd:Toolbox 10/29/07 1:09 PM Page 182
The SIGKILL (9) signal, used generously by trigger-happy novice administrators,
should be reserved as a last resort. It does not allow the targeted process to exit cleanly
but forces it to end abruptly. This can potentially result in loss or corruption of data
handled by that process. The
SIGHUP signal was originally used on Unix systems to
indicate that a terminal was being disconnected from a mainframe (such as from a
hang-up of a dial-in modem). However, daemon processes, such as
sendmail and
httpd, were implemented to catch SIGHUP signals as an indication that those processes
should reread configuration files.
Running Processes Away from the Current Shell
If you want a process to continue to run, even if you disconnect from the current shell
session, there are several ways to go about doing that. You can use the
nohup command
to run a process in a way that it is impervious to a hang-up signal:
$ nohup updatedb & Run updatedb with no ability to interrupt
# nohup nice -9 gcc hello.c & Run gcc uninterrupted and higher priority
Using nohup is different than running the command with an ampersand alone because
with
nohup the command will keep running, even if you exit the shell that launched
the command.
The
nohup command was commonly used in the days of slow processors and dial-up
connections (so you didn’t have to stay logged in to an expensive connection while
a long compile completed). Also, today using tools such as
screen (described in
Chapter 14) you can keep a shell session active, even after you disconnect your net-
work connection to that shell.
Scheduling Processes to Run
Commands associated with the cron facility can be used to set a command to run at
a specific time (including now) so that it is not connected to the current shell. The
at
command runs a command at the time you set:
$ at now +1 min Start command running in one minute
at> updatedb
at> <Ctrl+d> <EOT>
job 5 at Mon Aug 20 20:37:00 2007
$ at teatime Start command at 4pm today
$ at now +5 days Start a command in five days
$ at 06/25/08 Start a command at current time on June 25, 2008
Another way to run a command that’s not connected with the current shell is with the
batch command. With batch, you can set a command to start as soon as the processor is ready
(load average below .8):
$ batch Start command running immediately
at> find /mnt/isos | grep jpg$ > /tmp/mypics
at> <Ctrl+d> <EOT>
183
Chapter 9: Checking and Managing Running Processes
82935c09.qxd:Toolbox 10/29/07 1:09 PM Page 183
Note that after the at or batch commands you see a secondary at> prompt. Type the
command you want to run at that prompt and press Enter. After that, you can continue
to enter commands. When you are done, press Ctrl+d on a line by itself to queue the
commands you entered to run.
After the commands are entered, you can check the queue of at jobs that are set to run by
typing the
atq command:
$ atq
11 Wed Sep 5 21:10:00 2007 a francois
10 Fri Aug 24 21:10:00 2007 a francois
8 Thu Aug 23 20:53:00 2007 a francois
Regular users can only see their own at jobs that are queued. The root user can see
everyone’s queued
at jobs. If you want to delete an at job from the queue, use the atrm
command:
$ atrm 11 Delete at job number 11
The at and batch commands are for queuing up a command to run as a one-shot
deal. You can use the cron facility to set up commands to run repeatedly. These commands
are scripted into cron jobs which are scheduled in crontab files. There is one system
crontab file (
/etc/crontab). Also, each user can create a personal crontab file that
can launch commands at times that the user chooses. To create a personal crontab file,
type the following.
$ crontab -e Create a personal crontab file
The crontab -e command opens your crontab file (or creates a new one) using the
vi text editor. Here are examples of several entries you could add to a crontab file:
15 8 * * Mon,Tue,Wed,Thu,Fri mail chris < /var/project/stats.txt
* * 1 1,4,7,10 * find / | grep .doc$ > /var/sales/documents.txt
The first crontab example shown sends a mail message to the user named chris by
directing the contents of
/var/project/stats.txt into that message. That mail com-
mand is run Monday through Friday at 8:15 a.m. In the second example, on the first day
of January, April, July, and October, the
find command runs to look for every .doc file
on the system and sends the resulting list of files to
/var/sales/documents.txt.
The last part of each crontab entry is the command that is run. The first five fields rep-
resent the time and date the command is run. The fields from left to right are: minute
(0 to 59), hour (0 to 23), day of the month (0 to 31), month (0 to 12 or Jan, Feb, Mar, Apr,
May, Jun, Jul, Aug, Sep, Oct, Nov, or Dec), and day of the week (0 to 7 or Sun, Mon, Tue,
Wed, Thu, Fri, or Sat). An asterisk (*) in a field means to match any value for that field.
184
Chapter 9: Checking and Managing Running Processes
82935c09.qxd:Toolbox 10/29/07 1:09 PM Page 184
Here are some other options with the crontab command:
# crontab -eu chris Edit another user’s crontab (root only)
$ crontab -l List contents of your crontab file
15 8 * * Mon,Tue,Wed,Thu,Fri mail chris < /var/project/stats.txt
* * 1 1,4,7,10 * find / | grep .doc$ > /var/sales/documents.txt
$ crontab -r Delete your crontab file
The traditional way to configure system cron jobs was to add them to the system
crontab. Although this is still an option, Ubuntu provides an easier way to create
hourly, daily, weekly, and monthly cron jobs, by associating the command you want to run
with a cron directory. Simply create a script that you want to run. Then copy the script
to the
/etc/cron.hourly, /etc/cron.daily, /etc/cron.weekly, or /etc/cron
.monthly
directory. The command will then run in the time frame indicated by the
directory (hourly, daily, weekly, or monthly).
An alternative to the cron facility is the anacron facility. With anacron, as with cron,
you can configure commands to run periodically. However, anacron is most appro-
priate for machines that are not on all the time. If a command is not run because the
computer was off during the scheduled time, the next time the computer is on, the
anacron facility makes sure that the commands that were missed during the down-
time are run after the system resumes.
Summary
Watching and working with the processes that run on your Linux system are impor-
tant activities to make sure that your system is operating efficiently. Using commands
such as
ps and top, you can view the processes running on your system. You can also
use
pgrep to search for and list particular processes.
With commands such as
nice and renice, you can adjust the recommended priorities
at which selected processes run. When a process is running, you can change how it is
running or kill the process by sending it a signal from the
kill or killall command.
After launching a command from the current shell, you can set that command’s process
to run in the background (
bg) or foreground (fg). You can also stop and restart the
process using different control codes.
To schedule a command to run at a later time, you can use the
at or batch com-
mand. To set up a command to run repeatedly at set intervals, you can use the
cron or anacron facilities.
185
Chapter 9: Checking and Managing Running Processes
82935c09.qxd:Toolbox 10/29/07 1:09 PM Page 185
82935c09.qxd:Toolbox 10/29/07 1:09 PM Page 186
Managing the System
Without careful management, the demands on
your Linux system can sometimes exceed the
resources you have available. Being able to moni-
tor your system’s activities (memory, CPU, and
device usage) over time can help you make sure
that your machine has enough resources to do
what you need it to. Likewise, managing other
aspects of your system, such as the device drivers
it uses and how the boot process works, can help
avoid performance problems and system failures.
This chapter is divided into several sections that
relate to ways of managing your Ubuntu or other
Linux system. The first section can help you mon-
itor the resources (processing power, devices, and
memory) on your Linux system. The next section
describes how to check and set your system clock.
Descriptions of the boot process and subsequent
run levels follow. The last sections describe how
to work with the kernel and related device driv-
ers, as well as how to view information about
your computer’s hardware components.
Monitoring Resources
Ubuntu, Debian, and other Linux systems do a
wonderful job of keeping track of what they do.
If you care to look, you can find lots of informa-
tion about how your CPU, hard disks, virtual
memory, and other computer resources are
being used.
You can go to where the Linux kernel stores real-
time information about your system by directly
viewing the contents of files in the
/proc file sys-
tem (see Appendix C). An alternative, however, is
to use commands to view information about how
IN THIS CHAPTER
Checking memory use
with free, top, vmstat,
and slabtop
Viewing CPU use with
iostat, dstat, and top
Monitoring storage
devices with iostat,
vmstat, and lsof
Working with dates/
time using date,
hwclock, cal, and NTP
Changing GRUB boot
loader behavior
Rebuilding the initial
ramdisk
Dealing with run levels
with runlevel and init
Adding, removing, and
listing services with
chkconfig and service
Shutting down the
system with reboot,
halt, and shutdown
Checking and chang-
ing kernel driver
settings with lsmod,
modinfo, and modprobe
Watching hardware
settings with lspci,
dmidecode, and
hdparm
82935c10.qxd:Toolbox 10/29/07 1:35 PM Page 187
your computer’s virtual memory, processor, storage devices, and network interfaces
are being used on your system.
There are commands that can monitor several different aspects of your system’s
resources. Because this book is not just a man page, however, we have divided the
following sections by topic (monitoring memory, CPU, and storage devices) rather
than by the commands that do them (
top, vmstat, and iostat).
NOTE Some of the applications described in this section are installed by default in
Ubuntu, in packages such as the procps package. To use
iostat or sar, however,
you need to install the sysstat package. Install the sysstat package with the follow-
ing command:
$ sudo apt-get install sysstat
Monitoring Memory Use
Few things will kill system performance faster than running out of memory. Commands
such as
free and top let you see basic information about how your RAM and swap are
being used. The
vmstat command gives detailed information about memory use and
can run continuously. The
slabtop command can show how much memory the kernel
(slab cache) is consuming.
The
free command provides the quickest way to see how much memory is being used on
your system. It shows the total amount of RAM (
Mem:) and swap space (Swap:), along
with the amount currently being used. Here are examples of the
free command:
$ free List memory usage in kilobytes (-k default)
total used free shared buffers cached
Mem: 742476 725108 17368 0 153388 342544
-/+ buffers/cache: 229176 513300
Swap: 1020116 72 1020044
$ free -m List memory usage in megabytes
total used free shared buffers cached
Mem: 725 706 18 0 148 333
-/+ buffers/cache: 223 501
Swap: 996 0 996
$ free -b List memory usage in blocks
total used free shared buffers cached
Mem: 760295424 742510592 17784832 0 157114368 350765056
-/+ buffers/cache: 234631168 525664256
Swap: 1044598784 73728 1044525056
$ free -mt List memory usage with totals displayed (Swap + Mem)
total used free shared buffers cached
Mem: 725 708 16 0 149 334
-/+ buffers/cache: 223 501
Swap: 996 0 996
Total: 1721 708 1013
$ free -g List memory usage in gigabytes
$ free -s 5 Continuously display memory usage every 5 seconds
Chapter 10: Managing the System
188
82935c10.qxd:Toolbox 10/29/07 1:15 PM Page 188
To avoid wasting RAM and speed up applications, Linux uses as much otherwise
unused RAM as possible for the disc cache. For that reason, the first line of output
from
free that often shows little free RAM can be misleading. We recommend you
pay closer attention to the second line of output, which shows the amount of RAM
actually available for applications. That amount is 501MB in this example:
-/+ buffers/cache: 223 501
One way to guess how much memory you need on a system is to go to another com-
puter running Ubuntu, then open every application you think you may be running
at once. Run
free with the total option (free -t) to see how much memory is being
used. Then make sure that your new system has at least that much total memory (with
most or all of it preferably being available in RAM).
The
top command provides a means of watching the currently running processes, with
those processes sorted by CPU usage or memory (see Chapter 9 for a description of
top for watching running processes). However, you can also use top to watch your mem-
ory usage in a screen-oriented way. Here is an example:
$ top
top - 14:14:59 up 3 days, 18:26, 1 user, load average: 0.11, 0.04, 0.01
Tasks: 114 total, 3 running, 111 sleeping, 0 stopped, 0 zombie
Cpu(s): 0.0%us, 0.0%sy, 0.0%ni,100.0%id, 0.0%wa, 0.0%hi, 0.0%si, 0.0%st
Mem: 742476k total, 727232k used, 15244k free, 153708k buffers
Swap: 1020116k total, 72k used, 1020044k free, 343924k cached
PID USER PR NI VIRT RES SHR S %CPU %MEM TIME+ COMMAND
2347 root 34 19 89552 77m 5636 S 0.0 10.7 6:05.75 yum-updatesd
2797 chris 18 0 80612 27m 18m S 0.0 3.8 0:01.29 nautilus
2814 chris 15 0 44420 22m 20m S 0.0 3.1 0:00.17 nm-applet
To exit top, press q. Like the output for free, top shows total of memory usage for
RAM (
Mem:) and swap space (Swap:). However, because top is screen oriented and
provides ongoing monitoring, you can watch memory usage change every three sec-
onds (by default). With
top running, press Shift+m and the running processes will be
displayed in memory-use order (so you can watch which processes are consuming the
most memory). The most useful column to analyze a process’ memory usage is
RES,
which shows the process’ actual physical RAM usage, also known as resident size.
The
%MEM column is based on this resident size.
For a more detailed view of your virtual memory statistics, use the
vmstat command.
With
vmstat you can view memory use over a given time period, such as since the previous
reboot or using a sample period. The following example shows
vmstat redisplaying
statistics every three seconds:
$ vmstat 3
procs memory swap io system cpu
r b swpd free buff cache si so bi bo in cs us sy id wa st
1 0 97740 32488 3196 148360 0 0 0 1 26 3876 85 15 0 0 0
1 1 98388 7428 3204 151472 0 216 0 333 30 3200 82 18 0 0 0
1 0 113316 8148 2980 146968 0 4980 4 5121 79 3846 77 23 0 0 0
189
Chapter 10: Managing the System
82935c10.qxd:Toolbox 10/29/07 1:15 PM Page 189
2 0 132648 7472 2904 148488 0 6455 3 6455 90 3644 83 17 0 0 0
2 0 147892 8088 2732 144208 0 5085 9 5220 79 3468 84 16 0 0 0
1 0 157948 7680 2308 134812 0 3272 12 3296 69 3174 77 23 0 0 0
3 0 158348 7944 1100 123888 21 144 25 275 26 3178 86 14 0 1 0
2 0 166116 7320 568 120280 11 2401 20 2403 51 3175 84 16 0 0 0
3 0 181048 7708 648 119452 53 4852 796 4984 123 1783 86 13 0 1 0
To exit vmstat, press Ctrl+c. The vmstat example shows a 30-second time period
where more than 100 applications are started. Notice that when the free space goes
from 32488 kilobytes to 7428 kilobytes (RAM is filling up), data begins being moved
to the swap area (see the 216 under the so column). Because the swap area resides on
the hard disk, you can see that the block written to disk device (
bo) increases as the
swap out increases. You can see the amount of swap space being used increasing
under the
swpd column.
The CPU is also straining in the example, with no idle time showing (
id 0). Notice
also that when some of the applications need to be swapped back in (see the last
three lines of output), the processor has to wait on two occasions for input/output
to complete (
wa 1).
Here are some other options for using
vmstat:
$ vmstat -S m Display output in 1000k megabytes
$ vmstat -S M Display output in 1024k megabytes
$ vmstat -S k Display output in 1000-byte kilobytes
$ vmstat -S K Display output in 1024-byte kilobytes
$ vmstat -n 2 10 Output every two seconds, repeat 10 times
$ vmstat -s | less Display event counters and memory statistics
$ vmstat -S M -s | less Display statistics in megabytes
725 M total memory
717 M used memory
486 M active memory
175 M inactive memory
7 M free memory
1 M buffer memory
120 M swap cache
996 M total swap
802 M used swap
193 M free swap
The previous example shows various memory statistics (-s) output in megabytes
(
-S M), which we find more convenient to get a general view of memory usage. The
other examples show how to display
vmstat output in megabytes and kilobytes (in
both marketing and technical terms). After that, the
-n 2 10 option tells vmstat to
repeat every set number of seconds (
2) for a limited number of times (10).
With commands such as
ps and top, you can see how much memory each application
is consuming on your system. The kernel itself, however, has its own memory cache to
190
Chapter 10: Managing the System
82935c10.qxd:Toolbox 10/29/07 1:15 PM Page 190
keep track of its resources, called the kernel slab. You can use the vmstat command to
display kernel slab memory cache statistics (from
/proc/slabinfo) as follows:
$ vmstat -m | less Page through kernel slab memory cache
Cache Num Total Size Pages
nf_nat:help 2 13 308 13
nf_nat:base 0 0 276 14
bridge_fdb_cache 0 0 64 59
ext3_inode_cache 1236 2928 488 8
ext3_xattr 29 156 48 78
The slab memory cache information shows each cache name, the number of objects
active for that cache type, the total number of objects available for that cache type, the
size of the cache (in bytes), and the number of pages for each cache. You can display ker-
nel slab memory cache information in a screen-oriented view (similar to the
top command) using
slabtop:
$ slabtop
Active / Total Objects (% used) : 49127 / 70942 (69.2%)
Active / Total Slabs (% used) : 3094 / 3094 (100.0%)
Active / Total Caches (% used) : 101 / 145 (69.7%)
Active / Total Size (% used) : 8830.29K / 12013.73K (73.5%)
Minimum / Average / Maximum Object : 0.01K / 0.17K / 128.00K
OBJS ACTIVE USE OBJ SIZE SLABS OBJ/SLAB CACHE SIZE NAME
11600 4303 37% 0.13K 400 29 1600K dentry_cache
2928 1246 42% 0.48K 366 8 1464K ext3_inode_cache
4355 2535 58% 0.28K 335 13 1340K radix_tree_node
219 219 100% 4.00K 219 1 876K size-4096
4128 3485 84% 0.16K 172 24 688K filp
The slabtop output updates every three seconds. By default, slab caches are sorted
by the number of objects (first column) in each cache. By pressing c you can sort by
cache size instead (as shown in the previous example).
Monitoring CPU Usage
An overburdened CPU is another obvious place to look for performance problems
on your system. The
vmstat command, shown earlier, can produce basic statistics
relating to CPU usage (user activity, system activity, idle time, I/O wait time, and
time stolen from a virtual machine). The
iostat command (from the sysstat pack-
age), however, can generate more detailed reports of CPU utilization.
Here are two examples of using
iostat to display a CPU utilization report:
$ iostat -c 3 CPU stats every 3 seconds (starting apps)
Linux 2.6.21-1.3194.fc7 (davinci) 08/10/2007
191
Chapter 10: Managing the System
82935c10.qxd:Toolbox 10/29/07 1:15 PM Page 191
avg-cpu: %user %nice %system %iowait %steal %idle
0.50 0.00 0.00 0.00 0.00 99.50
avg-cpu: %user %nice %system %iowait %steal %idle
28.71 0.00 5.45 18.32 0.00 47.52
avg-cpu: %user %nice %system %iowait %steal %idle
98.99 0.00 1.01 0.00 0.00 0.00
avg-cpu: %user %nice %system %iowait %steal %idle
99.50 0.00 0.50 0.00 0.00 0.00
$ iostat -c 3 CPU stats every 3 seconds (copying files)
Linux 2.6.21-1.3194.fc7 (davinci) 08/10/2007
avg-cpu: %user %nice %system %iowait %steal %idle
0.50 0.00 0.00 0.00 0.00 0.00
avg-cpu: %user %nice %system %iowait %steal %idle
0.50 0.00 24.88 74.63 0.00 0.00
avg-cpu: %user %nice %system %iowait %steal %idle
0.50 0.00 10.00 89.50 0.00 0.00
avg-cpu: %user %nice %system %iowait %steal %idle
0.50 0.00 17.41 82.09 0.00 0.00
avg-cpu: %user %nice %system %iowait %steal %idle
0.00 0.00 14.65 85.35 0.00 0.00
The first iostat example above starts with a quiet system, then several applications
started up. You can see that most of the processing to start the applications is being
done in user space. The second
iostat example shows a case where several large
files are copied from one hard disk to another. The result is a high percentage of time
being spent at the system level, also known as kernel space (in this case, reading from
and writing to disk partitions). Note that the file copies also result in a higher amount
of time waiting for I/O requests to complete (%
iowait).
Here are examples using
iostat to print CPU utilization reports with timestamps:
$ iostat -c -t Print time stamp with CPU report
Linux 2.6.21-1.3194.fc7 (davinci) 08/10/2007
Time: 9:28:03 AM
avg-cpu: %user %nice %system %iowait %steal %idle
0.50 0.00 0.00 0.00 0.00 99.50
$ iostat -c -t 2 10 Repeat every 2 seconds for 10 times
The dstat command (dstat package) is available as an alternative to iostat for viewing
information about your CPU usage (as well as other performance-related items). One advan-
tage of
dstat over other tools is that it more precisely shows the units of measurement
it is displaying (such as kilobytes or megabytes) and also uses colors to differentiate the
data. Here is an example of
dstat for displaying CPU information:
$ dstat -t -c 3 View CPU usage continuously with time stamps
time total-cpu-usage
__epoch___|usr sys idl wai hiq siq
1189727284| 0 0 100 0 0 0
1189727287| 1 0 99 0 0 0
192
Chapter 10: Managing the System
82935c10.qxd:Toolbox 10/29/07 1:15 PM Page 192
1189727290| 3 0 97 0 0 0
1189727293| 0 0 100 0 0 0
1189727296| 5 0 95 0 0 0
1189727299| 1 0 99 0 0 0
1189727302| 3 0 97 0 0 0
1189727305| 0 0 100 0 0 0
1189727308| 3 0 96 0 1 0
1189727311| 1 0 99 0 0 0
1189727314| 0 0 100 0 0 0
1189727317| 0 0 100 0 0 0
1189727320| 1 0 99 0 0 0
1189727323| 5 0 95 0 0 0
1189727326| 3 0 97 0 0 0
1189727329| 3 0 97 0 0 0
1189727332| 2 0 98 0 0 0
1189727335| 5 0 95 0 0 0
In this example, the output includes a date/time values based on the start of the
epoch (
-t) for the CPU report (-c) that is produced every three seconds (3). This
report runs continuously until you stop it (Ctrl+c).
If you want to find out specifically which processes are consuming the most process-
ing time, you can use the
top command. Type top, then press Shift+p to sort by CPU
usage (this is the default sorting order):
$ top Display running processes and sort by CPU usage
Tasks: 120 total, 3 running, 116 sleeping, 0 stopped, 1 zombie
Cpu(s): 86.8% us, 6.0% sy, 0.0% ni, 3.3% id, 4.0% wa, 0.0% hi, 0.0% si
Mem: 482992k total, 476884k used, 6108k free, 1220k buffers
Swap: 5863716k total, 1166252k used, 4697464k free, 52984k cached
PID USER PR NI VIRT RES SHR S %CPU %MEM TIME+ COMMAND
9648 chris 16 0 309m 123m 16m R 72.6 26.1 287:55.22 firefox-bin
552 root 15 0 762m 65m 5732 S 15.6 14.0 4388:27 X
The full output would show many more processes, all sorted by current CPU usage
(
%CPU column). In this example, Firefox web browser (72.6%) and the X display server
(15.6%) are consuming most of the CPU. If you decided you wanted to kill the Firefox
process, you could type k followed by the process ID of Firefox (9648) and the number
9 signal (if for some reason you couldn’t just close the Firefox window normally).
If you want information about the processor itself, you can view information directly from
the
/proc/cpuinfo file. Here is an example:
$ cat /proc/cpuinfo View CPU information from /proc
processor : 0
vendor_id : AuthenticAMD
cpu family : 6
model : 4
model name : AMD Athlon(tm) processor
stepping : 4
193
Chapter 10: Managing the System
82935c10.qxd:Toolbox 10/29/07 1:16 PM Page 193
cpu MHz : 1340.080
cache size : 256 KB
flags : fpu vme de pse tsc msr pae mce cx8 apic mtrr pge mca cmov pat
pse36 mmx fxsr syscall mmxext 3dnowext 3dnow up
bogomips : 2680.91
clflush size : 32
An interesting thing to note about your CPU are the flags that represent features that
it supports. Some features in Ubuntu require that particular CPU extensions associ-
ated with those flags be on for the Ubuntu feature to work. For example, to use the
Xen virtualization para-virtualized guests, the
pae flag must be set. To run fully vir-
tualized guests, the CPU must have either the
vmx flag (for Intel processors) or svm
flag (for AMD processors) extension support.
Similar information about your processor(s) is collected by the system at the very
beginning of the boot process, and can be obtained by looking at the beginning of
the output of the
dmesg command.
Monitoring Storage Devices
Basic information about storage space available to your Linux file systems can be seen
using commands such as
du and df (as described in Chapter 7). If you want details
about how your storage devices are performing, however, commands such as
vmstat
and iostat can be useful.
Some of the same kind of output from the
iostat command shown earlier can be
used to tell if bottlenecks occur while doing disk reads and writes. Here’s an example:
$ iostat 3 Check disk reads and writes per disk
Linux 2.6.21-1.3194.fc7 (davinci) 08/11/2007
avg-cpu: %user %nice %system %iowait %steal %idle
13.15 0.60 0.59 0.16 0.00 85.49
Device: tps Blk_read/s Blk_wrtn/s Blk_read Blk_wrtn
sda 1.09 32.08 58.94 16086324 29554312
sdb 0.29 5.27 11.23 2644482 5631348
avg-cpu: %user %nice %system %iowait %steal %idle
1.00 0.00 42.14 45.15 0.00 11.71
Device: tps Blk_read/s Blk_wrtn/s Blk_read Blk_wrtn
sda 411.37 66515.05 2.68 198880 8
sdb 68.23 2.68 14696.99 8 43944
avg-cpu: %user %nice %system %iowait %steal %idle
0.67 0.00 41.00 58.33 0.00 0.00
Device: tps Blk_read/s Blk_wrtn/s Blk_read Blk_wrtn
sda 239.67 52530.67 106.67 157592 320
sdb 236.00 0.00 55077.33 0 165232
194
Chapter 10: Managing the System
82935c10.qxd:Toolbox 10/29/07 1:16 PM Page 194
The first part of the output of iostat shows averages of CPU usage since the last
reboot. The next part reflects processing that occurs when a large amount of data is
copied from the first disk (
sda) to the second disk (sdb). High iowait values indicate
that disk input/output is the bottleneck on the system. In other words, faster disk
writing would improve performance more than a faster CPU.
The
vmstat command can also list statistics about your disks. Here’s an example of
using
vmstat to list information about disk reads and writes:
$ vmstat -d Display disk read, write, and input/output statistics
disk- reads writes IO
total merged sectors ms total merged sectors ms cur sec
sda 332773 74844 19022380 2524211 245477 3473801 29758560 37140075 0 1372
sdb 79963 253716 2646922 2158000 76044 977122 8428140 12489809 0 506
The Linux system in this example has two hard disks (sda and sdb). You can see the
total number of sectors successfully read and written from those hard disks. You can
also see how many seconds were spent on input/output (
IO) for those disks. Further -
more, you can see if there any I/O operations in progress, and you can also list read/
write information for selected disk partitions. Here is an example:
$ vmstat -p sda1 Display read/write stats for a disk partition
sda1 reads read sectors writes requested writes
174060 12993689 2778 22224
Unfortunately the preceding command does not work with softraid md partitions, lvm
partitions, and some hardware RAID driver-specific devices.
If you want to find out what files and directories are currently open on your storage devices, you can
use the
lsof command. This command can be particularly useful if you are trying to
unmount a file system that keeps telling you it is busy. You can check what open file
is preventing the unmount and decide if you want to kill the process holding that file
open and force an unmount of the file system. Here is an example of
lsof:
$ lsof | less List processes holding files and directories open
COMMAND PID USER FD TYPE DEVICE SIZE NODE NAME
init 1 root cwd DIR 8,5 4096 2 /
init 1 root rtd DIR 8,5 4096 2 /
init 1 root txt REG 8,5 38620 2049530 /sbin/init
bash 23857 chris cwd DIR 8,1 4096 2719746 /mnt/sda1/dx
The first files shown as being open are those held open by the init process (the first
running process on the system). Files held open by system processes (such as
udevd)
and daemons (such as
sshd and syslogd) follow init. Eventually, you will see files
held open by individual users (which are probably the ones you are interested in if
you are unable to unmount a disk partition).
195
Chapter 10: Managing the System
82935c10.qxd:Toolbox 10/29/07 1:16 PM Page 195
NOTE You may see permission restrictions unless you run the sudo
command first:
$ sudo lsof | less
When you are looking at the lsof output, you want to see the name of the file
or directory that is open (
NAME), the command that has it open (COMMAND), and
the process ID of that running command (
PID). As is often the case when a file
system you want to unmount is being held open, the
/mnt/sda1 file system is
being held open by a
bash shell in the preceding example (/mnt/sda1/dx is the
bash shell’s current working directory). In fact, instead of piping
lsof output to
less or grep, here are a few other ways you can find what you are looking for
from
lsof output:
$ lsof -c bash List files open by bash shells
$ lsof -d cwd List directories open as current working directory
$ lsof -u chris List files and directories open by user chris
$ lsof /mnt/sda1 List anything open on /mnt/sda1 file system
$ lsof +d /mnt/sda1/dx List anything open under /mnt/sda1/dx directory
As noted previously, you may need to use the sudo command to acquire the root per-
missions to view all the output of the
lsof command.
Mastering Time
Keeping correct time on your Linux system is critical to the system’s proper function-
ing. Your computer running Linux keeps time in two different ways: a system clock
(which Linux uses to keep track of time) and a hardware clock (that sets the system
time when Linux boots up).
The system time is what is used to set timestamps for file creation, process runtimes,
and anything else where date and time are used. System time can be viewed and set
manually (with the
date command) or automatically (with the ntpd service).
The hardware clock is part of the motherboard’s CMOS and runs on a battery attached
to the motherboard when the system is powered off. You set the hardware clock with
the
hwclock command.
There are many other tools that can be used to work with time in Linux systems. For
example, there are tools for checking time in different ways, such as using
clockdiff
(to measure clock difference between computers) and uptime (to see how long your
system has been up).
196
Chapter 10: Managing the System
82935c10.qxd:Toolbox 10/29/07 1:16 PM Page 196
Changing Time/Date with Graphical Tools
Graphical tools in Ubuntu and and other Linux systems for changing the date, time
and time zone used on your system include the Date and Time Settings window
(
sudo time-admin command). That window can also be used to enable the Network
Time Protocol (NTP), to automatically synchronize your Linux system’s date and time
with a selected time server over the network. You may need to install NTP support,
available as a handy button-click on the Date and Time Settings window.
The Date/Time Properties window saves the settings and choices you make. During
Ubuntu startup, the system reads these settings to set your time zone and whether
your system is using UTC time.
Your Linux system’s time zone is set based on the contents of the
/etc/localtime
file. You can set a new time zone immediately by copying the file representing your
time zone from a subdirectory of
/usr/share/zoneinfo. For example, to change
the current time zone to that of America/Chicago, you could do the following:
$ sudo cp /usr/share/zoneinfo/America/Chicago /etc/localtime
This can also be accomplished by creating a symlink:
$ sudo ln –s /usr/share/zoneinfo/America/Chicago /etc/localtime
To change the time zone permanently, set it in the Date and Time Settings window to
the time zone you want. For example,
America/Chicago.
Displaying and Setting Your System Clock
The date command is the primary command-based interface for viewing and chang-
ing date and time settings, if you are not having that done automatically with NTP.
Here are examples of
date commands for displaying dates and times in different ways:
$ date Display current date, time and time zone
Sun Aug 12 01:26:50 CDT 2007
$ date ‘+%A %B %d %G’ Display day, month, day of month, year
Sunday August 12 2007
$ date ‘+The date today is %F.’ Add words to the date output
The date today is 2007-08-12
$ date date=’4 weeks’ Display date four weeks from today
Sun Sep 9 10:51:18 CDT 2007
$ date date=’8 months 3 days’ Display date 8 months 3 days from today
Tue Apr 15 10:59:44 CDT 2008
$ date date=’4 Jul’ +%A Display day on which July 4 falls
Wednesday
197
Chapter 10: Managing the System
82935c10.qxd:Toolbox 10/29/07 1:16 PM Page 197
Although our primary interest in this section is time, since we are on the subject
of dates as well, the
cal command is a quick way to display dates by month. Here are
examples:
$ cal Show current month calendar (today is highlighted)
August 2007
Su Mo Tu We Th Fr Sa
1 2 3 4
5 6 7 8 9 10 11
12 13 14 15 16 17 18
19 20 21 22 23 24 25
26 27 28 29 30 31
$ cal 2007 Show whole year’s calendar
2007
January February March
Su Mo Tu We Th Fr Sa Su Mo Tu We Th Fr Sa Su Mo Tu We Th Fr Sa
1 2 3 4 5 6 1 2 3 1 2 3
7 8 9 10 11 12 13 4 5 6 7 8 9 10 4 5 6 7 8 9 10
14 15 16 17 18 19 20 11 12 13 14 15 16 17 11 12 13 14 15 16 17
21 22 23 24 25 26 27 18 19 20 21 22 23 24 18 19 20 21 22 23 24
28 29 30 31 25 26 27 28 25 26 27 28 29 30 31
$ cal -j Show Julian calendar (numbered from January 1)
August 2007
Sun Mon Tue Wed Thu Fri Sat
213 214 215 216
217 218 219 220 221 222 223
224 225 226 227 228 229 230
231 232 233 234 235 236 237
238 239 240 241 242 243
The date command can also be used to change the system date and time. For example:
$ sudo date 081215212008 Set date/time to Aug. 12, 2:21PM, 2008
Tue Aug 12 11:42:00 CDT 2008
$ sudo date set=’+7 minutes’ Set time to 7 minutes later
Sun Aug 12 11:49:33 CDT 2008
$ sudo date set=’-1 month’ Set date/time to one month earlier
Sun Jul 12 11:50:20 CDT 2008
The next time you boot Ubuntu, the system time will be reset based on the value of
your hardware clock (or your NTP server, if NTP service is enabled). And the next
time you shut down, the hardware clock will be reset to the system time, in order to
preserve that time while the machine is powered off. To change the hardware clock,
you can use the
hwclock command.
198
Chapter 10: Managing the System
82935c10.qxd:Toolbox 10/29/07 1:16 PM Page 198
Displaying and Setting Your Hardware Clock
Anyone can use the hwclock command to view hardware clock settings; however,
you must have root privileges to change those settings. To use
hwclock to view the
current time from your computer’s hardware clock, type the following:
$ hwclock -r Display current hardware clock settings
Sun 12 Aug 2007 03:45:40 PM CDT -0.447403 seconds
Even if your hardware clock is set to UTC time, hwclock displays local time by default.
If your system time strays from your hardware clock (for example, if you tried some of
the
date commands shown previously), you can reset your system clock from your hardware clock
as follows:
$ sudo hwclock hctosys Reset system clock from hardware clock
Likewise if your hardware clock is set incorrectly (for example, if you replaced the
CMOS battery on your motherboard), you can set the hardware clock from your system clock
as follows:
# hwclock systohc Reset hardware clock from system clock
Over time your hardware clock can drift. Because the clock tends to drift the same
amount each day,
hwclock can keep track of this drift time (which it does in the
/etc/adjtime file). You can adjust the hardware clock time based on the adjtime file
as follows:
$ sudo hwclock adjust Adjust hardware clock time for drift
To set the hardware clock to a specific time, you can use the set option. Here is an example:
$ sudo hwclock set date=”3/18/08 18:22:00” Set clock to new date/time
In this example, the hardware clock is set to March 18, 2008 at 6:22 p.m. This update
does not immediately affect the system clock.
Using Network Time Protocol
to Set Date/Time
When you install Ubuntu, you are given the opportunity to set your system date and
time. An option at that time is to use preconfigured Network Time Protocol (NTP)
servers to automatically get the current date and time when your system reboots. If
you choose that option, the installer will setup the ntpd daemon and use it to keep
your time synchronized.
199
Chapter 10: Managing the System
82935c10.qxd:Toolbox 10/29/07 1:16 PM Page 199
If you didn’t configure NTP to set time for your system when you first installed your
Linux system, you can do so later by turning on the ntpd service. You can either install the
service from the Date and Time Settings window with a click of the button, or enter
commands.
Here is how to enable the service from the command line:
$ sudo apt-get install ntp Install ntp package if necessary, start the service
The ntpd service uses information in the /etc/ntpd.conf file. You can specify the
name or IP address of the time server to query for the time, for example.
Whether you install ntpd manually or let the installer do it automagically, the resulting
setup turns your machine into a time server, listening on UDP port 123. Unless you have
very specific needs (and your own GPS or atomic clock), running ntpd on your machine
can be both a waste of resources and a security risk. For that reason, some system admin-
istrators prefer using
ntpdate (often in a daily cronjob) to set their system time via NTP:
$ sudo ntpdate pool.ntp.org
15 Aug 00:37:12 ntpdate[9706]:
adjust time server 66.92.68.11 offset 0.009204 sec
If you try running ntpdate while ntpd is running, you will get the following error:
$ sudo ntpdate pool.ntp.org
15 Aug 00:37:00 ntpdate[9695]: the NTP socket is in use, exiting
Note that the ntpdate command has been marked as deprecated and will disappear
in the future. It has been replaced by the following options of ntpd:
$ sudo ntpd –qg
The –q option tells ntpd to exit after setting the clock (as opposed to keep running as
a daemon). The
–g option prevents ntpd from panicking if the system clock is off by
more than 1000 seconds.
Managing the Boot Process
When a computer first starts up, the basic input/output system (BIOS) looks to its
boot order settings to determine where to find the operating system to boot. Typically,
if a bootable medium has not been inserted into a removable drive (CD, DVD, floppy
disk, and so on), the BIOS looks to the master boot record (MBR) on the first bootable
hard disk. At this point, for most Linux systems, control of the boot process is handed
to the boot loader.
200
Chapter 10: Managing the System
82935c10.qxd:Toolbox 10/29/07 1:16 PM Page 200
For Ubuntu, and, in fact, most Linux systems these days, the Grand Unified Boot
Loader (GRUB) is the boot loader that is used by default. GRUB is a replacement for
LILO, which was the most popular Linux boot loader during the 1990s. GRUB can be
set up to boot not only your Linux system, but also to boot any other operating sys-
tems installed on your hard disks (Windows, BSD, or others). GRUB can also include
boot options with each bootable operating system to refine the boot process, such as
to turn on or off support for a particular type of hardware.
Once a Linux system is selected to boot from the boot loader, the boot loader loads the
kernel. The following dilemma then occurs: the kernel needs to mount the root file sys-
tem on the hard drive. This requires the appropriate storage drivers (block device kernel
modules). And those drivers are located on the hard drive itself! To break that vicious
cycle, a small initial ramdisk (initrd) containing the block device modules is mounted
by the boot loader. This allows the Linux kernel to read the root file system. After that,
the
init process takes over and begins starting the system services, based on the run
level that is set for the system.
The following sections describe commands for modifying the boot loader, startup
scripts, and run levels associated with your Linux system.
Using the GRUB Boot Loader
Assuming GRUB was set up when you first installed Ubuntu, the settings for your
boot loader are stored in the
/boot/grub/menu.lst file. Any changes you make to
that file are picked up automatically when you reboot Ubuntu. Here’s an example of
the contents of the
/boot/grub/menu.lst file:
default=0
timeout=5
hiddenmenu
title Ubuntu, kernel 2.6.20-16-generic
root (hd0,0)
kernel /vmlinuz-2.6.20-16-generic
root=UUID=db2dac48-a62e-4dbe-9529-e88a57b15bac ro quiet splash
initrd /initrd.img-2.6.20-16-generic
This example shows only one bootable operating system (Ubuntu), although the
default file normally lists a number of variants, such as a recovery mode version of
Ubuntu. The
default=0 line says that the first title entry is booted by default. The
timeout=5 line says that GRUB pauses five seconds at the splash screen before boot-
ing. The
hiddenmenu line indicates that you won’t see the list of bootable titles when
the boot splash screen appears (press a key during the timeout period to see the menu).
201
Chapter 10: Managing the System
82935c10.qxd:Toolbox 10/29/07 1:16 PM Page 201
The actual boot entry (title Ubuntu) points to the first partition on the first hard
disk (
hd0,0), which contains the kernel and initial RAM disk (initrd) to be booted. To
change how that kernel boots, you can add options to the end of the kernel line. Or
you can add entirely new title entries to boot different kernels or operating systems.
Some available boot options are described in Table 2-1 in Chapter 2. Options you might
want to add to the end of the kernel line include
3 (to boot into runlevel 3, text mode)
or
ide=nodma (to turn off DMA if your system is having hard disk errors).
In normal circumstances, you don’t need to run any commands to have changes to
menu.lst picked up by your boot loader. When you reboot, the menu.lst file is read
directly from the hard disk. However, if your MBR becomes corrupted for some reason
and your system won’t boot, you may need to reload the GRUB boot loader.
To reinstall GRUB on your hard disk’s MBR, boot a Ubuntu live CD or install CD
in rescue mode and follow the instructions to change root (chroot) to the hard
disk partition containing your Ubuntu system. Then, assuming that you’re booting
from your computer’s first SATA hard disk, type the following to reload the boot loader
to the MBR:
$ sudo grub-install /dev/sda
The boot loader should now be installed on your hard disk’s MBR. If your menu.lst
file is correct, your system should be able to reboot from hard disk now.
In addition, you can use the
update-grub command to create the menu.lst file from
questions you answer.
$ sudo update-grub
Repairing the initial ramdisk (initrd)
The initrd is a file located in /boot with a name like initrd.img-2.6.20-16-generic.
If your initrd becomes corrupted, or if you need to add new block device drivers to it,
run the
mkinitrd command. First, make sure you make a copy of your existing initrd
file. Then run the following commands:
$ sudo apt-get install initrd-tools
$ sudo mkinitrd -o /boot/ initrd.img-2.6.20-16-generic
Replace the kernel version in the example above (2.6.20-1.2320.fc5) with your own ker-
nel version. Alternatively, to use the currently running kernel version, you can use:
$ sudo mkinitrd -o /boot/initrd.img-`uname –r` `uname –r`
Unfortunately, you will often realize that you need to rebuild your initrd after it is
too late, as you witness a kernel panic during the root file system mount stage of
202
Chapter 10: Managing the System
82935c10.qxd:Toolbox 10/29/07 1:16 PM Page 202
boot. When that occurs, boot into rescue mode as described in the previous section
and run
mkinitrd after chrooting to the proper hard disk partition.
Controlling Startup and Run Levels
After the kernel has started up, it hands control of the system to the init process. The
init process becomes the first running process on the system (PID 1), directing the
start-up of other processes based on the contents of the
/etc/inittab file, the default
run level, and the
init scripts set to run at that run level.
The default run level is typically set to
5 for desktop systems and 3 for server sys-
tems (based on the value passed to the
telinit command in the /etc/event.d/
rc-default
file). As noted earlier, that value can be overridden by adding a differ-
ent run level number (
S, 1, 2, 3, 4, or 5) to the end of the kernel boot line from the
boot screen.
Most Linux administrators leave the basic startup features alone and focus on which
services are turned on or off at the selected run level. The mechanism for starting run
level scripts in Ubuntu, and similar systems is based on the System V Init facility
(sysvinit and initscripts packages), used originally in AT&T UNIX System V systems.
NOTE Even though Ubuntu uses the upstart system rather than the init system,
you can still change run levels with the
init or telinit command.
This section contains commands for working with system initialization scripts and
changing run levels. As root, you can use the
runlevel command to see the current
run level:
$ runlevel Display current and previous run levels
N 2
Because the system in this example booted directly to run level 3, there is no previous
run level (
N). To change the current run level, you can use the init command:
$ sudo init 5 Change the current run level to 5 (X Desktop)
In this example, the current run level changes from the previous level (in this case, 3)
to run level
5 (which starts the X Window graphical user interface). You can also use
the
q option to the init command to reexamine the /etc/inittab file and start or stop processes
based on changes made to that file:
$ sudo init q Start or stop changed processes in inittab file
Note that running init q does not start or stop System V services. It is used mostly
when tinkering with the
gettys defined in the files in the /etc/event.d directory.
203
Chapter 10: Managing the System
82935c10.qxd:Toolbox 10/29/07 1:16 PM Page 203
To manage services, you can use the chkconfig and service commands. For example,
to start the NTP service immediately, you could type this:
$ sudo /etc/init.d/ntp start Start Samba service immediately
Starting NTP server ntpd [ OK ]
Each service comes with a shell script in the /etc/init.d directory. You can pass
start or stop options to each service. The format is:
sudo /etc/init.d/service_to_control start
sudo /etc/init.d/service_to_control stop
Most of the scripts in the /etc/init.d directory support start and stop options, while
some support other features as well. Here’s how to use
service to start and stop services:
$ /etc/init.d/ntp Show usage statement (with no options)
Usage: /etc/init.d/ntp {start|stop|restart|try-restart|force-reload|status}
$ sudo /etc/init.d/ntp restart Restart NTP service (first off, then on)
* Stopping NTP server ntpd [ OK ]
* Starting NTP server ntpd [ OK ]
$ sudo /etc/init.d/ntp try-restart Restart NTP service (if already running)
* Stopping NTP server ntpd [ OK ]
* Starting NTP server ntpd [ OK ]
$ sudo /etc/init.d/ntp force-reload Reload settings in config file
* Stopping NTP server ntpd [ OK ]
* Starting NTP server ntpd [ OK ]
$ sudo /etc/init.d/ntp status Check if the NTP service is running (smbd)
* NTP server is running.
$ sudo /etc/init.d/ntp stop Stop NTP service
* Stopping NTP server ntpd [ OK ]
Any of the init scripts contained in /etc/init.d can be started in this way, but not
all scripts support all the features just shown. Most
init scripts, however, will show
their usage statement with no option (as shown in the first example above).
Although the previous commands start the run level script service immediately, to
have a service start automatically at boot time or during a run level change, you can
use the
update-rc.d command. In addition, most installation scripts for services will
automatically turn a service on for the next time you boot. With
update-rc.d, you can
turn services on, or turn them off on a per–run level basis. Here are examples:
$ sudo update-rc.d ntp defaults Turn on the NTP service
NOTE The documentation for the update-rc.d command recommends you not
use this command to manage the run levels of your system. See the online man
page for the
update-rc.d command for details.
Although you can use the
init command to change to any run level, including init 0
(shut down) and init 6 (reboot), there are also specific commands for stopping Linux.
204
Chapter 10: Managing the System
82935c10.qxd:Toolbox 10/29/07 1:16 PM Page 204
The advantages of commands such as halt, reboot, poweroff, and shutdown are that
they include options to let you stop some features before shutdown occurs. For example:
WARNING! Don’t try the following commands if you don’t intend to actually
turn off your system, especially on a remote system.
$ sudo reboot Reboot the computer
$ sudo halt -n Don’t run sync to sync hard drives before shutdown
$ sudo halt -h Put hard drives in standby mode before halting
$ sudo shutdown 10 Shutdown in ten minutes after warning the users
$ sudo shutdown -r 10 Reboot in ten minutes after warning the users
$ sudo shutdown 10 ‘Bye!’ Send custom message to users before shutdown
Besides the reboot and init 6 commands, you can also use the old PC keystrokes
Ctrl+Alt+Del to reboot your computer.
Straight to the Kernel
In general, when the kernel starts up on your Linux system, you shouldn’t have to do
too much with it. However, there are tools for checking the kernel that is in use and for
seeing information about how the kernel started up. Also, if something goes wrong or
if there is some extra support you need to add to the kernel, there are tools to do those
things.
To find out what kernel is currently running on your system, type the following:
$ uname -r Display name of kernel release
2.6.20-16-generic
$ uname -a Display all available kernel info
Linux server.domain.com #2 SMP Fri Aug 31 00:55:27 UTC 2007 i686 GNU/Linux
When the kernel starts, messages about what occurs are placed in the kernel ring
buffer. You can display the contents of the kernel ring buffer using the
dmesg command:
$ dmesg |less
[ 0.000000] Linux version 2.6.20-16-generic (root@terranova) (gcc version 4.1
.2 (Ubuntu 4.1.2-0ubuntu4)) #2 SMP Fri Aug 31 00:55:27 UTC 2007 (Ubuntu 2.6.20-1
6.31-generic)
[ 0.000000] BIOS-provided physical RAM map:
[ 0.000000] sanitize start
[ 0.000000] sanitize end
[ 15.935761] CPU: L1 I cache: 32K, L1 D cache: 32K
[ 15.935763] CPU: L2 cache: 2048K
[ 15.935765] CPU: Physical Processor ID: 0
[ 15.935767] CPU: Processor Core ID: 0
[ 15.935768] CPU: After all inits, caps: bfebfbff 20100000 00000000 00003940 0
000e3bd 00000000 00000001
205
Chapter 10: Managing the System
82935c10.qxd:Toolbox 10/29/07 1:16 PM Page 205
If that buffer fills up, it may no longer contain the beginning of the recorded informa-
tion. In that case, you can use
less /var/log/dmesg.
Other information of interest about kernel processing can be found in the
/var/log
files — in particular, the messages file. You can page through those files as follows:
$ sudo cat /var/log/messages* | less Page through /var/log/messages
Aug 5 21:55:46 davinci syslogd 1.4.2: restart.
Aug 6 22:12:03 davinci kernel: eth0: link up, 100Mbps, lpa 0x45E1
Aug 6 22:13:06 davinci kernel: eth0: link down
Aug 6 22:13:07 davinci kernel: eth0: link up, 100Mbps, lpa 0x45E1
Aug 10 10:53:46 davinci init: Switching to runlevel: 3
In the best circumstances, all the hardware connected to your computer should be
detected and configured with the proper Linux drivers. In some cases, however,
either the wrong driver is detected or the necessary driver may not be available on
your system. For those cases, Linux offers ways of listing loadable kernel modules
and adding new ones to your system.
The
lsmod command lets you view the names of the loaded modules, their size, and what
other modules are using them. Here is an example:
$ lsmod
Module Size Used by
parport_pc 29797 1
parport 38025 2 lp,parport_pc
snd_ens1371 28769 1
gameport 19017 1 snd_ens1371
snd_rawmidi 26561 1 snd_ens1371
snd_ac97_codec 96357 1 snd_ens1371
ac97_bus 6465 1 snd_ac97_codec
snd_timer 24773 2 snd_seq,snd_pcm
soundcore 11553 2 snd
e100 37193 0
If you want to find out more information about a particular module, you can use the modinfo
command. Here’s an example:
$ modinfo snd_ens1371
filename: /lib/modules/2.6.21-1.3194.fc7/kernel/sound/pci/
snd-ens1371.ko
description: Ensoniq/Creative AudioPCI ES1371+
license: GPL
author: Jaroslav Kysela <>, Thomas Sailer
<>
srcversion: 411FDA312BD30C6B2A8F6E7
alias: pci:v00001102d00008938sv*sd*bc*sc*i*
alias: pci:v00001274d00005880sv*sd*bc*sc*i*
alias: pci:v00001274d00001371sv*sd*bc*sc*i*
depends: snd-pcm,snd,snd-rawmidi,gameport,snd-ac97-codec
vermagic: 2.6.21-1.3194.fc7 SMP mod_unload 686 4KSTACKS
206
Chapter 10: Managing the System
82935c10.qxd:Toolbox 10/29/07 1:16 PM Page 206