Microsoft press windows server 2008 active directory resource kit - part 8 pot
Bạn đang xem bản rút gọn của tài liệu. Xem và tải ngay bản đầy đủ của tài liệu tại đây (1.77 MB, 86 trang )
554 Part IV: Maintaining Windows Server 2008 Active Directory
■ Sufficient funds may be required to acquire the necessary management tools, training,
and hardware required to implement service monitoring.
■ A portion of your network bandwidth will be utilized to monitor the health of Active
Directory on all the domain controllers in the enterprise.
■ Memory and processor resources are used for running agent applications on target
servers and on the central monitoring console computer.
It is worth noting that the initial cost of monitoring goes up quickly when you move to an
enterprise-wide monitoring platform, such as Microsoft System Center Operations Manager.
This type of solution adds additional software costs, requires operator training, and may use
more system resources than many Windows Server 2008-native monitoring tools. However,
enterprise monitoring systems are proven, integrated, and supported products that provide
features that can lead to long-term cost savings and increase the operational efficiency of the
management and monitoring environment.
The level of monitoring you select will depend on your cost-benefit analysis. In all cases, the
amount of resources you dedicate to your monitoring solution should not exceed the pro-
jected costs you will save through monitoring. For this reason, larger organizations find it cost-
effective to invest in enterprise monitoring solutions. Smaller organizations, more often, can
justify using the monitoring tools built into Windows Server 2008.
Note
System Center Operations Manager incorporates event management, service moni-
toring and alerting, report generation, and trend analysis. It does so through a central console
in which agents running on the managed nodes (monitored servers) send data to be analyzed,
tracked, and displayed in a single management console. This centralization enables the
network administrator to manage a large and disparate collection of servers from a single
location with powerful management tools to remotely administer the server. Operations
Manager uses management packs to extend the knowledge base of data for specific network
services as well as server-based applications. Management packs are available for many
services and applications including Active Directory, Domain Name System (DNS), Microsoft
Internet Information Services (IIS), and Microsoft Exchange Server. For more information on
Operations Manager, see />Monitoring Server Reliability and Performance
Windows Server 2008 contains the Reliability And Performance Monitor, which is used to ana-
lyze system performance and provide detailed information on the reliability of various win-
dows-related and application-related components. The Reliability And Performance Monitor
is started from the Administrative Tools menu and consists of three monitoring tools that can
be used to address specific monitoring and troubleshooting requirements: the Resource
Overview, Performance Monitor, and the Reliability Monitor.
Chapter 14: Monitoring and Maintaining Active Directory 555
Resource Overview
The Resource Overview home page provides a summary of the usage and performance of the
CPU, Disk, Network, and Memory for the server. Data is provided in real time and is displayed
in four graphs. As shown in Figure 14-1, selecting the Root node of the Reliability And Perfor-
mance Monitor displays the Resource Overview. You can also obtain additional information
for each component by expanding its details section. For example, if you need to determine
which processes are currently running and the average CPU utilization for the process, you
can expand the CPU section, which will provide the information required.
Figure 14-1 Viewing Resource Overview details.
Note You can open a stand-alone version of the Resource Monitor by typing perfmon /res
in the Start Menu. If the Resource Overview does not display real-time data, be sure to start the
monitor by clicking the green start button (Reliability And Performance console only), or by
selecting Start from the Monitor menu (Resource Monitor view only).
Performance Monitor
The Performance Monitor (previously called System Monitor) can be used to view real-time
performance data of a local computer or several remote computers. You can also use the
Performance Monitor to view saved log files, which makes identifying performance trends
a much easier task. The basic functionality of the Performance Monitor has not changed
556 Part IV: Maintaining Windows Server 2008 Active Directory
significantly from previous Windows versions and provides several useful options, such as the
following:
■ To optimize the view of a particular counter, select the counter at the bottom of the details
pane and select the Highlight button on the toolbar (or press Ctrl +H). Doing so will high-
light the selected counter graph line, which is then easily viewed against the graph.
■ You can switch between the Line, Histogram, and Report view by selecting the appropri-
ate button on the toolbar.
■ You can save Performance Monitor graph settings as an HTML page. To do so, configure
a graph with the necessary counters, right-click the graph, and select Save Settings As.
The graph will be saved as an HTML file that you can open in a browser. When you open
the HTML version of the graph, the display is frozen. In the browser, click the Unfreeze
Display button on the Performance toolbar to restart the monitoring.
■ You can import a saved graph back into System Monitor by dragging the HTML file onto
the System Monitor window, which is a convenient way to save and reload frequently
used performance graphs.
■ Two new security groups in Windows Server 2008 ensure that only trusted users can
access and manipulate sensitive performance data: the Performance Log Users group
and the Performance Monitor Users group.
Note
You can open a stand-alone version of the Performance Monitor by typing perfmon
/sys in the Start Menu.
By default, the % Processor Time counter is preloaded into the Performance Monitor. To add
additional counters to the Performance Monitor console, perform the following steps:
1. Right-click the Performance Monitor details pane and click Add Counters.
2. In the Add Counters dialog box, click <Local computer> to monitor the computer on
which the monitoring console is run. To monitor a specific computer regardless of
where the monitoring console is run, click Browse and specify a computer name.
3. Expand the desired Performance Object and then click the counter you want to add.
4. Click Add and then click OK.
Even though the basic functionality is the same, there are still some welcome enhancements
to the Performance Monitor. Figure 14-2 illustrates some of these enhancements:
■ Improved counter options The Performance Monitor now provides more control over
how counters are viewed within the details pane. For both the Line and Histogram bar
graph types, you have the option to quickly hide or show selected counters by just
selecting the check box located under the Show column. You can also easily scale
selected counters in order to ensure that data remains visible within the graph.
Figure 14-2 has the % Processor Time counter scaled at 10.
Chapter 14: Monitoring and Maintaining Active Directory 557
■ Tool tips On Line graphs, you can a use your mouse pointer to determine exact perfor-
mance counter data. Figure 14-2 shows how a tool tip can provide the counter name,
value, and time for the data point that the mouse pointer is touching.
■ Zoom Performance Monitor provides the ability to view more granular detail for
logged data by zooming into a specific time range. Note that you cannot use the zoom
feature when capturing real-time data.
■ Comparison of multiple log files The stand-alone version of Performance Monitor
includes a feature that helps you compare multiple log files to a base view using a trans-
parent overlay. You can do this by opening multiple stand-alone Performance Monitor
windows, adding the log file to be compared to each window, and then selecting the
options found under the Compare menu.
Figure 14-2 Viewing Performance Monitor data.
Reliability Monitor
The Reliability Monitor provides information on the overall stability of a server. A System Sta-
bility Index is calculated based on data collected as specific events occur within the server
over a period of time. These events include:
■ Software installs and uninstalls This category includes applications installed or removed
using an MSI installer package, driver installation and removal, software update instal-
lation and removal, and operating system updates such as service packs or hotfixes.
■ Application failures This category reports on events related to application hangs or
crashes.
558 Part IV: Maintaining Windows Server 2008 Active Directory
■ Hardware failures This category reports on events related to hard disk and memory failures.
■ Windows failures This category reports on boot failures, operating system crashes, and
sleep failures.
■ Miscellaneous failures This category reports on any unexpected shutdowns of the system.
■ System clock changes This category reports on any changes to the system clock on the
server. This category will not appear in the System Stability Report unless a day is
selected on which a significant clock change occurred. An information icon will appear
on the graph for any day that a significant clock change has taken place.
Note
You can open a stand-alone version of the Reliability Monitor by typing perfmon /rel
in the Start Menu.
Overall system stability can be determined by viewing either the System Stability Chart or by
reviewing a variety of System Stability Reports. The System Stability Chart displays a daily stabil-
ity index rating between 1 and 10. A rating of 10 indicates a stable system; a rating of 1 indicates a
very unstable system. As you highlight a specific day within the chart, you can view the average
index and obtain detailed information from the reports located at the bottom of the details pane.
As shown in Figure 14-3, the highlighted date has an index of 8.81, which indicates a less stable
system when compared to previous days registered in the System Stability Chart. A warning
indicator is displayed for the Software (Un)Installs category, and error indicators are displayed
for the Application Failures and Miscellaneous Failures categories. The System Stability Report
section shows the details related to the errors experienced on this specific day.
Figure 14-3 Viewing Reliability Monitor data.
Chapter 14: Monitoring and Maintaining Active Directory 559
Note The Reliability Monitor needs to collect 24 hours of data before it calculates the
System Stability index or generates information for the System Stability Report.
Overview of Data Collector Sets and Reports
Windows Server 2008 (as well as Windows Vista) introduces the concept of Data Collector
Sets. A Data Collector Set may contain multiple data collection points (called data collectors) to
form a single configurable component. This component can then be configured to provide set-
tings such as scheduling for the entire data collection set, security for running or viewing the
data collection set, and running specific tasks after the Data Collector Set stops gathering
information.
A Data Collector Set can contain many different types of data collectors:
■ Performance counters Used to log data related to system performance. You can add the
same counters that are used to display real-time data in the Performance Monitor.
■ Event trace data Used to log information based on system and application-based
events. Event trace providers are typically installed with the operating system. They can
also be provided by application vendors.
■ System configuration information Used to log information related to the configuration
and changes to registry keys. You will need to know exactly which registry keys you
want to include in the Data Collector Set to be monitored.
■ Performance counter alerts Used to configure an alert event for when a specific perfor-
mance counter meets or exceeds a specified threshold. For example, you can configure
an alert to perform an alert action or task whenever the % Free Space on a drive is below
20%. An alert action can be as simple as just logging an entry in the application event
log, or it can start a subsequent Data Collector Set to provide additional monitoring or
tracing capabilities. You may also configure an Alert Task to run a specific application
when the alert is triggered, such as an e-mail notification or administrative utility. Note
that this option is available when you manually create a Data Collector Set.
The Data Collector Sets node is located in the Reliability And Performance Monitor and con-
sists of four containers used to store different types of Data Collector Sets:
■ User Defined This container allows you to create and store custom Data Collector Sets
either manually or from predefined templates.
■ System Depending on the server roles added to the server, this container stores default
system-based Data Collector Sets used to provide Active Directory Diagnostics, LAN
Diagnostics, System Diagnostics, or System Performance. These cannot be modified
directly, but they can be used as a template to create a new User Defined Data
Collector Set.
560 Part IV: Maintaining Windows Server 2008 Active Directory
■ Event Trace Sessions Used to store Data Collector Sets based on enabled event trace
providers.
■ Startup Event Trace Sessions Used to store Data Collector Sets containing event trace
providers used to monitor startup events.
Figure 14-4 provides an illustration of a User Defined Data Collector Set. This specific Data
Collector Set contains two data collectors used to collect baseline performance for various
counters and NT kernel trace data.
Figure 14-4 Viewing a User Defined Data Collector Set.
The following steps outline how to create a Data Collector Set:
1. From the Reliability And Performance Monitor, right-click User Defined, point to New,
and then click Data Collector Set.
2. Provide a Name for the Data Collector Set and specify if you are going to create from a
template or create the Data Collector Set manually.
3. If you choose to use a template, you can select a template based on the System Data Col-
lector Sets, or you can click Browse and select a preconfigured XML-based template.
4. If you choose to create a new Data Collector Set manually, you can select which types of
data logs you want to include (performance counter, event trace data, or system config-
uration information). You can also choose to create a Performance Counter Alert.
Depending on which options you select, you will have specific configuration pages for
each data log type.
5. Choose a location on where you would like to save the new Data Collector Set. By
default, it is saved at %systemdrive%\PerfLogs\Admin\.
6. Specify the account to be used to run the Data Collector Set. By default, Data Collector
Sets run as the System user.
Chapter 14: Monitoring and Maintaining Active Directory 561
7. Click Finish to return to the Reliability And Performance Monitor console.
8. Right-click the Data Collector Set and then click Properties to modify the settings for the
entire collection. For example, you may want to specify a schedule or a stop condition to
stop the data collection after a specific amount of time.
9. To start the Data Collector Set, right-click on the Data Collector Set and then click Start.
The data collectors within the set begin to collect information as configured. When the
data collection duration is complete, a report is also automatically generated and placed
under the Reports node, as shown in Figure 14-5.
Figure 14-5 Report results of a data collection task.
How to Monitor Active Directory
Reliability And Performance Monitor exposes a variety of Active Directory counters and trace
events that can be used to achieve effective system monitoring. The Active Directory monitor-
ing process consists of tracking these key performance indicators and comparing them to a
baseline condition that represents the service operating within normal parameters. The differ-
ences between the current monitoring results compared to the initial baseline values will help
you determine current or potential issues related to your directory service.
As mentioned previously, a Data Collector Set can also contain Performance Counter Alerts.
When a performance counter exceeds a specified performance threshold, an alert can be con-
figured which notifies the network administration (or the monitoring operator, in the case of
large organizations) of the condition. Exceeding the performance threshold can also initiate
562 Part IV: Maintaining Windows Server 2008 Active Directory
an automatic action configured within the Data Collector Set to remedy the problem or to
minimize any further deterioration of performance or system health.
The following is a high-level outline of the Active Directory monitoring process:
1. Determine which data collectors you need to monitor and the metrics that are required
within your organization. This will include performance counters, trace information,
and registry settings. Your organization’s SLA is a good start for providing information
on expected metrics and thresholds for the performance indicators.
2. Create a Data Collector Set that includes all of the data collectors that are required.
3. Run the Data Collector Set to establish and document your baseline performance level.
4. Determine your thresholds for these performance indicators. (In other words, deter-
mine at what level you will need to take action to prevent a disruption of service.)
5. Design the necessary alert system to process a threshold hit. Your alert system should
include:
❑ Operator notifications
❑ Automatic actions, if appropriate
❑ Operator-initiated actions
6. Design a reporting system to capture historical data on Active Directory system health.
You can use the Reports node to contain reports based on the date that the Data Collec-
tor Set was run.
7. Implement your monitoring solution to measure performance of these key indicators on
a schedule that reflects the variability of these indicators and the impact that each indi-
cator has on Active Directory health.
The rest of this section examines the details of the monitoring process.
Establishing the Baselines and Thresholds
After you have identified which data collectors and performance counters you need to monitor,
you should gather baseline data for these indicators by creating and running a baseline Data
Collector Set. The baseline data collection set represents each type of data collector performing
within normal limits of operation. The “normal limits” should include both the low and high
values that are expected for a particular performance counter or trace event. To capture the most
accurate baseline data, you should collect performance information over a sufficient period of
time to reflect the range of values for a particular parameter during high and low activity. For
example, if you are establishing the baseline for authentication request performance, be sure to
monitor that indicator during the period when most of your users are logging on.
As you determine your baseline values, document this information and date the version of
the document you create. In addition to being used for setting thresholds, these values will be
Chapter 14: Monitoring and Maintaining Active Directory 563
useful for identifying performance trends over time. A spreadsheet formatted with columns
for low, average, and high values for each counter, as well as thresholds for alerts, is well-suited
for this purpose.
Note
When your Active Directory environment changes (for example, if the number of users
increases or hardware changes are made to domain controllers), reestablish your baselines. The
baseline should always reflect the most current snapshot of Active Directory running within
normal performance limits. An outdated baseline is not useful for analyzing current perfor-
mance data.
After you have determined the baseline, next determine the threshold values that should gen-
erate an alert or event task. Apart from the recommendations made by Microsoft, there is no
magic formula for determining threshold values. Because every situation is different, you will
need to determine, based on your network infrastructure, what performance level indicates
that a performance counter is trending toward service interruption. In establishing your
thresholds, start conservatively. (Use values recommended by Microsoft or even lower val-
ues.) As a result, you will process a large number of alerts. As you gather more data about the
counter, you can raise the threshold to reduce the number of alerts. This process might take
several months, but it will eventually be fine-tuned for your particular implementation of
Active Directory.
It is essential that you have a game plan in place for how you will respond to an alert. As you
define your counters, baseline, and threshold values, be sure to document the remedial action
you will perform to bring the indicator back within normal limits. This action might involve
troubleshooting an error condition (for example, bringing a domain controller back online)
or transferring an operations master role. If your system has reached its maximum capacity,
you might have to add disk space or memory to correct the condition. Other alerts will trigger
you to perform Active Directory maintenance, such as defragmenting the Active Directory
database file. Such situations are discussed later in this chapter, in the section titled “Offline
Defragmentation of the Active Directory Database.”
Performance Counters and Thresholds
The following tables list key performance counters and threshold values that are helpful for
monitoring and logging Active Directory performance. Keep in mind that every enterprise
environment will have unique characteristics that will affect the applicability of these values.
Consider these thresholds as a starting point and refine these values to reflect the needs and
requirements for your environment.
Active Directory Performance The performance counters listed in Table 14-1 monitor the
core Active Directory functions and services. Thresholds are determined by baseline monitor-
ing unless otherwise indicated. These counters can be added to the Performance Monitor to
provide real-time data, or you can add a Performance Counter data collector or a Performance
564 Part IV: Maintaining Windows Server 2008 Active Directory
counter alert to a Data Collector Set to provide Active Directory performance logging and alert
capabilities.
Table 14-1 Core Active Directory Functions and Services
Object Counter Interval
Why Counter Is
Important
DirectoryServices/NTDS DS Search sub-
operations / sec
Every
15 minutes
Subtree search requests
are very system-resource
intensive. Any significant
increase can indicate
domain controller perfor-
mance problems. Check
to see if applications are
incorrectly targeting this
domain controller.
Process % Processor Time
(Instance=lsass)
Every
1 minute
This counter indicates the
percentage of CPU time
being used by the Active
Directory service.
DirectoryServices/NTDS LDAP Searches / sec Every
15 minutes
This counter is a good
indicator for the amount
of overall use a domain
controller is getting. Ide-
ally, this counter should
be fairly uniform across
the domain controllers.
An increase in this counter
might indicate that a new
application is targeting
this domain controller or
that more clients were
added to the network.
DirectoryServices/NTDS LDAP Client Sessions Every
5minutes
This counter indicates
the number of clients
currently connected to
the domain controller. A
significant increase might
indicate that other ma-
chines are failing over to
this domain controller.
Trending this counter can
also provide useful infor-
mation as to what time of
day people are connect-
ing and the maximum
number of clients
connected per day.
Chapter 14: Monitoring and Maintaining Active Directory 565
Process Private Bytes
(Instance=lsass)
Every
15 minutes
This counter is good for
trending memory needs
by domain controllers.
A continuously growing
counter indicates either
increased workstation
demand, applications
misbehaving (not closing
handles), or increased
number of workstations
targeting this domain
controller. When this
counter significantly
deviates from the normal
value of other peer
domain controllers,
you should investigate
the source of this
demand.
Process Handle Count
(Instance=lsass)
Every
15 minutes
This trending statistic
is useful for seeing if
applications are misbe-
having and not closing
handles properly. This
counter will increase
linearly as client
workstations are added.
Process Virtual Bytes (In-
stance=lsass)
Every
15 minutes
This counter can be used
to determine if Active
Directory is running low
on virtual memory
address space, which
might indicate a memory
leak. Verify that you are
running the latest service
pack, and schedule a
reboot during off hours
to avoid a system outage.
This counter can be used
to determine if less than
2 gigabytes (GB) of
virtual memory remains
available.
Table 14-1
Core Active Directory Functions and Services (continued)
Object Counter Interval
Why Counter Is
Important
566 Part IV: Maintaining Windows Server 2008 Active Directory
Replication Performance Counters The performance counters discussed in Table 14-2
monitor the quantity of replicated data. Thresholds are determined by the baselines you
established earlier, unless otherwise indicated.
Table 14-2 Replication Performance Counters
Object Counter
Recommended
Interval
Why Counter Is
Important
DirectoryServices/NTDS DRA Inbound
Bytes Compressed
(Between Sites, After
Compression) / sec
Every 15 minutes Indicates the amount of
replication data flowing
to this site. A significant
change in the counter
indicates a replication
topology change or
that significant data was
added or changed in
Active Directory.
DirectoryServices/NTDS DRA Outbound
Bytes Compressed
(Between Sites, After
Compression) / sec
Every 15 minutes Indicates the amount of
replication data flowing
out of this site. A signif-
icant change in the
counter indicates a
replication topology
change or that signifi-
cant data was added or
changed in Active
Directory.
DirectoryServices/NTDS DRA Outbound
Bytes Not
Compressed
Every 15 minutes Indicates the amount
of replication data
outbound from this do-
main controller, but to
targets within the site.
DirectoryServices/NTDS DRA Outbound
Bytes Total / sec
Every 15 minutes Indicates the amount
of replication data
outbound from this
domain controller.
A significant change in
the counter indicates a
replication topology
change or that signifi-
cant data was added
or changed in Active
Directory. This is a very
important performance
counter to watch.
Chapter 14: Monitoring and Maintaining Active Directory 567
Security Subsystem Performance The performance counters listed in Table 14-3 monitor
key security volumes. Thresholds are determined by baseline monitoring unless otherwise
indicated.
Core Operating System Performance The performance counters listed in Table 14-4
monitor core operating system indicators and have a direct impact on Active Directory
performance.
Table 14-3 Key Security Volumes
Object Counter
Recommended
Interval
Why Counter Is
Important
Security System-Wide
Statistics
NTLM Authentications Every 15 minutes Indicates the number of
clients per second
authenticating against
the domain controller
using NTLM instead of
Kerberos (pre–Windows
2000 clients or interfor-
est authentications).
Security System-Wide
Statistics
KDC AS Requests Every 15 minutes Indicates the number of
session tickets per sec-
ond being issued by the
Key Distribution Center
(KDC). This is a good in-
dicator to use to observe
the impact of changing
the ticket lifetime.
Security System-Wide
Statistics
Kerberos
Authentications
Every 15 minutes Indicates the amount of
authentication load
being put on the KDC.
This is a very good
indicator to use for
trending purposes.
Security System-Wide
Statistics
KDC TGS Requests Every 15 minutes Indicates the number of
Ticket-Granting Tickets
(TGTs) being issued by
the KDC. This is a good
indicator to use to
observe the impact of
changing the ticket
lifetime.
568 Part IV: Maintaining Windows Server 2008 Active Directory
Table 14-4 Core Operating System Indicators
Object Counter Interval Threshold
Significance When the
Threshold Value Is
Exceeded
Memory Page Faults / sec Every
5 minutes
700 / second High rate of page faults
indicates insufficient
physical memory.
PhysicalDisk Current Disk
Queue Length
Every
1 minute
2 Averaged over
3intervals
Monitor volumes con-
taining the Ntds.dit file
and the .log files. This
counter indicates that
there is a backlog of
disk I/O requests.
Consider increasing
disk and controller
throughput.
Processor % DPC Time
(Instance=_Total)
Every
15 minutes
10 Indicates work that was
deferred because the
domain controller was
too busy. Exceeding
the threshold value
indicates possible
processor congestion.
System Processor Queue
Length
Every
1 minute
6 Averaged over
5intervals
The CPU is not fast
enough to process
requests as they occur.
If the replication
topology is correct and
the condition is not
caused by failover
from another domain
controller, consider
upgrading CPU.
Memory Available MBytes Every
15 minutes
4 megabytes (MB) Indicates system has
run out of available
memory. Imminent
service failure is
likely.
Processor % Processor Time
(Instance=_Total)
Every
1 minute
85% Averaged
over 3 intervals
Indicates CPU is
overloaded. Determine
if CPU load is being
caused by Active
Directory by examining
the Process object,
% Processor Time
counter, lsass instance.
Chapter 14: Monitoring and Maintaining Active Directory 569
Monitoring Active Directory with Event Viewer
In addition to using the Reliability And Performance Monitor to monitor Active Directory, you
should also review the contents of the event logs by using the Event Viewer administrative
tool. By default, the Event Viewer displays the following five logs:
■ Application Contains events logged by applications or programs.
■ Security Contains events such as valid and invalid logon attempts, as well as events
related to resource use such as creating, opening, or deleting files or other objects.
■ Setup Contains events logged by the operating system and applications during
setup.
■ System Contains events logged by Windows system components.
■ Forwarded Events Used to store events collected from other remote computers. In
order to collect events from remote computers, you must configure a subscription.
In addition, for servers running Windows Server 2008 configured as domain controllers, the
following event logs will be displayed under the Applications and Services Logs node of the
Event Viewer:
■ Directory Service Contains events logged by Active Directory.
■ DFS Replication Contains events logged by the Distributed File System. This log will
provide information related to SYSVOL replication.
If the Windows Server 2008 domain controller is a DNS server as well, the following log will
also be displayed:
■ DNS Server Contains events logged by the DNS Server service.
System Context
Switches / sec
Every
15 minutes
70,000 Indicates excessive
transitions. There
might be too many
applications or services
running, or their load
on the system is too
high. Consider offload-
ing a portion of this
demand.
System System Up Time Every
15 minutes
Essential counter for
measuring domain
controller reliability.
Table 14-4
Core Operating System Indicators (continued)
Object Counter Interval Threshold
Significance When the
Threshold Value Is
Exceeded
570 Part IV: Maintaining Windows Server 2008 Active Directory
To view the event logs, click Event Viewer from the Administrative Tools folder. Select the
event log for the service you want to monitor. The left pane of Figure 14-6 shows all the event
logs for a domain controller running Windows Server 2008 that is also a DNS server.
Figure 14-6 The Event Viewer administrative tool with event logs.
From the event log, review the event types for Errors and Warnings. To display the details of
an event in the log, double-click the event. Figure 14-7 shows the details of a Warning event
(Event ID 2886) from the Directory Service log.
Figure 14-7 The Event Properties sheet for an event log entry.
Chapter 14: Monitoring and Maintaining Active Directory 571
What to Monitor
For monitoring the overall system health of Active Directory, you should monitor service-
related performance and server-related performance indicators. You must ensure that Active
Directory and the domain controllers on which it is running are performing optimally. When
designing your monitoring solution, plan to monitor the following performance areas:
■ Active Directory service These performance indicators are monitored using the
Directory Service counters and trace events in the Reliability And Performance Monitor.
■ Active Directory replication Replication performance is essential to ensuring that data
integrity across the domain is being maintained.
■ Active Directory database storage The disk volumes that contain the Active Directory
database file Ntds.dit and the .log files must have enough free space to allow normal
growth and operation.
■ DNS performance and server health Because Active Directory relies on DNS as a service
locator, the DNS server and service must be operating within normal limits for Active
Directory to meet its service-level requirements.
■ File Replication Service (FRS) and the Distributed File System Replication (DFSR) The
FRS must be running within normal limits to ensure that the shared system volume
(SYSVOL) is replicating throughout the domain. If you are running in Windows Server
2008 functional mode, you can use DFSR for SYSVOL replication. This also has to be
monitored to ensure proper performance.
■ Domain controller system health Monitoring for this area should cover overall server
health, including memory counters, processor utilization, and paging. You must also
ensure that the appropriate time and time zone settings are synchronized between all
servers, which is critical for replication and proper authentication.
■ Forest health This area should be monitored to verify trusts and site availability.
■ Operations masters and global catalog roles For each Operations Master role, monitor
to ensure server health. Also monitor to ensure global catalog availability to enable user
logon and universal group-membership enumeration.
Direct from the Source: Monitoring Active Directory, Part II
Monitoring Active Directory can be a vast subject to investigate. As explained previously,
monitoring Active Directory in a holistic way is critical. Therefore, even though in this
chapter we focus on the Active Directory exposed information, there is a collection of
things in Windows that are peripheral to Active Directory that are worth monitoring as
well. In doing so, you will be able to track the general health state of the Active Directory
ecosystem. For instance, this includes time synchronization to avoid time lags more
than five minutes between Domain Controllers (if it is more than five minutes, the
discrepancy can invalidate the Kerberos ticket and prevent Domain Controllers—and
572 Part IV: Maintaining Windows Server 2008 Active Directory
users—from being able to authenticate). You may also want to monitor Active Directory
essential services such as NTFRS, DFSR, and KDC W32Time. These services all provide
support to or depend on Active Directory, and they are critical in the overall health of
the Active Directory ecosystem. Other more general aspects such as the disk space on
the system disk and the Active Directory database size are also good things to track.
Something that people often do not monitor, but which can be useful in some
circumstances—especially with very large Active Directory infrastructures—is the KCC
CPU utilization. The KCC is the Knowledge Consistency Checker, and it is in charge of
validating and building the Active Directory topology by creating the required connec-
tion objects. Although the performance of the KCC has been dramatically improved
since Windows 2000, it could be interesting to monitor the CPU usage of the KCC on
your domain controllers, especially the ones located in the hubs of your Active Directory
infrastructure.
You can detect the KCC activity simply by changing the KCC diagnostic level to 3. To
do this, set the “1 Knowledge Consistency Checker” registry key value to 3. The registry
key is located in the HKLM\ SYSTEM\CurrentControlSet\Services\NTDS\Diagnostics
registry hive. After it is set to 3, the KCC creates Event Log entries in the Directory
Service Event Log each time it triggers. Events 1009 and 1013 with the NTDS KCC
source name show the KCC start time and stop time, respectively. Then you can track
the CPU usage at the same time and see how the KCC impacts the CPU during its
execution. This can be useful to split the load between servers calculating the topology
and the ones handling authentication requests, for instance.
In conclusion, when monitoring Active Directory, think about the big picture. This
will avoid a lot of side effects and surprises, because you will become accustomed to
working with the Active Directory ecosystem as a whole, and not with one software
component at the time.
Alain Lissoir
Senior Program Manager
Active Directory—Connected System Division
Monitoring Replication
If you have more than one domain controller in your organization, one of the most critical
components that you need to monitor is Active Directory replication. Replication between
domain controllers is most commonly monitored with administrative tools such as
Repadmin.exe, Dcdiag.exe, and the Directory Service log (described earlier with the
Event Viewer).
Chapter 14: Monitoring and Maintaining Active Directory 573
Repadmin is a command-line tool that reports failures on a replication link between two
replication partners. The following command displays the replication partners and any repli-
cation link failures for the DC1 domain controller in the Contoso.com domain:
repadmin /showrepl dc1.contoso.com
Dcdiag is a command-line tool that can check the DNS registration of a domain controller,
check to see that the security identifiers (SIDs) on the naming context (NC) heads have
appropriate permissions for replication, analyze the state of domain controllers in a forest or
enterprise, and more. For a complete list of Dcdiag options, type dcdiag /?. The following
command checks for any replication errors between domain controllers:
dcdiag /test:replications
Finally, the Directory Service log reports replication errors that occur after a replication link
has been established. In particular, you should review the Directory Service log for any repli-
cation event where the event type is an Error or a Warning. The following are two examples of
common replication errors as they are displayed in the Directory Service log:
■ Event ID 1311 The replication configuration information in the Active Directory Sites
And Services administrative tool does not accurately reflect the physical topology of the
network. This error indicates that either one or more domain controllers or bridgehead
servers are offline, or that the bridgehead servers do not host the required NCs.
■ Event ID 1265 (Access denied) This error can occur if the local domain controller failed
to authenticate against its replication partner when creating the replication link or when
trying to replicate over an existing link. This error typically happens when the domain
controller has been disconnected from the rest of the network for a long time and its
computer account password is not synchronized with the computer account password
stored in the directory of its replication partner.
Direct from the Source: Monitoring Active Directory Replication
Monitoring Active Directory replication can be achieved in several ways. As described in
this section, you can validate the configuration to ensure that Active Directory meets all
required conditions to replicate properly. As described, you can determine this by using
tools like Dcdiag. This would be more a proactive verification in which you would mon-
itor before encountering any trouble. However, you can also monitor the Active Direc-
tory replication “after the fact” by checking any faults in the replication activities. You
can achieve the latter type of monitoring by verifying reported events in the event log or
specific replication failures with REPADMIN.
One additional way to validate the Active Directory replication is by reading some
shared settings in an Active Directory domain controller, such as the FSMO roles. If
everything looks fine, the FSMO roles reported for a given domain in a given forest
574 Part IV: Maintaining Windows Server 2008 Active Directory
should always be the same for all domain controllers within that given domain and
forest. If you collect this information at the level of each domain controller and report it
centrally (i.e., by dumping the collected results in a share), the FSMO role reported by all
domain controllers can easily be compared. Any inconsistency in the FSMO role reported
will surface a replication issue for the domain controller reporting different results.
Last but not least, a good way to monitor the Active Directory replication can be based
on change injection. This technique involves updating a given and dedicated AD object
for the purpose of the replication monitoring. For example, you can write an ADSI-based
script that modifies an AD object in a selected domain controller. (The script could be
executed regularly within the context of the Task Scheduler.) The modification may
simply consist of a write operation of a date and a time in a string attribute like the
description of a user object, for example. Because Active Directory replicates this type of
change automatically, it is expected to see this information refreshed in all other Active
Directory domain controllers at some point. Meanwhile, all these other domain control-
lers could regularly run a complementary script that reads this same object and compare
the description attribute date/time with the value of the whenChanged attribute.
In doing so, this last script can determine two things: First, it can determine that the last
change expected is successfully replicated (description attribute containing an updated
date/time). Next, it can calculate the time it took for this replication change to occur by
determining the time difference between the description attribute containing the original
date/time write and the date/time contained in the whenChanged attribute. This will
allow you to determine what is called the replication latency of the directory. More than
confirming that replication works, the replication latency will tell you if your Active
Directory design and infrastructure meet your expectation in terms of replication
change speed, which is something you usually express during the Active Directory
design time as a requirement. Therefore, it is also a good way to validate your design
choices and maybe take some actions to meet your replication SLA.
Of course, this monitoring requires some scripting. You can refer to the white paper
section of my Web site at to acquire some ADSI script-based
samples to create your own scripts to achieve this.
In addition, the Microsoft Active Directory Management Pack for Microsoft Operations
Manager (MOM) 2005 and Operations Manager 2007 implements exactly this logic and
leverages MOM to consolidate and compare the results collected across all domain
controllers in your forest to determine the replication latency.
Alain Lissoir
Senior Program Manager
Active Directory—Connected System Division
Chapter 14: Monitoring and Maintaining Active Directory 575
Active Directory Database Maintenance
One of the important components of managing Active Directory is maintaining the Active
Directory database. Under normal circumstances, you will rarely manage the Active Directory
database directly, because regular automatic database management will maintain the health of
your database in all but exceptional situations. These automatic processes include an online
defragmentation of the Active Directory database as well as a garbage collection process to
clean up deleted items. For those rare occasions when you do need to directly manage the
Active Directory database, Windows Server 2008 provides the Ntdsutil tool.
Garbage Collection
One of the automatic processes used to maintain the Active Directory database is garbage col-
lection. Garbage collection is a process that runs on every domain controller every 12 hours.
During the garbage collection process, free space within the Active Directory database is
reclaimed.
The garbage collection process starts by first removing tombstones from the database.
Tombstones are the remains of objects that have been deleted from Active Directory. When an
object such as a user account is deleted, the object is not immediately deleted. Rather, the
isDeleted attribute on the object is set to true, the object is marked as a tombstone, and most of
the attributes for the object are removed from the object. Only a few attributes required to
identify the object are retained, such as the globally unique identifier (GUID), the SID, the
update sequence number (USN), and the distinguished name. This tombstone is then replicated
to other domain controllers in the domain. Each domain controller maintains a copy of the
tombstoned object until the tombstone lifetime expires. By default, the tombstone lifetime is
set to 180 days. The next time the garbage collection process runs after the tombstone has
expired, the object is deleted from the database.
After deleting the tombstones, the garbage collection process deletes any unnecessary trans-
action log files. Whenever a change is made to the Active Directory database, it is first written
to a transaction log and then committed to the database. The garbage collection process
removes all transaction logs that do not contain any uncommitted transactions.
As mentioned, the garbage collection process runs on every domain controller at 12-hour
intervals. You can modify this interval by changing the garbageCollPeriod attribute. To modify
this setting, you can use Adsiedit.msc. Open ADSI Edit from the Administrative Tools
menu and then connect to the Configuration naming context. You can then expand
CN=Configuration, expand CN=Services, expand CN=Windows NT, and then select
CN=Directory Service. Right-click CN=Directory Service and then locate the garbageCollPeriod
attribute and configure the value to meet your requirements. In most cases, you should not
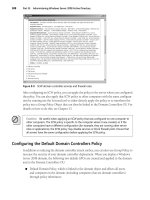
have to modify this setting. Figure 14-8 shows this attribute in ADSI Edit.
576 Part IV: Maintaining Windows Server 2008 Active Directory
Figure 14-8 The garbageCollPeriod attribute in ADSI Edit.
Online Defragmentation
The final step in the garbage collection process is an online defragmentation of the Active
Directory database. This online defragmentation frees up space within the database and rear-
ranges the storage of Active Directory objects within the database to improve the efficiency of
the database. The online defragmentation is necessary because of the process Active Directory
uses when manipulating objects in the database.
During normal operation, the database system for Active Directory is optimized to be able to
make changes to the Active Directory database as quickly as possible. When an object is
deleted from Active Directory, the database page where the object is stored is loaded into the
computer memory and the object is deleted from the page. As objects are added to Active
Directory, they are written to database pages without consideration for optimizing the storage
of that information for later retrieval. After several hours of committing changes to the
database as fast as possible, the storage of the data in the database might not be optimized.
For example, the database might contain empty pages where objects have been deleted, there
might be many pages with some deleted items, or Active Directory objects that should
logically be stored together might be stored on many different pages throughout the database.
The online defragmentation process cleans up the database and returns the database to a
more optimized state. If some of the entries on a database page have been deleted, entries
from other pages might be moved onto the page to optimize the storage and retrieval of
information. Objects that should logically be stored together because they will be displayed
together are moved onto the same database page or onto adjacent pages. One of the limita-
tions of the online defragmentation process is that it does not shrink the size of the Active
Directory database. If you have deleted a large number of objects from Active Directory,
Chapter 14: Monitoring and Maintaining Active Directory 577
the online defragmentation process might create many empty pages in the database as it
moves objects around in the database. However, the online defragmentation process cannot
remove these empty pages from the database. To remove these pages, you must use an offline
defragmentation process.
The online defragmentation process runs every 12 hours as part of the garbage collection
process. When the online defragmentation process is complete, an event is written into the
Directory Service log indicating that the process has completed successfully. Figure 14-9
shows an example of this event log message.
Figure 14-9 A Directory Service log message indicating a successful online defragmentation.
Offline Defragmentation of the Active Directory Database
As mentioned previously, the online defragmentation process does not shrink the size of the
Active Directory database. Under normal circumstances, this is not a problem because the
database pages that are cleaned up during the online defragmentation are just reused as new
objects are added to Active Directory. However, in some cases, you might want to use offline
defragmentation to shrink the overall size of the database. For example, if you remove the glo-
bal catalog from a domain controller, you should run an offline defragmentation on the data-
base to clean up the space used in the database to store the GC information. This need for an
offline defragmentation is especially true in a multiple-domain environment where the GC
can become very large. You might also want to use offline defragmentation if you have
removed a large number of objects from the Active Directory domain.
To run offline defragmentation, perform the following steps:
1. Back up the Active Directory information on the domain controller. This process is
described in Chapter 15, “Active Directory Disaster Recovery.”
578 Part IV: Maintaining Windows Server 2008 Active Directory
2. For Windows Server 2008 Domain Controllers, open the Services console and stop the
Active Directory Domain Services service and all related services as prompted (or
type net stop ntds at a command prompt).
Note
For Windows Server 2000/2003, reboot the domain controller. As the server
reboots, press F8 to display the Advanced Boot Options and then choose Directory
Services Restore Mode. After the server reboots, log on using the local Administrator
account. Use the password that you entered as the Directory Services Restore Mode
password when you promoted the domain controller.
3. Open a command prompt and type ntdsutil.
4. From the Ntdsutil prompt, type Activate Instance NTDS.
5. From the Ntdsutil prompt, type files.
6. From the File Maintenance prompt, type info. This option displays current information
about the path and size of the Active Directory database and its log files.
7. Type compact to drive:\directory. Select a drive and directory that have enough space to
store the entire database. If the directory path name contains any spaces, the path
must be enclosed by quotation marks.
8. The offline defragmentation process creates a new database named Ntds.dit in the path
you specified. As the database is copied to the new location, it is defragmented.
9. When the defragmentation is done, type quit twice to return to the command prompt.
10. Copy the defragmented Ntds.dit file over the old Ntds.dit file in the Active Directory
database path and delete the old log files.
11. Restart the domain controller.
Note
If you are defragmenting the database because you have deleted a large number of
objects from Active Directory, you must repeat this procedure on all domain controllers.
Managing the Active Directory Database Using Ntdsutil
In addition to using Ntdsutil to defragment your Active Directory database while offline,
you can use it to manage the Active Directory database in several other ways. The Ntdsutil
tool can be used to perform several low-level Active Directory database recovery tasks.
The database recovery options are all nondestructive—that is, the recovery tools will try to
correct a problem with the Active Directory database, but they will never do so at the
expense of deleting data.