Báo cáo lâm nghiệp: "Addressing spatial variability in provenance experiments exemplified in two trials with black spruc" pps
Bạn đang xem bản rút gọn của tài liệu. Xem và tải ngay bản đầy đủ của tài liệu tại đây (794.33 KB, 10 trang )
J. FOR. SCI., 53, 2007 (2): 47–56 47
JOURNAL OF FOREST SCIENCE, 53, 2007 (2): 47–56
Most variety trials utilize complete or incomplete
block designs and are analyzed with the traditional
analysis of variance (ANOVA). e last decade of the
20
th
century saw major improvements in the options
available for the analysis of field trials. Experience
with many analyses lead to the realization that spatial
variation has multiple sources and classical field de-
signs often fail to do justice to the spatial variability
(C et al. 2000). ough forest genetic trials
are similar to agricultural variety field trials, there
are a number of differences. Forestry trials are often
much larger because of the large size of individual
plants and the higher replication needed to achieve
satisfactory family estimates (D et al.
2002). e size of forestry trials is also magnified
by including large numbers of genetic entries (e.g.
clones, provenances), often leading to inefficient
blocking due to large site heterogeneity within
blocks. Further, individual trees are usually regarded
as uncorrelated to the neighboring ones, although
competition among them is supposed to be more
important than inter-plot competition in variety tri-
als. e most common type of experimental design
in provenance research is the randomized block de-
sign. More recently, spatial analytical methods have
been used to study patterns of site variation (F et al.
1999) and have been shown to improve the precision
of estimated effects for provenances (H et al.
2002), or clones (C E S et al. 2001) in forest
tree breeding trials.
Recently, a number of statistical approaches be-
came available to ordinary users due to emerging
increase in the power of personal computers. As
a result, mixed models can be implemented with
properly declared factors having either fixed or
random effects. Further, it is possible to investigate
various error correlation structures in the supplied
data. Local or global trends in site variability can be
efficiently strained away through their proper dec-
laration in the statistical model. e main objective
of classical provenance trials is to obtain precise es-
timates of provenance means and/or their respective
contrasts. Soil fertility, soil water-holding capacity,
soil physical characteristics and other environmental
Supported by the Higher Education Development Fund at the Ministry of Education, Youth and Sports of the Czech Republic,
Project No. 604/2005, and by the Internal Grant Agency of the Faculty of Forestry and Environment, Project No. 3161/2006.
Addressing spatial variability in provenance experiments
exemplified in two trials with black spruce
T. F, M. L, J. K, I. P, J. K
Faculty of Forestry and Environment, Czech University of Life Sciences in Prague, Prague,
Czech Republic
ABSTRACT: Two exemplary black spruce (Picea mariana [Mill.] B.S.P.) provenance trials were analyzed using tradi-
tional and spatial techniques. e objective was to find out possible differences between these approaches in terms of
both the resulting fit-statistics and the estimated mean heights of provenances. Further, the spatial model was conse-
quently adjusted to treat global and extraneous sources of variation. As expected, models incorporating spatial variation
provided a better fit to the data. Consequently, there was also a noticeable shift in ranking of individual provenances,
which has an important implication for the interpretation of provenance experiments results. Problems associated with
the analysis of traditional randomized block designs in forestry research are discussed.
Keywords: Picea mariana (Mill.); provenance research; REML; spatial variation
48 J. FOR. SCI., 53, 2007 (2): 47–56
factors often vary across an experimental site. Pre-
vious history, irrigation, plot trimming, direction
of cultivation or harvesting are other man induced
sources of variation. e site variability in field trials
can be spatially continuous, reflecting similar pat-
terns in underlying soil and microclimatic effects;
discontinuous, reflecting cultural or measurement
effects; or random, because of micro-environmen-
tal heterogeneity. Spatially continuous variation
may appear as a local trend (patches) or as a global
trend (gradients) over the whole site (D
et al. 2002). Good experimental design can reduce
the impact of some of these factors but unless they
are appropriately included in the statistical model
when they occur, they will result in poor precision
in estimates of variety effects and variety contrasts
(C et al. 2000).
Nevertheless, it is a challenging task to analyze in-
appropriately established provenance experiments.
L et al. (1996) argue that “Spatial analysis is
not a cure-all. Good experimental design is essen-
tial”. Unfortunately, many tree breeding trials do not
utilize more efficient experimental design layouts
and rely on rather simple schemes. Often, the type
II error rate is not considered while the experiment
is established leading to either:
(1) insufficient power of the test, or
(2) very large experiments with inappropriate con
-
trol of the site’s heterogeneity.
The objective of this study is to outline some
methodical problems associated with the statistical
evaluation of provenance experiments. ough the
problems might be considered general, an example
is used in this paper focusing on a provenance test
with black spruce in the Czech Republic. In the
background of this experiment, there is a demand
for alternative forest tree species from between the
1970’s and 1990’s. e choice of tree species for re-
forestation of immission clearings and restoration
of forest stands, especially in the Krušné hory Mts.
(Ore Mountains) and the Jizera Mountains, repre-
sented one of the most difficult tasks in forestry at
that time (V et al. 2003; P et al. 1984).
Exotic spruce and pine species were planted in the
most extreme conditions as a trial solution because
prosperity of native pioneer tree species could not
be granted, often due to damages caused by game
(V et al. 1995). Based on the primary results
from an international test with several exotic spruce
species (evaluation in September 1988), black spruce
was chosen for further investigation. It performed
best from the viewpoint of both growth parameters
and survival, and thus a large provenance test with
this species was established in Central Europe in the
mid 1990’s (K 1998). In this paper, the main
focus was directed at contrasting different conven-
tional and spatial statistical approaches rather than
providing a detailed evaluation of the whole prov-
enance experiment.
MATERIALS AND METHODS
Data sets
In 1995, the Saxon Forest Research Institute in
Graupa, Germany, initiated a large international
provenance test in co-operation with the For-
estry and Game Management Research Institute in
Jíloviště-Strnady, the Czech Republic. 16 provenance
trials were established in the framework of this ex-
periment: 4 trials in Germany, 10 trials in the Czech
Republic, and 2 trials in Slovakia. is test consisted
in total of 42 Canadian black spruce provenances
(provenances 1 to 42), 5 Norway spruce provenances
from Germany (provenances 43 to 47), and local
Norway spruce provenances (48 and above) acting
as the comparative standards. Evaluation of most of
these trials was carried out in late April 2005 at the
age of 13. Height, breast-height diameter, fructifica-
tion, frost damages, and damages caused by wildlife
were measured on every individual tree. e two
provenance trials included in this study were estab-
lished in spring 1995 using three-year-old plantings.
Norway spruce provenances from Germany were
sown in 1991, thus they were one year older.
All of these trials were established in accordance
to the IUFRO methods using randomized complete
block design (RCBD) with four replications. ey
Table 1. Selected parameters of two provenance trials evaluated in the current study
Trial Trial name Area (ha)
Number of
provenances
1
Blocks
2
Rows Columns Shape
Altitude (m
a.s.l.)
1 Přimda 0.72 42-5-3 4 (2) 35 75 rectangle 500
2 Tišnov 0.43 23-0-0 4 (3) 60 80 irregular 370
1
Number of black spruce provenances – provenances of Norway spruce from Germany – local Norway spruce provenances
2
Number of replicates (replicates included in this study in brackets)
J. FOR. SCI., 53, 2007 (2): 47–56 49
consist of plots 6 × 6 m; spacing between individu-
als is 1.2 × 1.2 m. Every plot contains 25 individuals
of one provenance; provenances are represented by
open-pollinated families.
Data were collected in spring 2005. Growth was
measured as height with an accuracy of 1 cm through
the use of a telescopic height-finding lath. Other
recorded traits were not included in this paper. All
dead and missing trees were treated as missing val-
ues. For the purposes of this study, two blocks were
only used out of the original four in the trial #1, while
three blocks were used in the trial #2. e remaining
ones had to be excluded from the analysis owing to
the survival rate of trees being unsatisfactorily low.
Besides, 7 provenances were exempt from the analy-
sis in trial 2 as well due to high standard errors.
Statistical model
e individual tree data from each trial were all
analyzed using several linear mixed models of the
general form
Y = Xβ + Zγ + ε (1)
where: Y – vector of observed values,
β – vector of fixed effects with its design matrix X,
γ – vector of random effects with its design matrix
Z,
ε – a vector of residuals.
e mixed model extends the general linear model
(e.g. procedure GLM in SAS
®
) by allowing a more
flexible specification of the covariance matrix of ε. It is
an unknown random error vector whose elements are
no longer required to be independent and homogene-
ous. In other words, it allows for both correlation and
heterogeneous variances, although one still assumes
normality. e name mixed model comes from the
fact that the model contains both fixed-effects param-
eters, β, and random-effects parameters, γ. To further
develop this notion of variance modelling, assume that
γ and ε are Gaussian random variables that are uncor-
related and have expectations 0 and variances G and
R, respectively. e variance of Y is thus:
V(Y) = ZGZ‘ + R (2)
where: R – variance-covariance matrix of the residuals,
G – direct sum of the variance-covariance matrices
of each of the random effects (SAS
®
Institute Inc.
1999).
Where residuals are supposed to be independent,
R matrix is defined as σ
e
2
I. Spatial analysis allows
the matrix R to have alternative structures based on
the decomposition of ε into two groups of residuals:
spatially dependent (ξ) and spatially independent
(η). Covariance structure used in this study assumed
separable first order autoregressive processes in rows
and columns, for which the R matrix is:
R = σ
ξ
2
[AR1 (ρ
col
) ⊗ AR1 (ρ
row
)] + σ
2
η
I (3)
where: σ
ξ
2
– spatial residual variance,
σ
2
η
– independent residual variance,
I – identity matrix,
AR1(ρ) – stands for a first-order autoregressive
correlation matrix where ρ is the autocorrela-
tion parameter to be estimated from the data
(D et al. 2002).
Original “design” model
Several statistical models were evaluated for each
trial. e aim was to achieve high value of the log-like-
lihood of the fitted model, while controlling standard
errors of the estimates. As a base scenario, a traditional
design model was implemented, in which the original
experimental design features of the trials were fitted.
is model is referred to as the randomized complete
block design (RCBD) with replicates (blocks) having
random effects and provenances having fixed effects.
is design model, in which the residuals were spa-
tially independent, was evaluated using SAS PROC
MIXED (SAS
®
Institute Inc. 1999).
Spatial model
Second set of models allowed the modelling of
spatial patterns in residual variation. e goal was
to reveal possible local and global trends using
autoregressive model (Model AR1) where spatially
independent residuals (η) were omitted, and thus all
the residuals were assumed to be spatially dependent
(ξ). For this analysis, we employed a software pack-
age ASReml
®
(G et al. 2002), which uses the
REML (Restricted Maximum Likelihood) estimation
method to estimate variance components in the
context of mixed linear models. It is a useful tool for
analyzing field variety trials as it allows for the fitting
of spatial variability within field trials in a variety of
ways (C et al. 2000). Sample variograms were
created in order to identify spatial variance patterns
within the two trials. e sample variogram is a plot
of the semi-variances of differences of residuals at
particular distances. It is essentially the complement
of the spatial autocorrelation matrix but it is easier to
view and interpret (G et al. 2002).
Spatial model with additional sources
of variation
Sequential experimental approach to spatial analy-
sis described by C et al. (2000) was followed
50 J. FOR. SCI., 53, 2007 (2): 47–56
next. These authors distinguish between global,
extraneous, and natural variation and propose spe-
cial measures to treat the variation appropriately in
the mixed-model framework. First, global variation
(major trends across the experiment) can be fitted
as linear trends, cubic smoothing splines, row and
column contrasts and covariates. Second, extraneous
variation is a consequence of experimental opera-
tions and may be modelled with random row and
column effects. ird, natural variation arises from
the differences in soil moisture, soil depth, and other
natural causes that are beyond the experimenter’s
control. e natural variation is best characterized
using the autoregressive correlation structure (e.g.
AR1 used in this study). The actual analysis (as
performed in this study) is based on the sequential
evaluation of these sources of variation in variogram.
Based on this procedural graphical output, models
are continuously improved with respect to the ob-
served data. e best model (model “AR1 Adj”) was
selected based upon the evaluation of the variogram
(no variability structure is present other than the
two-dimensional AR1), model REML log-likelihood,
and additional fit measures described by the same
authors. Following the sequential approach, the re-
sulting models considered random row and column
effects (trial #1) and a third-order polynomial (trial
#2). ese models were selected out of the family
of models based on fit criterions described by the
same authors. Simpler models were preferred over
complex ones.
RESULTS
Table 2 provides output from SAS
©
MIXED pro-
cedure for both trials considering the RCBD model.
It is obvious that in both cases the original block
design is inefficient (statistically not significant ef-
fect of blocks at alpha = 0.05). Type III test of fixed
effects revealed that height is significantly affected by
provenances (p value for provenances was lower than
0.0001 in both trails, not shown in the figure).
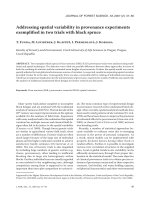
With regards to the fit-statistics, log-likelihood
decreased slightly after processing data with the
AR1 model (Table 3). In the southern part of trial
1, the variogram revealed a conspicuous trough in
site variation in the column direction (Fig. 1, left),
which corresponded to approximately 15 columns.
is phenomenon might be explained by local dif-
ferences in water regime because part of the trial is
waterlogged. Subsequent adjustment of this model
with random effects of columns led to an additional
increase in log-likelihood, which was now relatively
strong. In this case (Fig. 1, right), the resulting vari-
Table 2. Covariance parameters estimates along with standard errors, and the Pr Z value (one- or two-tailed area of the
standard Gaussian density outside of the Z-value)
Covariance parameters Estimate Standard error Pr Z
Trial 1
block 303.52 449.43 0.2497
provenance × block 477.94 148.90 0.0007
residual 4,241.33 143.09 < 0.0001
Trial 2
block 101.72 147.80 0.2457
provenance × block 1,067.43 251.43 < 0.0001
residual 4,370.79 164.45 < 0.0001
Table 3. Fit-statistics
Log-likelihood F-increment
Highest standard
error
Lowest standard
error
Overall SED*
Trial 1
RCB –8,583.44 11.47 24.35 21.90 26.80
AR1 –8,575.49 19.58 16.60 13.08 20.03
AR1 Adj
–8,540.84 26.47 15.76 12.30 18.46
Trial 2
RCB –5,424.65 4.68 12.46 8.30 10.59
AR1 –5,408.04 4.19 14.49 11.47 16.84
AR1 Adj
–5,368.29 5.34 13.33 10.47 15.44
*e overall SED (Standard Error of Difference) is the square root of the average variance of diference between the variety
means. Choosing a model on the basis of smallest SED is not recommended because the model is not necessarily fitting the
variability present in the data (G et al. 2002)
J. FOR. SCI., 53, 2007 (2): 47–56 51
ogram did not show any noticeable gradient as it had
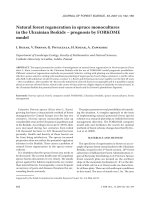
been smoothed away. In trial 2, attempts to flatten the
primary variogram from AR1 (Fig. 2, left) with ran-
dom rows and columns failed to produce a variogram
indicating stationarity. ough the variogram did not
show any gradient, it was quite uneven and contained
a lot of local patches. Fitting the AR1 model with
polynomials increased significantly the value of log-
likelihood as well as F-increment (Fig. 2, right).
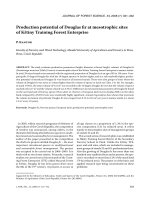
Not only fit-statistics are affected when different
models are used. Predicted mean heights of prov-
enances and their ranking relative to one another for
the three models described in the previous chapter
are provided in Figs. 3–6. ere are a number of
apparent differences between these models. In trial
1 (Přimda), provenance #20 performs the best in all
cases. However, provenance #15 ranked 15
th
in the
RCBD model (predicted mean height 308.05 cm,
standard error 22.18), while it only ranked 29
th
in the
AR1 Adj model (predicted mean height 288.39 cm,
standard error 12.81). e opposite effect took place
in the case of provenance #28, which was mark-
edly underestimated by the RCBD model. Its order
here was 28
th
(289.83 cm, 24.35), while it reached
309.27 cm (15.76) in the AR1 Adj model. Similarly,
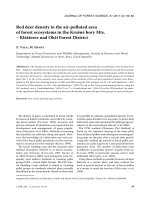
in trial 2, there are also significant differences be-
tween predicted means as well in relative ranking
of provenances. Provenances 11, 20, and 39 seem
to be overrated by RCBD; provenances 42 and mainly
13, on the other side, seem to be underrated.
Outer displacement Inner displacement Outer displacement Inner displacement
0
0
1.226941
1.017714
Fig. 1. Variograms of spatial residuals in trial #1 (Přimda) obtained from AR1 (left), and with AR1 Adj (right)
Outer displacement Inner displacement Outer displacement Inner displacement
0
0
0.216484
0.399899
Fig. 2. Variograms of spatial residuals in trial #2 (Tišnov) obtained from AR1 (left), and with subsequent model-fitting
with polynomials AR1 Adj (right)
52 J. FOR. SCI., 53, 2007 (2): 47–56
240
260
280
300
320
340
360
14 11 33 41 9 20 30 39 31 37 32 36 4 42 18 7 10 12 3 19 1 13 2
Provenance
Predicted mean height (cm)
RCB
AR1 Adj
120
160
200
240
280
320
360
20 6 13 10 25 4 12 15 9 41 27 5 17 36 30 31 32 37 19 1 22 43 44 48 47
Provenance
Predicted mean height (cm)
RCB
AR1 Adj
Fig. 3. Predicted mean heights of provenances in trial 1 (Přimda) according to RCBD and AR1 Adj
Fig. 4. Ranking of provenances relative to one another in trial 1 (Přimda) according to RCBD and AR1 Adj
Fig. 5. Predicted mean heights of provenances in trial 2 (Tišnov) according to RCBD and AR1 Adj
34 26 11 21 14 23 7 8 16 39 42 35 38 28 18 3 40 33 24 29 2 49 50 46 45
Provenance
0
5
10
15
20
25
30
35
40
45
50
20 6 13 10 25 4 12 15 9 41 27 5 17 36 30 31 32 37 19 1 22 43 44 48 47
Provenance
Ranking of provenances
RCB
AR1 Adj
34 26 11 21 14 23 7 8 16 39 42 35 38 28 18 3 40 33 24 29 2 49 50 46 45
Provenance
Provenance
J. FOR. SCI., 53, 2007 (2): 47–56 53
0
5
10
15
20
25
14 11 33 41 9 20 30 39 31 37 32 36 4 42 18 7 10 12 3 19 1 13 2
Provenance
Ranking of provenances
RCB
AR1 Adj
DISCUSSION
e objective of blocking is to make experimental
units (e.g. provenances) as homogeneous as possible
within blocks with respect to the observed variable,
and to make the different blocks as heterogeneous
as possible with respect to the observed variable
(N et al. 1996). In most cases of agricultural field
experiments, the intrablock homogeneity of blocks
containing more than 12 plots occurs only seldom
(S et al. 1994). L et al. (1996) advocate
that randomized block designs should never be used
for experiments with “large” numbers of treatments.
Such a marginal value is likely even smaller in for-
estry, because of a larger spacing between individual
plants. is is in contrary to the number of prov-
enances presented in Table 1. It therefore does not
come as a surprise that blocks do not capture signifi-
cant amount of variation in the observed trait (see Pr
Z value in Table 2) and that alternative models have to
be fitted in order to characterize the data. However,
even a spatial analysis is relatively inefficient on large
randomized block designs (S 2002). Further
complications that arise from this design are:
1. under the excessive block size there is a tendency
for some treatments to be located dispropor-
tionately in relatively good or poor plots and
consequently, some assumptions required by the
model are not met (e.g. no interaction between
treatments and blocks see Table 2 “provenance ×
block”),
2. small number of treatments per block require less
space, leading to more homogeneous conditions
and more likely to constant variance across treat-
ment means; the opposite is true for large number
of treatments in the present study,
3. multiple comparisons (conducted to compare
simultaneously treatment means) are difficult to
handle when large number of pair-wise tests are
requested,
4. number of test plants per treatment are often
planned ad hoc, leading to enormously large ex-
periments. e site of experiment should follow
prospective power calculation to control the prob-
ability of Type II error, combined with a proper
choice of the experimental design.
ere are modern multiple-comparison methods
available within the mixed-model framework. In
the current study, the number of provenances was
too large for performing such a comparison in a
graphically friendly way. e reader should consult
H et al. (this issue) for the demonstration of
these methods under more reasonable number of
treatments.
Based on these results, it is obvious that the tradi-
tional randomized block design does not grant con-
clusive outputs because spatial patterns within trials
are not taken into account (fit statistics in Table 3).
Since tree breeding experiments require much more
space (often more than one hectare) compared to
agricultural variety crop trials, one can assume that
spatial variation plays a significant role in the whole
system. D et al. (2002) advocate an initial
combined model for spatial analysis of forest genetic
trials, which adds an autoregressive error term to the
design model and retains an independent error term.
In most instances in their study, this was a consider-
ably better model. Although not very different from
the alternative models they investigated, it is simple
to apply and does not inflate the additive variance.
Data of C E S et al. (2001) suggest that it
is essential to account for the independent error
Fig. 6. Ranking of provenances relative to one another in trial 2 (Tišnov) according to RCBD and AR1 Adj
Provenance
54 J. FOR. SCI., 53, 2007 (2): 47–56
because it is always present in forestry trials, and,
moreover, it is large. In variety trials with a plot as
the experimental unit, independent error is assumed
to represent measurement error. According to G-
et al. (1997), it is often significant but usually
small if it is modelled. In forestry trials, while meas-
urement error might exist, variation from tree to tree
will also be due to microsite and non-additive genetic
effects (D et al. 2002). Q et al. (2000)
compared the influence of experimental designs
and spatial analyses on the estimation of genotype
effects for yield (33 wheat trials) and their impact
on selection decisions. e relative efficiency of the
alternative designs and analyses was best measured
by the average standard error of difference between
line means. Both more effective designs and spatial
analyses significantly improved the efficiency relative
to the randomized complete block model, with the
preferred model (which combined the design infor-
mation and spatial trends) giving an average relative
efficiency of 138% over all 33 trials. Hence, the use
of these methodologies can impact on the selection
decisions in plant breeding.
is agricultural example can, however, be applied
in forestry trials as well. Figs. 3–6 show that before
individual provenances are selected, models cover-
ing spatial variation should be tested. For instance,
in trial 1, provenances #36 and #28 reached very
similar predicted mean heights based on RCBD;
the relative difference counts for only 1%, thus they
might be regarded to have very similar features.
However, when AR1 is applied, the relative differ-
ence increases to 7% and after subsequent model-
fitting the difference reaches 14%. In other words,
both of these provenances lie nearly in the middle
of the relative ranking (Fig. 3) according to RCBD.
Nevertheless, AR1 moves both of them contrariwise
in the scale, and both predicted means and relative
ranking change significantly. While provenance #36
drops to the worst 15 out of 50, provenance #28 ap-
pears among the best 15. is approach is therefore
certainly worth considering when data from various
tree breeding experiments should be processed.
Although these two provenance trials are too
few to make any decisions regarding selection (the
number of blocks in the first trial is small as well),
these methods can, in general, substantially influ-
ence the selection process and it is the purpose of
this study to point to this phenomenon rather than
making strong inferences about the current trial.
J et al. (2002) analyzed a farm-field test of black
spruce progeny at ages 3–10 with random non-
contiguous single tree plots with spatial techniques
and nearest-neighbours adjustments to evaluate the
effectiveness of used blocking and neighbour adjust-
ments (4, 8 and 12 nearest neighbours) in controlling
the site heterogeneity. ey concluded that their
results, although largely specific to one particular
field test, have some general implication for genetic
testing of black spruce and other forest trees: first,
substantial site heterogeneity could still be found in a
farm-field test, even with extensive site management
and uniformity seemingly observed across a test site;
second, the applied blocking could remove a propor-
tion of a site variation, but application of more effec-
tive field design such as Alpha designs (W,
T 1996; J et al. 2002) may help remove
more site heterogeneity for higher efficiencies of
genetic estimates (F et al. 1998; J et al. 2002);
third, a spatial analysis should not be overlooked for
any farm-field test as it can generate useful informa-
tion for assessing the effectiveness of field layouts in
controlling variation (F et al. 1999). e graphical
outputs from various statistical packages such as
SAS (SAS
®
Institute Inc. 1999) or ASREML, sample
variograms, can serve as a useful diagnostic for as-
sisting with the identification of appropriate variance
models for spatial data (G et al. 1997). J
et al. (2002) describe that the neighbour adjustments
displayed considerable impacts on estimates of ge-
netic parameters associated with family rankings and
genetic gains of family, individual and early selection.
According to their results, the 12 nearest-neighbours
used should be close to the optimal; but they suggest
a further study on the choice of neighbourhood size
for effective uses of neighbour adjustments. G-
et al. (1997) conclude that although there is no
one model that adequately fits all field experiments,
the separable autoregressive model is dominant.
B and G (1997) recommend fitting
global trends whenever they are present. Failure to
do so could lead to estimates of precision being too
small. is suggestion is based on simulation stud-
ies, the aim of which was to assess validity of several
correlated errors and alternative fixed effects spatial
analyses. ey focused on situations typical of large
field trials with limited replication and realistic levels
of both fixed and random components of spatial vari-
ation. As mentioned before, however, simple models
should be given priority to more complicated ones
because there is a risk of over-fitting effects and ar-
tificially reducing the estimates of precision.
is study has proven that spatial variation, when
taken into account in forestry trials, can significantly
improve the fit statistics, leading to more precise es-
timates of individual treatment means. Any hypoth-
esis tests formed around these means are therefore
greatly affected by the proper model selection. e
J. FOR. SCI., 53, 2007 (2): 47–56 55
two trials selected in this study were considered the
“best” given the mortality and related data diag-
nostics. One can easily imagine that inappropriate
data analysis of trials in the “worse” category could
lead to huge errors in ranking of provenances and
consequent false recommendations to operational
forestry.
R efe ren c es
BROWNIE C., GUMPERTZ M.L., 1997. Validity of spatial
analyses for large field trials. Journal of Agricultural, Bio-
logical, and Environmental Statistics, 2: 1–23.
CADENA A., BURGUEÑO J., CROSSA J., BÄNZIGER M.,
GILMOUR A.R., CULLIS B., 2000. User’s Guide for Spatial
Analysis of Field Variety Trials Using ASReml. CIMMYT,
México.
COSTA E SILVA J., DUTKOWSKI G.W., GILMOUR A.R.,
2001. Analysis of early tree height in forest genetic trials
is enhanced by including a spatially correlated residual.
Canadian Journal of Forest Research, 31: 1887–1893.
DUTKOWSKI G.W., COSTA E SILVA J., GILMOUR A.R.,
LOPEZ G.A., 2002. Spatial analysis methods for forest
genetic trials. Canadian Journal of Forest Research, 32:
2201–2214.
FU Y.B., YANCHUK A.D., NAMKOONG G., 1999. Spatial
patterns of tree height variations in a series of Douglas-fir
progeny trials: implications for genetic testing. Canadian
Journal of Forest Research, 29: 714–723.
GILMOUR A.R., CULLIS B.R., VERBYLA A.P., 1997. Ac-
counting for natural and extraneous variation in the analysis
of field experiments. Journal of Agricultural, Biological, and
Environmental Statistics, 2: 269–293.
GILMOUR A.R., GOGEL B.J., CULLIS B.R., WELHAM S.J.,
THOMPSON R., 2002. ASReml User Guide Release 1.0
VSN International Ltd., Hemel Hempstead.
HAMANN A., NAMKOONG G., KOSHY M.P., 2002. Im-
proving precision of breeding values by removing spatially
autocorrelated variation in forestry field experiments. Silvae
Genetica, 51: 210–215.
JOYCE D., FORD R., FU Y.B., 2002. Spatial patterns of tree
height variations in a black Spruce Farm-Field Progeny Test
and neighbors-adjusted estimations of genetic parameters.
Silvae Genetica, 51: 13–18.
KOBLIHA J., 1998. Provenance test of black spruce (Picea
mariana [Mill.] B.S.P.) in juvenile stage. Lesnictví-Forestry,
12: 535–541.
LITTELL R.C., MILLIKEN G.A., STROUP W.W., WOL-
FINGER R.D., 1996. SAS System for Mixed Models. SAS
Institute Inc., Cary, NC: 633.
NETER J., KUTNER M.H., WASSERMAN W., NACHTS-
HEIM CH.J., 1996. Applied Linear Statistical Models. 4
th
ed. McGraw-Hill, Irwin.
PEŘINA V. et al., 1984. Obnova a pěstování lesních porostů
v oblastech postižených půmyslovými imisemi. Praha,
MLVH: 173.
QIAO C.G., BASFORD K.E., DELACY I.H., COOPER M.,
2000. Evaluation of experimental designs and spatial
analyses in wheat breeding trials. eoretical and Applied
Genetics, 100: 9–16.
SAS
®
Institute Inc. 1999. SAS OnlineDoc(TM), Version 7-1
Cary, NC.
STROUP W.W., BAENZIGER P.S., MULITZE D.K., 1994.
Removing spatial variation from wheat yield trials: a com-
parison of methods. Crop Science, 34: 62–66.
STROUP W.W., 2002. Power analysis based on spatial effects
mixed models: a tool for comparing design and analysis
strategies in the presence of spatial variability. Journal of
Agricultural, Biological, and Environmental Statistics, 7:
491–511.
VACEK S., TESAŘ V., LEPŠ J., 1995. e composition and
development of young mountain ash and birch stands. In:
TESAŘ V. (ed.), Management of Forests Damaged by Air
Pollution. Proceedings of the Workshop IUFRO. Trutnov,
Czech Republic, June 5–9, 1994. Prague, Ministry of Ag-
riculture: 87–96.
VACEK S. et al., 2003. Mountain Forests of the Czech Repub-
lic. Prague, Ministry of Agriculture of the Czech Republic:
320.
WILLIAMS E.R., TALBOT M., 1996. ALPHA+. Experimental
designs for variety trials. Version 2.3, Design User Mannual,
CSIRO, Canberra, and SASS, Edinburgh.
Received for publication July 18, 2006
Accepted after corrections September 18, 2006
Hodnocení provenienčních experimentů se zohledněním prostorových
autokorelací na příkladu dvou ploch se smrkem černým
ABSTRAKT: Dvě provenienční plochy se smrkem černým (Picea mariana [Mill.] B.S.P.) byly hodnoceny s využitím
tradičních statistických metod a moderních prostorových analýz. Cílem bylo vysledovat případné rozdíly mezi těmito
přístupy z hlediska vhodnosti použitých modelů a také z hlediska odhadnutých průměrných výšek jednotlivých pro-
56 J. FOR. SCI., 53, 2007 (2): 47–56
Corresponding author:
Ing. T F, Česká zemědělská univerzita v Praze, Fakulta lesnická a environmentální, katedra dendrologie
a šlechtění lesních dřevin, 165 21 Praha 6-Suchdol, Česká republika
tel.: + 420 224 383 787, fax: + 420 234 381 860, e-mail: funda@fle.czu.cz
veniencí. Prostorové modely byly následně upravovány takovým způsobem, aby se co nejlépe vypořádaly s externími
zdroji proměnlivosti. Jak jsme očekávali, modely zohledňující prostorovou proměnlivost byly pro zvolené datové sou-
bory vhodnější. Při využití těchto modelů jsme pozorovali více či méně výrazný posun nejen v odhadech průměrných
výšek jednotlivých proveniencí, ale také v jejich relativním pořadí, což by mohlo ve svém důsledku významně ovlivnit
i interpretaci výsledků celých provenienčních pokusů. Dále zmiňujeme problémy spojené s analýzou experimentů
založených tradičním náhodným blokovým uspořádáním, kterých se využívá v lesnickém výzkumu.
Klíčová slova: Picea mariana (Mill.); provenienční výzkum; REML; prostorová proměnlivost