Báo cáo lâm nghiệp: "Production potential and ecological stability of mixed forest stands in uplands – VI. A beech/larch stand on a mesotrophic site of the Křtiny Training Forest Enterprise" pot
Bạn đang xem bản rút gọn của tài liệu. Xem và tải ngay bản đầy đủ của tài liệu tại đây (268.64 KB, 15 trang )
170 J. FOR. SCI., 53, 2007 (4): 170–184
JOURNAL OF FOREST SCIENCE, 53, 2007 (4): 170–184
Nine years ago, in 1997 the project Production and
ecological stability of mixed stands under anthropi-
cally influenced conditions of uplands as a basis
for the proposal of target species composition was
presented in the Journal of Forest Science (Lesnictví-
Forestry), No. 4. Results of the production potential
and stability of five experimental stands in the Křtiny
Training Forest Enterprise (TFE) were gradually ana-
lyzed in five studies (K, P 1998; K,
K 2000; K et al. 2001; J, K-
2001; K, H 2003).
e presented sixth contribution evaluates the
growth, development, production and stability of a
mixed 67-year beech/larch stand on a mesotrophic
site. In the stand, other four species (oak, hornbeam,
birch, spruce) at important proportions are recorded
as interspersed species. Based on the papers pub-
lished so far, in the majority of sites of the 2
nd
and
the 3
rd
forest vegetation zone of the Křtiny TFE,
the extremely high vitality, stability and production
potential of beech have been proved. Beech showed
itself as the main autochthonous broadleaved species
of target species composition.
European larch (Larix decidua Mill.) has a different
position in the Křtiny TFE. It is not an autochthonous
species there and its planting and growing started in
the 70s of the 18
th
century (O 1948; N
1957; T 1999). In the course of about 250 years,
the species has become an important and integral
component of local forest ecosystems with quite
exceptional production, stabilization and aesthetic
position. In forestry groups of the whole Europe, it is
known as the “Adamov population of larch” (accord-
ing to one of the municipalities of the region).
Supported by the Ministry of Education, Youth and Sports of the Czech Republic, Project No. MSM 6215648902.
Production potential and ecological stability of mixed
forest stands in uplands – VI. A beech/larch stand
on a mesotrophic site of the Křtiny Training Forest
Enterprise
V. H, P. K
Faculty of Forestry and Wood Technology, Mendel University of Agriculture and Forestry Brno,
Brno, Czech Republic
ABSTRACT: e paper is the 6
th
report on the production potential and stability of mixed forest stands in uplands. A mixed
beech/larch stand that was established by natural regeneration in 1934 to 1942 is assessed. e stand is situated at an altitude
of 460 m above sea level. It has been le to its natural development since 1961. At that time, the stand was characterized
as an individually mixed, diameter- and height-differentiated 25-year pole-stage stand. e proportion of larch and beech
amounted to 40% and 17%, respectively. Hornbeam (25%), oak (11%) and to a lesser extent birch (5%) and spruce (3%) also
occurred in the stand. In the course of 42 years, the proportion of larch in this stand without planned thinning measures
decreased to 35%. On the other hand, the proportion of beech increased to 39%. During all 5-year inventories, the stand
could be characterized as a stabilized one with high production potential. Its initial growing stock 63 m
3
/ha at an age of
25 years increased to 497 m
3
/ha at an age of 67 years in 2003. At present, current volume increment amounts to 9.8 to
12.5 m
3
/ha/year.
Keywords: beech; larch; oak; hornbeam; mixed stands; natural development; production; mortality; slenderness ratio
J. FOR. SCI., 53, 2007 (4): 170–184 171
Particularly in mixed stands with beech, its pro-
duction potential is unique. Data from “Haša’s
Sanctuary” are generally known and cited in forestry
literature (K et al. 2005). is overmature
mixed beech/larch stand, registration No. 152C17,
Forest District Habrůvka, is 175 years old at present.
It serves as a recreational and educational area. With
the mean height of beech 40 m and of larch 48 m its
respectable growing stock amounts to 1,250 m
3
/ha
and current volume increment 11.4 m
3
/ha/year.
However, interesting data on mixed beech/larch
stands from other regions of the Czech Republic are
available in older papers of T (1949), M
(1967) and Z (1970). Important data on
this mixture were published in papers of Š
(1977, 2000). In European literature, considerable
attention is also paid to mixed beech/larch stands.
L (1990), F (1991), S
(1992) and M (1995) recommended to estab-
lish mixed stands of this type. Production potential
was studied in papers of B (1967) and
P and M (1992), stability in studies of
S (1991, 1995) and D (2000), com-
petition relationships of both species were analyzed
by D (1988), R (1992), G (2001),
etc. From the aspect of the age and spatial structure
of forest ecosystems the position of beech and larch
was assessed by B (1987), S (1989,
1991), K (1992), S (1990), etc.
is brief and incomplete overview of papers indi-
cates the wide range of problems under study.
As indicated above and as it follows from the title
of the presented paper the study tries to enlarge
and specify our knowledge particularly of produc-
tion possibilities and stability of mixed beech/larch
stands.
MATERIAL
Characteristics of experimental stand
Stand No. 131 F17/7b originated through natural
regeneration of six tree species, viz beech, larch,
oak, hornbeam, birch and spruce in 1934 to 1942,
i.e. in the course of a short regeneration period.
In this basic mixture, also fir and pine regenerated
sporadically (in records unified with spruce) as well
as mountain ash and aspen (in records unified with
birch). For the first 25 years, the stand was left more
or less to its natural development while only several
moderate measures were taken aimed particularly at
the removal of dead trees.
In 1961, when the stand age was 25 years, the De-
partment of Silviculture (Prof. V) of the Facul-
ty of Forestry, University of Agriculture, established
permanent thinning plots in the traditional layout.
e total area of the stand part is 1.14 ha. e stand
is situated on a plateau sloping slightly northward at
an altitude of 460 m above sea level (geographical
co-ordinates 49°19´13.062´´N and 16°40´01.324´´E).
Mean annual precipitation is 584 mm, mean annual
air temperature 7.4°C. On the Brno eruptive rock
granodiorite with overlays of aeolian sediments, soils
of the mesotrophic Cambisol type and typical Luvi-
sol were formed. From the viewpoint of typology,
the stand was classified as forest type 3B2, i.e. rich
oak/beech forest with Asperula sp. (management
group of stands No. 45).
In research plots (area of each of them 0.25 ha, a
series of 4 partial plots 50 × 50 m), low thinning and
crown thinning measures are compared in 5-year
periods with control plots left to their natural devel-
opment (only dead trees are removed). e present
paper summarizes and evaluates only the natural de-
velopment of Stand No. 131 F17/7b on a control plot
(50 × 50 m – 0.25 ha) without intentional measures,
namely in a period of 42 years – from 1961 to 2003.
At the time of establishing the research plots, the
25-year-old stand was characterized as an individu-
ally mixed diameter- and height-differentiated pole-
stage stand neglected from silvicultural aspects. e
proportion of the tree species was as follows: beech
17%, larch 40%, oak 11%, hornbeam 25%, spruce 3%
and birch 5%. On the control plot, reserved trees
from the original parent stand remained, viz two
Scots pine trees and one European larch.
Methods of field studies and evaluation
of results
Methods of the evaluation of growth, develop-
ment, mortality and production potential of par-
ticular experimental stands are uniform within the
whole research project being presented in detail in
the initial paper in the journal Lesnictví-Forestry
(K 1997). erefore, we can give only basic in-
formation here. In regular five-year intervals, height,
diameter at breast height (dbh), crown height, crown
length and cover are measured in all trees. Each of
the trees is evaluated according to the classification
scale of the Department of Silviculture (K
1997). As in previous studies I–V, the present paper
evaluates only a control plot which was left to its
natural development without planned felling measu-
res throughout the study (42 years). e total area of
the plot is 0.25 ha (50 × 50 m).
In the 42-year time series of five-year periods
(from 1961 to 2003), the following parameters were
172 J. FOR. SCI., 53, 2007 (4): 170–184
assessed separately in the particular species of the
mixed stand: total frequency and mortality of trees,
frequency in height and diameter classes, mean
stand height, mean dbh, basal area, growing stock,
stocking (stand density), species composition. To
compile and assess evaluative criteria the following
procedures were chosen:
Mortality (expressed in % of dead trees) in the
particular intervals of five-year investigations is
always related to the frequency of previous meas-
urements. Within the analysis of the hypothesis of
the dependence of dieback of subdominant trees
standard parameters of differences between upper
and lower limits were used. If the population normal-
ity was rejected, nonlinear Box-Cox transformation
and exponential transformation were used to obtain
quality estimates of mean values and their interval
estimates. The programmes Statistica CZ 7 and
QCExpert were used for statistical analysis.
At the time of the plot establishment in 1961, a
number of beech and hornbeam trees survived on
control plots as suppressed and subordinate trees
which did not reach the given input parameters
(dbh = 4 cm, h = 4 m). e majority of them died
during the next development of the stand and, thus
they were never recorded. However, if some of the
trees survived in competition and reached dbh 4 cm
during the five-year check measurements, they
were newly included in the evaluation of the check
database.
e stand growing stock and the periodic volume
increment derived from it are related only to the
dominant stand and the volume of dead trees is not
included in the calculation. Stand density was calcu-
lated according to standard mensurational practice
from the ratio of actual basal area of the particular
species and tabular data. On the basis of reduced
areas determined in this way the species composi-
tion was also found out. To determine tabular basal
areas Mensurational Tables of the Institute for For-
est Management Planning (1990 – Taxační tabulky
ÚHÚL) were used to ensure comparability with the
results of studies carried out on these plots in the
past. On the basis of the evaluation described above
the importance and the share of particular species in
the production potential and stability of the studied
mixed stand were assessed. Simultaneously, primary
data were acquired to achieve the strategic goal of the
whole project, i.e. specification and presentation of
the proposal (variants) of the target species composi-
tion in the most important management groups of
stands of upland regions – in the given case for HS
45 (management group of stands 45).
RESULTS
Analysis of the natural development
of stand No. 131f17/7b
Basic characteristics of the stand 131 F17/7b
control plot in the year of establishment (1961) are
given in Table 1. At that time (age 25 years), it was an
individually mixed pole-stage stand neglected from
the viewpoint of silviculture. Its basal area amounted
to 13.339 m
2
/ha and growing stock to 63.3 m
3
/ha.
Stand density and mortality
e initial stand density 3,450 trees/ha (Table 1)
in 1961 corresponded to age (25 years), site and
species composition. However, a number of beech,
hornbeam and birch trees with dbh smaller than
4 cmthat were not included in the check records
survived as subdominant trees (see Methods). Some
of the trees reached the value in the course of the
next 6 years and, thus, the stand density during
0
200
400
600
800
1000
1200
1400
1961 1967 1972 1977 1982 1987 1992 1997 2003
Year
Number of trees/ha
European larch
Sessile oak
Beech
Hornbeam
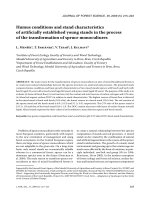
Fig. 1. Development of the number of
beech, European larch, sessile oak and
hornbeam trees in stand 131F17/7b in
1961 to 2003
1,400
1,200
1,000
800
600
400
200
0
J. FOR. SCI., 53, 2007 (4): 170–184 173
the second measurement in 1967 was 220 trees/ha
higher than at the initial measurement amounting to
3,670 trees/ha.
During subsequent time periods, however, the
stand density naturally decreased due to competition
and natural selection down to the present value of
Table 1. e development of stand basic data on the control plot in 1961–2003
Species
No. of
trees/ha (N)
Mean tree
Stand basal
area (b.a.)
(m
2
/ha)
Growing
stock
(m
3
/ha)
Stand
density
Species
composition
(%)
h (m)
dbh
(cm)
v (m
3
)
1961 – age 25
Norway spruce 108 6.5 6.3 0.01 0.3878 1.5 0.02 2.7
Larch 768 9.8 8.7 0.05 5.8814 35.2 0.28 39.7
Oak 400 9.0 6.4 0.01 1.4527 5.4 0.08 10.8
Beech 744 8.4 5.8 0.01 2.1579 7.5 0.12 17.0
Hornbeam 1,316 9.3 5.1 0.01 2.8925 11.0 0.18 24.8
Birch 112 10.2 7.3 0.03 0.5662 2.8 0.04 5.0
Total 3,448 13.3385 63.3 0.71 100.0
1967 – age 31
Norway spruce 48 8.1 8.0 0.03 0.2822 1.3 0.01 1.4
Larch 752 11.0 9.8 0.07 7.4981 52.5 0.33 37.0
Oak 352 10.3 7.9 0.03 1.9571 8.9 0.10 11.1
Beech 1,028 9.0 6.3 0.01 3.5697 13.4 0.19 21.3
Hornbeam 1,364 9.9 5.4 0.01 3.4914 13.5 0.21 23.3
Birch 128 11.5 8.6 0.04 0.8843 4.8 0.05 5.9
Total 3,672 17.6828 94.4 0.88 100.0
1972 – age 36
Norway spruce 36 11.6 10.1 0.05 0.3096 1.9 0.01 1.2
Larch 516 16.2 13.4 0.17 9.0615 87.1 0.32 34.7
Oak 256 14.7 11.0 0.08 2.6695 19.3 0.12 12.4
Beech 944 11.8 7.6 0.03 4.9210 26.4 0.23 24.8
Hornbeam 1,012 11.7 6.3 0.02 3.5555 15.5 0.19 20.6
Birch 92 16.8 12.8 0.11 1.2885 10.0 0.06 6.3
Total 2,856 21.8056 160.2 0.93 100.0
1977 – age 41
Norway spruce 20 12.3 10.8 0.06 0.1845 1.1 0.01 0.7
Larch 440 18.5 15.8 0.27 10.5904 116.9 0.34 32.8
Oak 216 16.7 13.2 0.12 3.1724 26.8 0.13 12.7
Beech 992 12.8 8.3 0.04 6.3960 40.1 0.29 27.9
Hornbeam 956 12.4 6.5 0.02 3.6806 17.0 0.20 18.8
Birch 104 17.0 13.7 0.14 1.7206 14.1 0.07 7.1
Total 2,728 25.7445 216.0 1.04 100.0
1982 – age 46
Norway spruce 12 12.3 11.1 0.06 0.1181 0.7 0.00 0.4
Larch 408 20.2 16.4 0.30 10.4265 123.0 0.33 35.1
Oak 184 18.3 13.9 0.15 2.9747 27.3 0.12 12.7
Beech 848 14.3 8.9 0.05 6.1049 42.3 0.27 28.6
Hornbeam 656 13.5 7.1 0.02 2.9993 14.9 0.15 16.1
Birch 84 19.6 15.6 0.18 1.6784 15.0 0.07 7.1
Total 2,192 24.3020 223.2 0.93 100.0
174 J. FOR. SCI., 53, 2007 (4): 170–184
1,340 trees/ha (natural mortality 61%) at an age of
67 years in 2003 (Table 1).
e natural development of the number of trees of
4 main species in the stand in the course of 42 years
is also documented in Fig. 1.
e highest total mortality was observed in horn-
beam. Of the initial number of 1,316 trees/ha
some
1,060 trees/ha, i.e. 80.5%, died. Similar trends were
also noted in the light-demanding oak: at the first
survey 400 trees/ha, at the last survey 92 trees/ha
(mortality 77%).
Relatively high mortality was also noted in the
main production species of the studied stand, i.e.
larch. rough natural development, 512 trees/ha,
i.e. 67%, gradually died. Similarly like in oak, this
natural mortality was exclusively observed in sup-
pressed subdominant larch trees.
Beech shows quite a specific position in the studied
stand. In the period 1961 to 1967, the number of regis-
tered trees with dbh exceeding 4 cm increased by 290 to
1,030 beech trees/ha. Also in the next years, beech sur-
vived in the competition with other species markedly
best. During the last check in 2003, some 680 beech
trees/ha were registered in all stand levels. As compared
with the initial inventory in 1961, only 64 trees/ha died
in the course of 42 years (natural mortality 9%).
Species
No. of
trees/ha (N)
Mean tree
Stand basal
area (b.a.)
(m
2
/ha)
Growing
stock
(m
3
/ha)
Stand
density
Species
composition
(%)
h (m)
dbh
(cm)
v (m
3
)
1987 – age 51
Norway spruce 12 13.3 11.3 0.07 0.1212 0.8 0.00 0.4
Larch 408 22.2 18.5 0.45 13.8221 183.5 0.39 34.6
Oak 176 19.3 15.5 0.20 3.5714 35.4 0.14 12.0
Beech 840 15.4 10.2 0.08 8.4300 70.6 0.35 31.1
Hornbeam 648 13.8 7.4 0.03 3.2589 16.9 0.16 14.1
Birch 84 21.2 18.7 0.28 2.4813 23.4 0.09 7.8
Total 2,168 31.6849 330.7 1.14 100.0
1992 – age 56
Norway spruce 4 15.5 13.3 0.11 0.0556 0.4 0.00 0.2
Larch 320 25.1 22.5 0.66 15.1822 210.1 0.40 35.5
Oak 132 20.8 18.1 0.29 3.5764 38.4 0.13 11.6
Beech 640 17.3 12.5 0.14 9.4599 88.0 0.38 33.6
Hornbeam 408 14.7 8.7 0.04 2.8073 15.4 0.13 11.9
Birch 64 22.5 21.2 0.37 2.3816 23.5 0.08 7.3
Total 1,568 33.4630 375.8 1.13 100.0
1997 – age 61
Norway spruce 4 16.5 13.3 0.12 0.0555 0.5 0.00 0.1
Larch 276 27.5 25.8 0.88 16.8584 242.8 0.42 35.3
Oak 116 21.9 19.5 0.35 3.6315 41.2 0.13 10.8
Beech 660 18.2 13.1 0.17 10.9949 112.7 0.43 36.1
Hornbeam 340 15.5 9.3 0.05 2.7037 15.4 0.13 10.7
Birch 64 23.5 21.8 0.40 2.5120 25.7 0.08 7.1
Total 1,460 36.7560 438.2 1.18 100.0
2003 – age 67
Norway spruce 4 17.2 13.3 0.12 0.0556 0.5 0.00 0.1
Larch 256 28.8 28.1 1.06 18.3120 272.1 0.43 35.2
Oak 92 23.9 21.6 0.47 3.4763 43.3 0.12 9.6
Beech 680 17.8 13.5 0.21 12.5586 140.6 0.48 39.4
Hornbeam 256 15.8 10.4 0.06 2.5039 14.8 0.11 9.3
Birch 56 24.8 22.8 0.46 2.4027 25.6 0.08 6.3
Table 1 to be continued
J. FOR. SCI., 53, 2007 (4): 170–184 175
Table 2. Basic statistical analysis of trees heights of Fagus sylvatica L. in 1967–2003 – smoothing of density 0.5, significance level 0.05, value tested 0 (with respect to an insufficient amount
of data, the years 1961, 1982 and 1992 were not included)
Year of measurements 1967 1967–1972 1972 1972–1977 1977 1977–1982 1987 1987–1992 1997 1997–2003
Fagus sylvatica L. living trees dead trees living trees dead trees living trees dead trees living trees dead trees living trees dead trees
Traditional parameters
number of valid data 257 21 236 6 248 36 210 49 165 11
mean 9.03 8.35 11.84 10.58 12.80 9.54 15.44 11.79 18.23 12.20
lower limit 8.81 7.67 11.47 8.03 12.40 8.95 14.85 11.06 17.41 10.80
upper limit 9.25 9.03 12.20 13.13 13.20 10.13 16.02 12.51 19.04 13.60
variance 3.21 2.24 7.94 5.91 10.17 3.06 18.69 6.36 27.93 4.34
standard deviation 1.79 1.50 2.82 2.43 3.19 1.75 4.32 2.52 5.29 2.08
skewness 0.60 0.53 0.59 1.03 0.42 0.60 0.35 0.18 0.11 0.61
deviation from 0 significant insignificant significant insignificant significant insignificant significant insignificant insignificant insignificant
acuteness (kurtosis) 3.24 2.32 3.09 2.89 2.81 4.25 2.45 2.77 2.34 2.16
deviation from 3 insignificant insignificant insignificant insignificant insignificant insignificant insignificant insignificant insignificant insignificant
half-sum 9.70 8.95 13.45 11.60 14.60 11.00 17.30 12.55 18.90 13.10
modus 8.34 7.93 10.68 9.05 11.75 10.29 14.14 12.41 17.55 10.33
Test of
normality
normality rejected accepted rejected accepted rejected accepted accepted accepted accepted accepted
calculated 9.73 1.66 9.01 2.84 6.02 2.80 4.09 0.44 0.50 1.46
theoretical 5.99 5.99 5.99 5.99 5.99 5.99 5.99 5.99 5.99 5.99
probability 0.008 0.436 0.011 0.241 0.049 0.247 0.129 0.801 0.780 0.481
Box-Cox transformation of data
Validity yes yes yes
Likelihood 422.09 387.83 403.58
Corrected mean 8.8 11.5 12.5
Exponential transformation of data
Validity yes yes yes
Corrected mean 8.8 11.5 12.5
Interval of reliability
Lower 8.63 11.16 12.13
Upper 9.05 11.85 12.91
176 J. FOR. SCI., 53, 2007 (4): 170–184
Table 3. Basic statistical analysis of tree heights of Larix decidua Mill. in 1961–2003 – smoothing of density 0.5, significance level 0.05, tested value 0 (with respect to an insufficient amount
of data the years 1982 and 1997 were not included)
Year of measurements 1961 1961–1967 1967 1967–1972 1972 1972–1977 1977 1977–1982 1987 1987–1992 1992 1992–2003
Larix decidua Mill. living trees dead trees living trees dead trees living trees dead trees living trees dead trees living trees dead trees living trees dead trees
Traditional parameters
number of valid data 192 24 188 60 129 19 110 8 102 24 80 9
mean 9.75 7.46 11.04 8.19 16.15 11.41 18.47 12.15 22.15 15.78 25.13 18.88
lower limit 9.25 6.94 10.48 7.69 15.41 10.21 17.66 10.21 21.08 14.74 24.04 16.24
upper limit 10.26 7.98 11.60 8.68 16.90 12.61 19.28 14.09 23.22 16.81 26.22 21.52
variance 12.55 1.59 15.31 3.63 18.33 6.21 18.39 5.41 29.72 6.28 23.92 11.79
standard deviation 3.54 1.26 3.91 1.90 4.28 2.49 4.29 2.33 5.45 2.51 4.89 3.43
skewness 0.43 –0.02 0.70 0.67 0.04 1.83 –0.01 –0.01 –0.01 0.30 –0.30 0.15
deviation from 0 significant insignificant significant significant insignificant significant insignificant insignificant insignificant insignificant insignificant insignificant
acuteness (kurtosis) 2.27 3.37 3.07 2.85 2.17 5.26 2.32 2.06 2.03 2.89 2.38 2.14344
deviation from 3 significant insignificant insignificant insignificant insignificant significant insignificant insignificant insignificant insignificant insignificant insignificant
half-sum 8.85 7.15 9.73 7.64 15.70 9.14 17.67 11.64 21.70 14.71 26.22 17.89556
Test of
normality
normality accepted accepted rejected accepted accepted rejected accepted accepted accepted accepted accepted accepted
calculated 5.13 0.06 9.47 4.48 0.07 8.28 0.03 0.03 0.04 0.70 1.55 0.12618
theoretical 5.99 5.99 5.99 5.99 5.99 5.99 5.99 5.99 5.99 5.99 5.99 5.99
probability 0.077 0.972 0.009 0.106 0.964 0.016 0.983 0.986 0.982 0.706 0.460 0.939
Box-Cox transformation of data
Validity yes yes
Likelihood 312.42 37.75
Corrected mean 10.47 10.83
Exponential transformation of data
Validity yes yes
Corrected mean 10.36 10.64
Interval of reliability
Lower 9.86 10.11
Upper 10.89 11.41
J. FOR. SCI., 53, 2007 (4): 170–184 177
Table 4. e development of larch frequency in height classes (m) and mortality on the control plot of stand 131 F17/7b
(0.25 ha) in 1961–2003
Height
class (m)
1961
1961–1967
1967
1967–1972
1972
1972–1977
1977
1977–1982
1982
1982–1987
1987
1987–1992
1992
1992–1997
1997
1997–2003
2003
4 5 1 1
5 16 2 2 0
6 21 3 17 10 0
7 23 9 21 12 1
8 21 8 22 17 2 1 1 0
9 12 15 6 5 3 0
10 24 3 15 3 6 6 3 1 1 1 1 0
11 12 18 5 10 7 3 2 1 0 0
12 12 14 3 6 1 0 1 0 0
13 15 12 1 9 9 2 5 5 4 0
14 9 18 7 7 1 3 3 2 2 2 0 0
15 12 10 13 1 4 7 10 7 2 1 1 1 0
16 4 9 12 9 1 2 1 1 1 0 0
17 1 4 8 1 15 7 4 3 1 1 0 0
18 5 2 9 1 8 13 5 1 3 2 1 0
19 0 1 8 7 10 5 3 2 1 1 1 1
20 0 2 13 7 7 7 4 1 1 2
21 0 1 4 6 8 8 1 5 6 2 4
22 0 4 7 11 7 9 6 0 1
23 0 0 5 4 7 2 6 1 3 2
24 0 0 1 7 9 5 2 1 6 2
25 0 0 3 4 2 7 7 2 4
26 0 0 0 2 5 6 5 7 5
27 0 0 0 3 1 5 5 4 2
28 0 0 0 0 5 3 8 6 4
29 0 0 0 0 1 3 4 4 4
30 0 0 0 0 0 8 7 8 9
31 0 0 0 0 0 4 5 7 5
32 0 0 0 0 0 1 2 4 1 6
33 0 0 0 0 0 0 1 3 6
34 0 0 0 0 0 0 1 3 3
35 0 0 0 0 0 0 1 2 1
36 0 0 0 0 0 0 0 0 1
37 0 0 0 0 0 0 0 0 2
Total 192 24 188 59 129 20 110 8 102 102 22 80 11 69 5 64
Per ha 768 96 752 236 516 80 440 32 408 408 88 320 44 276 20 256
Mean
height
9.8 7.5 11.0 8.1 16.2 11.4 18.5 12.2 20.2 22.2 15.8 25.1 18.3 27.5 21.6 28.8
Statistical analysis of the results of biometrical
studies shows considerable differentiation of tree lay-
ers of dying and living trees, particularly of larch (in
the period 1961–2003) but also of the shade-tolerant
beech. e analysis demonstrated a hypothesis of the
dieback of mainly subdominant trees. is assump-
tion was proved mainly in the light-requiring larch
(Tables 2 and 3).
178 J. FOR. SCI., 53, 2007 (4): 170–184
Table 5. e development of beech frequency in height classes (m) and mortality on the control plot of stand 131 F17/7b
(0.25 ha) in 1961–2003
Height
class (m)
1961
1961–1967
1967
1967–1972
1972
1972–1977
1977
1977–1982
1982
1982–1987
1987
1987–1992
1992
1992–1997
1997
1997–2003
2003
4 0 1 0 0 0 0 0 0 5
5 5 0 0 0 0 0 0 0 6
6 17 12 2 0 0 1 1 0 0 1 3
7 41 1 46 5 11 8 5 2 2 2 0 1 2
8 48 1 56 6 14 1 13 6 7 5 4 1 0 7
9 29 50 2 23 2 14 5 6 5 4 1 1 2 3
10 30 48 4 44 31 10 20 23 8 13 1 10 3 4
11 8 24 2 33 2 32 9 14 11 5 5 6 3 8
12 3 8 21 29 22 1 19 9 11 2 7 5
13 5 8 33 23 24 14 5 7 10 3 5
14 0 3 19 31 27 23 6 11 1 5 8
15 0 1 13 1 21 1 22 17 3 12 13 1 11
16 0 0 8 12 14 14 2 17 11 1 5
17 0 0 9 14 16 8 5 14 8
18 0 0 3 8 12 20 1 16 6 7
19 0 0 1 2 8 12 9 14 11
20 0 0 4 8 9 9 12 8 7
21 0 0 0 1 3 6 11 8 4
22 0 0 0 0 4 10 11 13 12
23 0 0 0 1 0 8 5 6 6
24 0 0 0 0 1 0 5 7 7
25 0 0 0 0 0 2 3 8 12
26 0 0 0 0 0 1 2 7 7
27 0 0 0 0 0 0 1 4 8
28 0 0 0 0 0 1 0 1 2
29 0 0 0 0 0 0 2 0 2
30 0 0 0 0 0 0 0 2 2
31 0 0 0 0 0 0 0 0 2
32 0 0 0 0 0 0 0 1 0
33 0 0 0 0 0 0 0 0 1
Total 186 2 257 21 236 6 248 36 212 2 210 49 160 5 165 11 170
Per ha 744 8 1,028 84 944 24 992 144 848 8 840 196 640 20 660 44 680
Mean
height
8.4 7.4 9.0 8.3 11.8 10.6 12.8 9.5 14.3 9.3 15.4 11.8 17.3 11.8 18.2 12.2 17.8
e frequency of larch and beech in height
and diameter classes
e development of larch and beech frequency in
height classes in the course of 1961–2003 is given
in Tables 4 and 5, and in diameter classes in Tables
6 and 7. ese surveys also show the distribution of
dead trees depending on their height or dbh.
e very broad range of larch heights from 4 to 18 m
already at the establishment of research plots in 1961
documents an important position of the species both
as a subdominant, co-dominant as well as dominant
tree. However, the best part of the trees was rather
slender having an unfavourable slenderness ratio.
Based on Table 4 it is evident that 65% of larch trees
had dbh of only 4 to 8 cm at the first survey. e ma-
J. FOR. SCI., 53, 2007 (4): 170–184 179
jority of them died already in the course of the first
decade in 1961 to 1972 (see Tables 4 and 6).
Simultaneously, a group of co-dominant and domi-
nant ash trees has however been differentiated in the
stand since the first measurements (in 1961 height
12 to 18 m, dbh 12 to 28 cm) forming gradually a basis
of the high production and stability of the whole stand.
During the last check in 2003, it was possible to include
as many as 130 larch trees/ha 30 to 37 m tall with dbh
30 to 58 cm in this group (see Tables 4 and 6).
Beech trees were nearly exclusively subdominant
and co-dominant ones in the whole period of evalu-
ation. Data in Table 5 demonstrate considerable vi-
tality and also the quite extraordinary potential of
beech to survive in lower layers. In 1961, the height
range of beech was 5 to 13 m and in 1982 from 6 to
24 m. e height range even increased in the next
years and in the last check it was from 4 to 33 m.
Only a few beech trees have occurred as co-domi-
nant trees in the last years (Table 5). In the course of
Table 6. e development of larch frequency in diameter classes (m) and mortality on the control plot of stand 131 F17/7b
(0.25 ha) in 1961–2003
Diameter
class
(cm)
1961
1961–1967
1967
1967–1972
1972
1972–1977
1977
1977–1982
1982
1982–1987
1987
1987–1992
1992
1992–1997
1997
1997–2003
2003
4 57 20 31 24 1 1 0 0 0 0
6 42 3 48 28 20 12 7 4 3 3 3 0 0
8 25 1 25 5 19 6 13 3 10 10 8 2 2 0 0
10 21 23 2 16 9 9 9 5 4 4 0 0
12 17 17 13 1 17 1 16 11 3 6 2 4 3 1
14 13 15 21 12 12 11 3 6 2 4 3
16 7 11 9 12 12 11 12 1 6 1 4
18 3 5 9 14 14 7 7 10 7
20 2 3 6 6 6 8 5 4 1 7
22 2 3 4 3 3 7 6 6 5
24 1 1 1 5 5 7 5 4 3
26 1 3 1 2 2 2 8 6 4
28 1 1 4 1 1 2 3 7 5
30 0 2 2 1 1 2 1 1 5
32 0 0 1 3 3 1 3 2 3
34 0 0 2 3 3 2 0 2 1
36 0 0 0 0 0 1 2 1 3
38 0 0 0 1 1 3 2 1 2
40 0 0 0 1 1 3 2 1 0
42 0 0 0 0 0 0 1 2 1
44 0 0 0 0 0 1 3 3 1
46 0 0 0 0 0 0 1 1 2
48 0 0 0 0 0 0 0 2 4
50 0 0 0 0 0 1 1 1 2
52 0 0 0 0 0 0 0 0 0
54 0 0 0 0 0 0 0 0 0
56 0 0 0 0 0 0 0 1 0
58 0 0 0 0 0 0 0 0 1
Total 192 24 188 59 129 20 110 8 102 102 22 80 11 69 5 64
Per ha 768 96 752 236 516 80 440 32 408 408 88 320 44 276 20 256
Mean
diameter
8.7 4.9 9.8 5.7 13.4 6.8 15.8 7.8 16.4 18.5 9.5 22.5 11.4 25.8 14.6 28.1
180 J. FOR. SCI., 53, 2007 (4): 170–184
42 years of monitoring, particularly subdominant
trees and extremely slender beech trees with un-
favourable slenderness ratio died. Nevertheless,
even at an age of 67 years, 170 beech trees/ha were
registered as overtopped trees (height 4 to 12 m).
erefore, particularly the mean values of height and
dbh in beech (Tables 5 and 7) are markedly lower
than in larch (Tables 4 and 6).
Stand basal area
It was already stated in previous papers (K,
P 1998; K, H 2003) that the basal area
increment dynamics was the most objective criterion
for assessing the production potential of particular
species in naturally developing mixed stands. e
total stand basal area amounting to 13.339 m
2
/ha
in 1961 increased 3 times after 42 years reaching
39.309 m
2
/ha (Table 8).
At the same time, the basal area of larch increased
from 5.881 to 18.312 m
2
/ha, i.e. to 315%. An even more
dynamic increase in basal area was noted in beech, viz
to 582% (from 2.158 m
2
/ha to 12.559 m
2
/ha).
An increase in basal area (however, not substan-
tial in absolute values) was also noted in oak and
birch. In spruce and hornbeam, these values even
decreased due to high mortality of the species during
the years of evaluation (Table 8).
Growing stock
e growing stock development (m
3
/ha) compiled
again according to the particular species in five-year
intervals is given in Table 9. e total growing stock in-
creased from initial 63.3 m
3
/ha
in 1961 to 496.9 m
3
/ha
(i.e. 7.8 times) in 2003.
In absolute values, larch participates in this total to
the largest extent (272.2 m
3
/ha, i.e. 55% of the total
growing stock), nevertheless, the dynamics of its mean
annual increment (4.9–6.5 m
3
/ha/year) approached
the level of beech increment in the last ten years (4.7 to
4.9 m
3
/ha/year). In the next years, it will be of inte-
rest to compare the trend of current increments of
both species. Similarly like in basal area, the highest
relative increase in the growing stock was noted in
beech, viz from the initial value of 7.5 m
3
/ha in 1961
to 140.6 m
3
/ha
(28% of the total growing stock) in
2003. Of course, interspersed species participated
in the growing stock as well, particularly oak (an
increase from initial 5.4 m
3
/ha to 43.3 m
3
/ha) and
Table 7. e development of beech frequency in diameter classes (m) and mortality on the control plot of stand 131 F17/7b
(0.25 ha) in 1961–2003
Diameter
class
(cm)
1961
1961–1967
1967
1967–1972
1972
1972–1977
1977
1977–1982
1982
1982–1987
1987
1987–1992
1992
1992–1997
1997
1997–2003
2003
4 93 2 85 16 43 5 45 23 22 21 16 3 5 20
6 59 98 5 82 1 71 10 61 2 55 24 25 4 24 9 11
8 25 42 53 47 3 44 34 8 23 1 25 1 25
10 8 21 29 32 32 27 1 27 27 1 22
12 0 9 14 23 22 15 15 13 15
14 1 1 10 12 13 19 15 12 13
16 0 1 4 10 10 17 17 13 13
18 0 0 1 6 6 8 11 17 14
20 0 0 0 2 2 7 8 5 9
22 0 0 0 0 0 3 8 9 5
24 0 0 0 0 0 4 4 7 9
26 0 0 0 0 0 0 4 2 4
28 0 0 0 0 0 0 0 3 5
30 0 0 0 0 0 0 0 3 3
32 0 0 0 0 0 0 0 0 2
Total 186 2 257 21 236 6 248 36 212 2 210 49 160 5 165 11 170
Per ha 744 8 1,028 84 944 24 992 144 848 8 840 196 640 20 660 44 680
Mean
diameter
5.8 4.0 6.3 4.5 7.6 4.6 8.3 5.2 8.9 6.2 10.2 5.7 12.5 6.2 13.1 6.3 13.5
J. FOR. SCI., 53, 2007 (4): 170–184 181
hornbeam (an increase from initial 11.0 m
3
/ha to
14.1 m
3
/ha).
e high production potential of the mixed stand
is also documented by the values of current volume
increment which ranged from 9.8 to 12.5 m
3
/ha/year
during the last decade.
Stocking and species composition
Data on the development of stocking and species
composition throughout the studied period are given
in Table 1.
e stand can be considered to be fully stocked
throughout the period of evaluation. e calculated
very low or low stocking of the stand at an age of
25 to 35 years (0.71–0.93) was inaccurate, not cor-
responding to reality. At that time, a large part of
the stand consisted of subordinate extremely slender
broadleaved species (beech, hornbeam) with an ex-
tremely low basal area. Its value was then markedly
undervalued by the method of stocking calculation.
In the last four inventories, however, calculated
stocking ranged between 1.1 and 1.2.
At the initial measurement, the stand was char-
acterized as an individually mixed pole-stage stand
with the following species composition: larch 40%,
beech 17%, oak 11% and hornbeam 25%. Birch (5%)
and spruce (2%) occurred as interspersed species
there.
In the next years, the proportion of larch slightly
decreased, nevertheless, the species has taken up
steadily 35% of the reduced stand area in the last
20 years.
On the other hand, the proportion of the second
main species, i.e. beech, gradually increased at all
inventories up to 39% at the present time.
Oak (10%), hornbeam (9%) and birch (6%) take
up the position of interspersed species even at
present.
DISCUSSION
e exceptional production potential of mixed
beech/larch stands in the Křtiny Training Forest
Enterprise (TFE) was mentioned on the example
of Haša’s Sanctuary (Hašova svatyně) already in the
introduction of the study (K et al. 2005). Not
only the growing stock of the overmature 175-year-
old stand (1,250 m
3
/ha) but also its current volume
increment (11.4 m
3
/ha) are worthy of remark. Simi-
larly high production like in the assessed 67-year-old
stand 131F17/7b (497 m
3
/ha) was mentioned also
in other stands of the Křtiny TFE. T (1996)
reported data from stand 154B6 with the proportion
Table 8. e development of stand basal area on the control plot (m
2
/ha) and its increase in per cent in 1961 (age 25 years) to 2003 (age 67 years)
Species 1961 1967 1972 1977 1982 1987 1992 1997 2003 Increase with respect to 1961
Norway spruce 0.3879 0.2823 0.3097 0.1845 0.1181 0.1212 0.0556 0.0556 0.0556 –0.3324 –86
Larch 5.8814 7.4981 9.0615 10.5904 10.4264 13.8221 15.1822 16.8584 18.3119 12.4306 211
Oak 1.4527 1.9571 2.6695 3.1724 2.9747 3.5714 3.5764 3.6315 3.4763 2.0237 139
Beech 2.1579 3.5697 4.9209 6.3960 6.1050 8.4300 9.4600 10.9949 12.5586 10.4008 482
Hornbeam 2.8925 3.4914 3.5555 3.6806 2.9993 3.2589 2.8073 2.7037 2.5039 –0.3886 –13
Birch 0.5662 0.8843 1.2885 1.7206 1.6784 2.4813 2.3816 2.5120 2.4027 1.8365 324
Total per ha 13.3385 17.6828 21.8056 25.7445 24.3020 31.6849 33.4630 36.7560 39.3091 25.9706 195
182 J. FOR. SCI., 53, 2007 (4): 170–184
of beech and larch 30 and 70%, respectively, where
the growing stock amounted to 457 m
3
/ha. K
(2000) reported an even higher potential of a mixed
beech/larch stand in the same enterprise. At an age
of 51 years, the stand with the proportion of beech
and larch 80 and 20%, respectively, had the total
growing stock of 430 m
3
/ha. With the proportion of
beech and larch 60 and 40%, respectively, the grow-
ing stock was however already markedly higher,
namely 537 m
3
/ha.
Problems of the importance of a larch admixture
for increasing the production of oak/beech stands
in the Křivoklát region were dealt with by Z
(1970). His study was based on the analysis of 5 plots
at an age of 90 to 120 years with different proportions
of European larch. From the aspect of soil typology
there were medium-gleyed Podzols in this locality.
e author draw a conclusion that at the larch ad-
mixture of about 30% the growing stock increased by
27% compared to a pure broadleaved stand (i.e. by
90 m
3
/ha at an age of 120 years on medium site class-
es). It roughly corresponds to 50 to 60 larch trees
per ha. us, the average spacing of larch trees in a
mixed 140-year-old mature stand of beech and oak
should be ± 15 m. However, the higher proportion of
larch up to 50% led to a markedly lower proportion
of large-diameter assortments.
In Germany in the Lower Saxony Upland in the
region of Unterer Solling (altitude 200 to 400 m),
D (1988) and G (2001) studied mixed
beech/larch stands.
D (1988) demonstrated the high production
of this mixture compared to pure stands in his paper
aimed at the growth potential in tended beech/larch
stands. He also analyzed the relation of the total
growing stock to the variable proportion of larch. All
studied stands (aged 55 to 150 years) were supported
by sandy soils overlaid by a 35 to 70cm layer of loess.
As for the soil type, it was slightly podzolic soil or
pseudogleyic Cambisol. D found that the op-
timum basal area, production and quality of stands
were related to the proportion of larch. He recom-
mended 25 to 45% of the total number of stems as an
optimum proportion, which roughly corresponded
to the basal area of 40 m
2
/ha at an age from 50 to
85 years. Up to the limit, the negative relation be-
tween the proportion of larch and the quality and
particularly production of beech was not proved. In
connection with inappropriately performed tending
measures the higher proportion of larch (over 45%)
can decrease the total production. As a rule, the vol-
ume production of the mixture of beech with larch is,
however, higher as compared with table values.
G (2001) established a series of research
plots in mixed beech/larch stands aged 30 to
160 years. In total, 25 plots were situated on brown
soils overlaid by a 40 to 100cm loess layer and
predominating humus form “moder”. To establish
a good-quality and highly productive mixed stand
the author recommended to use larch during re-
generation, namely always with sufficient advance.
e proportion of larch in regeneration need not be
higher than 400 to 500 trees per ha. In the pole-stage
stand, the number of larch trees should be reduced to
120 to 180 trees per ha. In the stage of maturity, 35 to
50 larch trees per ha are quite sufficient. Simulta-
neously, it is advisable to mark and release 100 to
120 target beech trees per ha. To achieve higher
quality production, the author recommended the
pruning of selected larch trees up to a height of 6 m
already in the pole-stage stand.
CONCLUSION
Results of our study presented in this paper con-
formable with other Czech and foreign studies have
proved that even a simple and easy-to-manage mix-
ture of larch and beech meets the requirements for
the high production potential and stability on me-
sotrophic sites of uplands. Moreover, an admixture
Table 9. e development of growing stock on the control plot (m
3
/ha) in 1961 (age 25 years) to 2003 (age 67 years)
Species 1961 1967 1972 1977 1982 1987 1992 1997 2003
Norway spruce 1.45 1.30 1.92 1.10 0.73 0.82 0.44 0.48 0.48
Larch 35.23 52.53 87.07 116.89 122.96 183.54 210.12 242.80 272.15
Oak 5.37 8.89 19.34 26.78 27.29 35.39 38.41 41.18 43.31
Beech 7.46 13.40 26.45 40.10 42.34 70.59 88.02 112.72 140.58
Hornbeam 11.03 13.54 15.48 16.95 14.89 16.87 15.39 15.36 14.80
Birch 2.80 4.75 9.97 14.13 14.99 23.45 23.46 25.66 25.56
Total per ha 63.34 94.42 160.22 215.95 223.20 330.65 375.84 438.20 496.87
Stand density 0.71 0.88 0.93 1.04 0.93 1.14 1.13 1.18 1.22
J. FOR. SCI., 53, 2007 (4): 170–184 183
of other site-suitable species favourably affects the
biodiversity of these ecosystems.
Mixed beech/larch stands are also characterized by
quite an exceptional aesthetic value. e statistical
analysis of biometric data demonstrated a hypothesis
of the dieback of mainly subdominant trees. is as-
sumption was proved mainly in light-requiring larch.
Similarly like in previous studies, it has been dem-
onstrated that beech is a basic broadleaved species of
the target species composition of uplands.
Larch in a mixture with beech has to take up the
position of an individually admixed species. Clump-
or group-mixture is unsuitable from the viewpoint
of silviculture. Moreover, larch has to be grown from
the juvenile age with a sufficient height start as a
dominant species or even as markedly dominant
trees with free crowns.
From the aspect of ensuring all priority functions
(production, stabilization, aesthetic) of beech/larch
stands it is possible to recommend the optimum
proportion of larch to range from 20 to 40% on me-
sotrophic sites of uplands.
Ref erence s
BACHMANN P., 1967. Baumartenwahl und Ertragsfähig-
keit. Schweizerische Zeitschrift für Forstwesen, 118:
306–317.
BURSCHEL P., 1987. Der Wald von morgen. Ergebnis des
Waldbaues von heute. AFZ – Der Wald, 42: 1162–1165.
DIPPEL M., 1988. Wuchsleistung und Konkurrenz von Bu-
chen/Lärchen-Mischbeständen im Südniedersächsischen
Bergland. [Dissertation zur Erlagung des Doktorgrades des
Forstwissenschaflichen Fachberechs.] Göttingen, Georg-
August-Universität: 337.
DUCHIRON M.S., 2000. Strukturierte Mischwälder – Eine
Herausforderung für den Waldbau unserer Zeit. Berlin,
Paul Parey: 256.
FREIST H., 1991. Ist es sinnvoll, vier Baumarten (Buche, Eiche,
Fichte, Lärche) zu mischen? Forst und Holz, 46: 501–502.
GUERICKE M., 2001. Untersuchungen zur Wuchsdynamik
von Mischbeständen aus Buche und Europa. Lärche Larix
decidua Mill. als Grundlage für ein abstandsabhängiges
Einzelbaumwachstumsmodell. [Diplomarbeit.] Göttingen,
Georg-August-Universität: 220.
JELÍNEK P., KANTOR P., 2001. Production potential and
ecological stability of mixed forest stands in uplands – IV. A
mixed spruce/pine stand in the forest type group 2S (fresh,
nutrient-medium beech-oak stand). Journal of Forest Sci-
ence, 47: 529–544.
KANTOR P., 1997. Produkce a ekologická stabilita smíšených
lesních porostů v antropicky se měnících podmínkách
pahorkatin jako podklad pro návrh cílové skladby dřevin.
Lesnictví-Forestry, 43: 220–229.
KANTOR P., PAŘÍK T., 1998. Produkční potenciál a ekolo-
gická stabilita smíšených lesních porostů v pahorkatinách
– I. Jehličnatý porost s příměsí buku na kyselém stanovišti
ŠLP Křtiny. Lesnictví-Forestry, 44: 488–505.
KANTOR P., HURT V., 2003. Production potential and
ecological stability of mixed forest stands in uplands –
V. A mixed spruce/beech stand on a nutrient-rich site of
the Křtiny Training Forest Enterprise. Journal of Forest
Science, 49: 502–514.
KANTOR P., KNOTT R., MARTINÍK A., 2001. Production
potential and ecological stability of mixed forest stands in
uplands – III. A single tree mixed stand with Douglas fir on
an eutrophic site of the Křtiny Training Forest Enterprise.
Journal of Forest Science, 47: 45–59.
KANTOR P., TRUHLÁŘ J., HURT V., 2005. Produkční po-
tenciál Hašovy svatyně – smíšeného porostu modřínu s bu-
kem na Školním lesním podniku Křtiny. In: PEŇÁZ J.,
MARTINEK J. (ed.), Hlavní úkoly pěstování lesů na počátku
21. století. Sborník z konference, Křtiny 14.–16. 9. 2004.
Brno, MZLU, LDF, ÚZPL: 339–344.
KENK G.K., 1992. Schlussfolgerungen aus langfristigen
Mischbestandsversuchen in Südwestdeutschland. In:
PREUHSLER T. (ed.), IUFRO Centennial Meeting, Berlin-
Eberswalde, 31. August–4. September, Eberswalde, 100 Jah-
re IUFRO: 1–9.
KLÍMA S., 2000. Anbau und Produktion verschiedener
Buchen – Lärchenmischbestände. In: TESAŘ V. (ed.), Die
Baumart Buche im ökologischen Waldbau, XIV. Gemein-
sammes Waldbau – Kollogium Brno – arandt, Brno und
Křtiny, 12.–14. 10. 2000: 65–67.
KNOTT R., KANTOR P., 2000. Produkční potenciál a ekolo-
gická stabilita smíšených lesních porostů v pahorkatinách
– II. Bukojedlový porost na živném stanovišti ŠLP Křtiny.
Journal of Forest Science, 46: 61–75.
LÜDEMANN G., 1990. Die Mischbaumarten des Buchenwal-
des. Forst und Holz, 45: 59–63.
MÁLEK J., 1967. Ekologie a pěstování modřínu v jedlosmrko-
vých bučinách. Zprávy lesnického výzkumu, 13: 37–38.
MOSER O., 1995. Umwandlung unstandortsgemäser Fichten-
bestände in naturnahe Mischwälder der Forstverwaltung
Bad Goisern der Österreichischen Bundesforste. Central-
blatt für das gesamte Forstwesen = Austrian Journal of
Forest Science, 112: 33–51.
NOŽIČKA J., 1957. Přehled vývoje našich lesů. Praha, SZN:
250.
OPLETAL J., 1948. Křtinské lesy před 150 lety. Československý
Háj, XXII: 292–294.
PREUHSLER T., MAYER J., 1992. Growth of some predomi-
nant trees of different species in a mixed stand of South-
ern Bavaria. In: PREUHSLER T. (ed.), IUFRO Centennial
Meeting, Berlin-Eberswalde, 31. August–4. September,
Eberswalde, 100 Jahre IUFRO: 47–54.
ROTH C., 1992. Gedanken zur naturbedingten Konkurrenz
von Baumarten, insbesondere der Lärche und Buche im
184 J. FOR. SCI., 53, 2007 (4): 170–184
schweizerischen Mittelland. Schweizerische Zeitschrift für
Forstwesen/Journal forestier suisse, 143: 1–2.
SEITSCHEK O., 1989. Aufbau stabiler Wälder – zentrale
Aufgabe des Waldbaus. Forst und Holz, 44: 163–169.
SEITSCHEK O., 1991. Mischwald als Ziel des Waldbaus. AFZ
– Der Wald, 46: 1246–1251.
SCHWANECKE W., 1992. Standortsbedingte Möglichkei-
ten und Grenzen beim Umbau reiner Fichtenbestände
zu Laub-(Nadel-) Mischwäldern im Ostharz. AFZ – Der
Wald, 47: 87–90.
SMALTSCHINSKI T., 1990. Mischbestände in der Bundesre-
publik Deutschland. Forstarchiv, 61: 137–140.
STÄDTLER H., 1991. Der Betriebszieltyp Buche/Europäische
Lärche im Solling. Forst und Holz, 46: 502–505.
STÄDTLER H., 1995. Verwirklichung des Betriebszieltyps 28:
Buche/Lärche. AFZ – Der Wald, 50: 1032–1037.
ŠINDELÁŘ J., 1997. Principy zakládání porostních směsí.
Lesnická práce, 52: 208–210.
ŠINDELÁŘ J., 2000. Přirozená obnova lesních porostů v České
republice. Lesnická práce, 79: 296–297.
TICHÝ J., 1949. Pěstování modřínu v lesích podniku Státní
lesy. Písek, Lesnické kulturní ústředí při ČAZ v Praze: 42.
TRUHLÁŘ J., 1996. Pěstování lesů v biologickém pojetí
– Průvodce po Školním lesním podniku Masarykův les
Křtiny. Brno, Křtiny, MZLU, ŠLP ML: 117.
TRUHLÁŘ J., 1999. Problematika uplatnění modřínu v ob-
novních cílech. In: Lesní semenářství a šlechtění lesních
dřevin. Praha, Brno, MZe ČR, MZLU, ŠLP ML Křtiny:
45–50.
ÚHÚL, 1990. Taxační tabulky. Jíloviště-Strnady, VÚLHM.
ZAKOPAL V., 1970. Význam modřínové příměsi pro zvýšení
produkce dubo-bukových porostů. Lesnický časopis, 16:
35–51.
Received for publication April 4, 2006
Accepted after corrections September 12, 2006
Produkční potenciál a ekologická stabilita smíšených lesních porostů
v pahorkatinách – VI. Bukomodřínový porost na živném stanovišti
ŠLP Křtiny
ABSTRAKT: Příspěvek je v pořadí šestým sdělením o produkčním potenciálu a stabilitě smíšených lesních porostů
v pahorkatinách. Je v něm posuzován smíšený bukomodřínový porost založený v letech 1934 až 1942 přirozenou
obnovou. Porost se nachází v nadmořské výšce 460 m a od roku 1961 je ponechán přirozenému vývoji. V té době byl
charakterizován jako jednotlivě smíšená, tloušťkově a výškově diferencovaná 25letá tyčkovina až tyčovina. Zastoupení
modřínu činilo 40 %, buku 17 %. V porostu byl dále zastoupen habr (25 %), dub (11 %) a v menší míře i bříza (5 %)
a smrk (3 %). V průběhu 42 let se v tomto porostu bez úmyslných probírkových zásahů ustálilo zastoupení modřínu
na 35 %, naopak zastoupení buku vzrostlo na 39 %. Při všech pětiletých inventarizacích i v současnosti lze porost
charakterizovat jako stabilizovaný s vysokým produkčním potenciálem. Jeho počáteční zásoba 63 m
3
/ha ve věku 25 let
vzrostla na 497 m
3
/ha ve věku 67 let v roce 2003. Běžný objemový přírůst činí v současné době 9,8 m
3
/ha/rok až
12,5 m
3
/ha/rok.
Klíčová slova: buk; modřín; dub; habr; smíšený porost; přirozený vývoj; produkce; mortalita; štíhlostní kvocient
Corresponding author:
Ing. V H, Mendelova zemědělská a lesnická univerzita v Brně, Lesnická a dřevařská fakulta, Lesnická 37,
613 00 Brno, Česká republika
tel.: + 420 545 134 124, fax: + 420 545 134 125, e-mail: