Báo cáo lâm nghiệp: "Regeneration and game damage in the Krušné hory Mts. assessed on the basis of National Forest Inventory of the Czech Republic" pps
Bạn đang xem bản rút gọn của tài liệu. Xem và tải ngay bản đầy đủ của tài liệu tại đây (374.37 KB, 14 trang )
J. FOR. SCI., 55, 2009 (6): 279–292 279
JOURNAL OF FOREST SCIENCE, 55, 2009 (6): 279–292
A need to monitor the forest state within the
complex territory of the countries in Europe arose
at the beginning of the 20
th
century. After World
War I, when the role of the State began to change
distinctly, there arose a need to have reliable data on
the resources and state of national economy and to
use them optimally. Information on the forest state
as a resource of timber, very important mainly for the
Scandinavian countries, was also involved. is was
the starting moment for a survey of timber supplies
in the whole territory of the country often realized
by special methods – National Inventories of Forests
(A 1997). Norway was one of the first countries
realizing inventory: it presented the year 1919 as an of-
ficial start of its National Forest Inventory (L
et al. 1973). In a short time Finland, Sweden and in
1924 Great Britain followed (e.g. L 1924,
1926; L 1926, 1932; Ö 1932). e
first summarized statistics appeared, summarized
forest management plans were introduced in the
territory of Germany, Austria-Hungary and in other
countries of Central and Eastern Europe, in some
other countries information was gathered from for-
est owners by means of questionnaires. Scandinavian
countries were the first to introduce the method of
statistical forest inventory (Z 1980). In the
course of the 20
th
century National Forest Invento-
ries were embodied in the legislation of most Euro-
pean countries. e last countries accepting national
forest inventory are the Baltic countries, Denmark,
Czech Republic and Slovakia.
e National Forest Inventory (NFI) in the Czech
Republic, based on measurements of randomly
chosen experimental plots, was carried out for the
first time in 2001–2004. e Institute of Forestry
Ecosystems Research (IFER) in Jílové near Prague
prepared and realized the pilot investigation for the
whole project, and measurements were done by the
Regeneration and game damage in the Krušné hory Mts.
assessed on the basis of National Forest Inventory
of the Czech Republic
L. L
1
, R. M
2
1
Forest Management Institute, Brandýs nad Labem, branch Plzeň, Czech Republic
2
Faculty of Forestry and Wood Sciences, Czech University of Life Sciences in Prague,
Prague, Czech Republic
ABSTRACT: In 2001–2004 National Forest Inventory was realized in the Czech Republic. A great number of variables
was measured giving rise to an extensive information database that can be used to assess the state and development of
various quantitative and qualitative dendrometric characteristics. is work presents the results of regeneration state
and game damage in the Krušné hory Mts. based on the data from both the National Forest Inventory and the sec-
ond enlarged measurement carried out after five years that was done in a part of the Fláje preserve and enabled basic
comparison with the rest of the area. For the calculation of data acquired in the old and recent measurement standard
methodology for processing National Forest Inventory was used. Comparison of data showed that the average number
of regeneration individuals dropped by more than a third in the interval of 5 years, as well as the number of plots with
regeneration; game damage of regeneration also was lower by 4%. e proportion of individuals damaged by peeling
did not change during the investigated period. A significant increase in game damage to regeneration was found in the
Fláje preserve.
Keywords: National Forest Inventory; game damage; Krušné hory Mts.
280 J. FOR. SCI., 55, 2009 (6): 279–292
Forest Management Institute (ÚHÚL) in Brandýs
nad Labem. e assessment of measured data, fol-
lowed by still up-to-date discussion, is a subject of
interest of both the professional community and the
public.
Due to data observed on inventory plots and
their great volume the Czech Republic has taken a
prominent position among the European countries
(H 2002).
e system of forest inventory must be effective
and statistically justifiable. At the same time the
structure of forest inventory must be dynamic with
a possibility to do changes. e whole system is built
on interconnected measurements in defined time
intervals on the same plots. A series of repeated and
interconnected investigations is a basis for determi-
nation of developmental trends (like an increase or
decrease in growing stock, current increment devel-
opment of tree species composition, etc.) (Š
2000).
The database acquired directly in a forest has
a great information potential. Mathematical and
statistical methods enable to get series of data and
phenomena both by simple assessment of measured
variables or by observation of their dependences. A
project was realized in the Krušné hory Mts. involv-
ing a part aimed at the assessment of game damage
from the data of the National Forest Inventory of
the Czech Republic and from subsequent measure-
ments on the same plots. e analysis of investigated
parameters of forest regeneration and present influ-
ence of game on forest ecosystems using data from
the National Forest Inventory was carried out for the
Natural Forest Area Krušné hory Mts. representing
ca 110,230 ha of land determined for forest-produc-
ing functions. e territory of the former working-
plan area Františkovy Lázně was excluded.
METHODOLOGY
e regulation of the CR government from June 7,
2000, ordered National Forest Inventory in the CR
territory in the years 2001 to 2004. e aim of this
National Forest Inventory was to collect data on the
actual state and development of forests in the Czech
Republic. e inventory involved physical investiga-
tion of data on plots in areas of basic dimensions
2 × 2 km distributed in a regular network across all
forests in the CR territory. Each plot included two
separate parts of circular shape with the radius of
12.62 m and their centres 300 m apart from each
other.
According to the type of terrain an inventory plot
could be divided into partial areas called subplots.
Subplots can be differentiated for many reasons
(border of the country, forest/non-forest border); for
our assessment a distinct boundary of heterogeneous
stand parts was important (age, species or altitudinal
difference). In the framework of the National Forest
Inventory two inventory circles were established:
1. inventory circle with the radius of 2 m used for the
investigation of forest regeneration; 2. inventory cir-
cle with the radius of 3 m serving for measurements
of thin trees with dbh 7–11.9 cm.
e number of individuals according to tree spe-
cies was investigated in each height regeneration
class as well as the number of trees damaged by
browsing of terminal shoot, by fraying or by peeling
and browsing by ungulate game. Peeling and brows-
ing of trees with dbh 7–11.9 cm were related to the
inventory circle with the radius of 3 m, whilst trees
with dbh 12 cm and more were investigated all over
the inventory plot. e assessment of game damage
involved all tree species growing on the inventory
plot (ÚHÚL 2003).
e National Forest Inventory uses its own ter-
minology, often different from the terminology
commonly used (ÚHÚL 2003). To enable compari-
son with the other conclusions of National Forest
Inventory this terminology is left unchanged in the
following cases:
– regeneration – all individuals on an inventory
circle (radius 2 m) from height 10 cm up to trees
with dbh 6.9 cm overbark (all individuals fulfilling
these parameters are counted without regard to
the management intention),
– regeneration height class – class I – height 0.1 m
to 0.5 m; class II – height 0.5 m to 1.3 m; class III
– height 1.3 m to dbh 6.9 cm,
– regeneration under shelterwood – regeneration
under the parent stand, regeneration in open
space – regeneration outside the parent stand,
– factors negatively influencing regeneration – pro
-
portional share is of concern derived from area
shares of inventory subplots according to ob-
served signs. For each plot three negative factors
could be presented, and therefore the factors are
overlapping (sum of percentages is not 100),
– browsing as a negative factor – is derived from
area shares of inventory subplots and involves
also lateral browsing, unlike the investigation of
regeneration individuals where lateral browsing is
not assessed,
– factors negatively influencing regeneration – are
of biotic or abiotic character. When the actual
situation on subplots is assessed, only the three
most important factors of all can be chosen and
considered,
J. FOR. SCI., 55, 2009 (6): 279–292 281
– group of tree species – tree species are aggregated
into 24 groups of tree species according to the fol-
lowing key (see Table 1) (ÚHÚL 2007).
Besides regeneration defined for the National
Forest Inventory (ÚHÚL 2003), the term “opera-
tionally useable regeneration” was introduced, i.e.
such regeneration where its further use in forestry
is supposed.
Operationally useable regeneration is represented
by:
– individuals found during the National Forest In
-
ventory of the height from 0.1 m to 1.3 m (height
class from 1.3 m to dbh 6.9 cm is not taken for
regeneration phase here but for the phase of arisen
thickets),
– individuals of tree species suitable for the site
found in the open space and below the stand in
those cases when the principal stand is older than
80 years.
Data on some properties of operationally useable
regeneration were evaluated separately (green line)
for an altitude above 700 m and below this limit and
were then compared with each other. e altitude
ranges from 352 m to 1,080 m above sea level. ere
are 41% of the area below the green line and 59%
above it.
e database of National Forest Inventory as the
primary information base was used both for repeated
measurements and for more detailed investigations
in the Fláje preserve.
e concerned area of the Krušné hory Mts. com-
prises in total 577 plots and 729 subplots that are proc-
essed in this investigation (S et al. 2008).
Data collected experimentally are processed
by means of a set of mathematical and statistical
methods that are described in the work Inventory
of forests in the Czech Republic, Set of mathematical
and statistical evaluation methods, Mathematical
and statistical processing of sets with measured data
(Z 2004).
Estimations of parameters of the basic set differ in
qualitative and quantitative variables.
For qualitative variables it is valid:
n
i
p = –––– (1)
n
where:
p – probability of phenomenon (mean value of binomial
distribution),
n
i
– number of positive occurrences of the attribute and n is
the total number of measurements.
Variance is defined by
p × (1 – p)
S
2
= –––––––– (2)
n
e accuracy of the mean frequency value of the
basic set is determined by the interval of reliability
of relative frequency p reached with a certain reli-
ability 1 – α.
Techniques of estimation:
a) For
n high enough, i.e. n > 40, the estimation
formula for the interval of reliability can be used
reaching certain probability 1 – α.
p ×
(1 – p)
P = p ± z
α
×
√
–––––––– (3)
n
where:
z
α
– quantile of standardized normal distribution for the
probability limit α.
e equation
p ×
(1 – p)
z
α
=
√
–––––––– (4)
n
quantifies the estimation error of mean values of
the relative frequency of basic set that is expected
with required probability 1 – α.
b) For low
n, i.e. n < 40, the estimation formula is
used for the lower and upper limit of the interval
of reliability reached with a certain probability
1 – α.
Lower limit
n
0
––––––––––––––––– (5)
n
0
+ (n – n
1
+ 1) × F
α
–––; v
1
; v
2
2
Upper limit
(n
0
+ 1)
×
F
α
1 – –––; v
3
; v
4
2
––––––––––––––– (6)
n – n
0
+ (n
0
+ 1) × F
α
1 – –––; v
3
; v
4
2
are the quantiles of Fisher-Snedocorov F-distribu-
tion, α is probability, v
1
= 2 (n – n
0
+ 1), v
2
= 2 n
0
,
v
3
= 2 (n
0
+ 1), v
4
= 2 (n – n
0
) are the degrees of
freedom, n is the total number of values, n
0
is the
absolute frequency of phenomenon (Z 2004).
For qualitative variables it is valid:
point estimation of parameter µ:
1
n
x
–
= ––––
×
∑ x
j
(7)
n
j=1
point estimation of parameter
2
s
:
n
1
n
S
2
× –––––, when S
2
= –––
×
∑ (x
j
– x
–
)
2
(8)
n – 1
n
j=1
interval estimation of parameter µ:
F
α
–––; v
1
; v
2
,
2
F
α
1 – ––; v
3
; v
4
2
282 J. FOR. SCI., 55, 2009 (6): 279–292
Table 1. Group of tree species
Group of tree species Tree species
Norway spruce Picea abies (L.) Karst.
Silver fir Abies alba Mill.
Pine
Pinus sylvestris L., Pinus nigra Arnold, Pinus banksiana Lamb., Pinus strobus L., Pinus
cembra L., Pinus contorta Loudon, other Pinus sp.
Larch Larix decidua Mill., other Larix sp.
Mountain pine Pinus mugo Turra, Pinus rotundata Link.
Douglas fir Pseudotsuga menziesii (Mirbel) Franco
Grand fir Abies grandis (D. Don) Lindl.
Spruce exotics
Picea pungens Engelm., Picea mariana (Mill.) Britton et al., Picea glauca (Moench) Voss.,
Picea omorika (Pančić) Purkyně, Picea engelmanni Engelm., others
Other coniferous species other coniferous species
Oak
Quercus robur L., Quercus robur L. f. slavonica Gayer, Quercus petraea Liebl., Quercus
pubescens Willd., Quercus palustris Muenchh., Quercus cerris L., others
Red oak Quercus rubra L.
European beech Fagus sylvatica L.
European hornbeam Carpinus betulus L.
Maple Acer platanoides L., Acer pseudoplatanus L., Acer campestre L., Acer negundo L., others
Ash Fraxinus excelsior L., Fraxinus angustifolia Vahl., Fraxinus americana L.
Elm Ulmus minor Mill., Ulmus glabra Hudson, Ulmus laevis Pallas
Locust Robinia pseudoacacia L.
Birch Betula pendula Roth, Betula pubescens Ehrh.
Alder Alnus glutinosa (L.) Gaertn., Alnus incana (L.) Moench, Alnus viridis (Chaix) DC
Linden Tilia cordata Mill., Tilia platyphyllos Scop., Tilia tomentosa Moench.
European aspen Populus tremula L.
Poplar Populus alba L., Populus nigra L., others
Willow Salix caprea L., Salix alba L., Salix fragilis L.
Other broadleaved
species
Sorbus aucuparia L., Sorbus torminalis (L.) Crantz, Sorbus aria (L.) Crantz, Juglans regia L.,
Juglans nigra L., Platanus acerifolia (Aiton) Willd., Prunus avium (L.) L., Prunus padus L.,
Pyrus communis L. var. pyraster, Malus sylvestris Mill., Aesculus hippocastanus L., Castanea
sativa Mill., Alintus altissima (Miller) Swingle, others
lower limit
S
x
–
– t
α;n–1
× ––––––– (9)
√ n – 1
upper limit
S
x
–
+ t
α;n–1
×
––––––– (10)
√ n – 1
where:
t
α;n–1
– quantile of Student’s t-distribution,
α – probability (
Z 2004).
RESULTS AND DISCUSSION
Krušné hory Mts. – regeneration
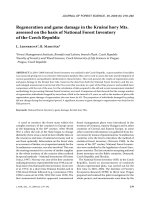
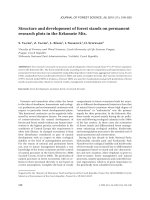
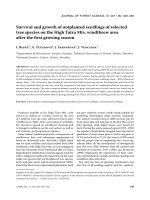
Fig. 1 illustrates the distribution of regenera-
tion on inventory plots in the territory concerned.
Regeneration on only one subplot was sufficient
enough for classifying into plots with regeneration.
In total, regeneration was indicated on 70.1% of the
investigated subplots. e highest share of the plots
is represented by regeneration under shelterwood
J. FOR. SCI., 55, 2009 (6): 279–292 283
– nearly 40%, the share of regeneration in the open
space is ca 30%, and no regeneration is nearly on
30% of the plots.
Artificial regeneration with a share of natural
regeneration up to 20% prevails in the open space,
natural regeneration (with a share of artificial regen-
eration up to 20%) is entirely prevailing below the
stand. Natural regeneration with a share of artificial
regeneration up to 20% prevails also in the complete
evaluation.
e number of individuals is higher in regeneration
under shelterwood (over 20,000 pcs/ha), for regener-
ation in the open space it is “only” 7,900 pcs/ha. e
high representation of Norway spruce, dominating
in both types of regeneration, is not such a surprise.
Spruce is followed by birch and other deciduous tree
species (rowan accounts for more than 90% of this
group) in the open space, below the stand the other
deciduous tree species, maple and beech, are behind
the spruce.
Fig. 1. Distribution of regeneration based
on National Forest Inventory data
Double-plot – both plots non-forest
Single-plot – forest, no regeneration
Single-plot – forest, regeneration
Table 2. e occurrence of tree species in regeneration
Tree species
Number of regeneration individuals/ha in investigated territory
regeneration in open space regeneration under shelterwood totally
number error (%) number error (%) number error (%)
Picea abies (L.) Karst. 4,168.2 ± 1,990.3 52.8 13,929.0 ± 4,623.3 69.1 6,418.6 ± 1,853.0 65.0
Pinus sp. 80.6 ± 74.8 1.0 20.8 –20.8; +30.3 0.1 32.7 ± 25.8 0.3
Larix sp. 248.9 ± 119.3 3.2 148.5 ± 110.6 0.7 132.1 ± 55.3 1.3
Pinus mugo 56.1 ± 45.3 0.7 0.0 0.0 0.0 17.5 ± 14.2 0.2
Picea exots 354.1 ± 116.7 4.5 35.6 –25.6; +36.8 0.2 123.4 ± 40.2 1.2
Quercus sp. 66.6 ± 47.7 0.8 727.5 ± 475.4 3.6 288.2 ± 176.4 2.9
Quercus rubra (L.) 0.0 ± 0.0 0.0 3.0 ± 5.8 0.0 1.1 –1.1; +2.1 0.0
Fagus sylvatica L. 581.9 ± 423.6 7.4 1,306.5 ± 567.4 6.5 661.5 ± 248.9 6.7
Carpinus betulus L. 21.0 –21; +41.4 0.3 145.5 –145.5; 186.0 0.7 60.0 –60; +69.5 0.6
Acer sp. 238.4 ± 180.0 3.0 1,333.2 ± 559.8 6.6 564.4 ± 216.8 5.7
Fraxinus sp. 3.5 –3.5; +6.9 0.0 522.6 ± 486.8 2.6 193.2 ± 179.2 2.0
Ulmus sp. 0.0 0.0 0.0 3.0 –3.0; +5.8 0.0 1.1 –1.1; +2.1 0.0
Betula sp. 1,093.8 ± 373.7 13.8 421.6 ± 264.1 0.0 495.6 ± 154.2 5.0
Alnus sp. 42.1 ± 36.2 0.5 103.9 –103.9; 139.2 2.1 51.3 –51.2; 52.3 0.5
Populus tremula L. 52.6 –52.6;+67.1 0.7 11.9 –11.9; 16.5 0.5 20.7 –20.7; 21.7 0.2
Salix sp. 63.1 ± 53.0 0.8 0.0 ± 0.0 0.1 19.6 ± 16.5 0.2
Other deciduous
tree species
827.3 ± 353.9 10.5 1,455.0 ± 401.1 7.2 792.5 ± 188.4 8.0
Totally 7,898.2 100.0 20,167.5 100.0 9,873.5 100.0
284 J. FOR. SCI., 55, 2009 (6): 279–292
Total regeneration of coniferous tree species is
represented by 68% and of deciduous tree species by
32%. Regeneration of coniferous tree species in the
open space is 62.2% and of deciduous tree species
37.8%. And there are 70.1% of coniferous trees spe-
cies and 29.9% deciduous tree species represented in
regeneration under shelterwood. Table 2 shows the
distribution of tree species in regeneration.
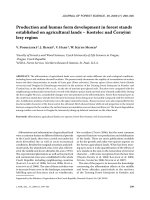
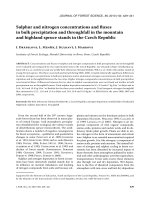
While the number of individuals regenerating
in the open space is relatively balanced in height
classes, a reduction in the number of individuals with
increasing height is evident for regeneration under
shelterwood (where natural regeneration prevails
and reduction of individuals is a natural phenom-
enon) (see Fig. 2).
Game browsing is the most important factor nega-
tively influencing regeneration. e lack of light can-
not be generally taken for a negative factor, especially
in such localities where natural regeneration is not
intended (young stands, unsuitable species composi-
tion). Further negative factors prevailing in the open
space (climate, weeds and waterlogging) show that
regeneration under shelterwood should be preferred.
Protective measures in regeneration are realized
in the open space, by coating or by spraying against
browsing in 12.5% and by fencing in 3.8%, sporadi-
cally they are used under shelterwood.
Operationally useable regeneration is more limited
than that defined by methodology for the National
Forest Inventory. Of the plots realizing regeneration
according to National Forest Inventory only 38.2%
comply with the definition of operationally useable
regeneration; totally 26.8% of all forest plots are
comprised.
When operationally useable regeneration is real-
ized, then there is no principal difference between
localities at altitudes above or below 700 m a.s.l.,
which concerns approximately 42 to 44% of all sub-
plots. It is interesting that the base for operationally
useable regeneration for plots above 700 m a.s.l. is
in the open space and, on the contrary, for plots ly-
ing below 700 m a.s.l. it is under shelterwood (see
Table 3) (the plot proportion is an average of relative
frequency according to Formula 1, errors for defining
the interval estimation are in brackets, calculated
according to Formulas 9 and 10).
When the species composition of individuals in
operationally useable regeneration is compared (see
Table 4) with total regeneration (Table 2), two dif-
ferences are the most evident: higher spruce repre-
sentation in operationally useable regeneration and
relatively identical representation of beech.
Game damage is defined as the browsing of ter-
minal shoot, repeated and single, peeling, fraying,
Fig. 2. Number of individuals/ha in regen-
eration height classes – pieces/ha
0
5,000
10,000
15,000
20,000
0,1 - 0,5 m 0,5 - 1,3 m 1,3 m to dbh 6,9
cm
pcs/ha
Regeneration on open space Regeneration under shelterwood
0.1–0.5 m 0.5–1.3 m 1.3 to dbh 6.9 cm
Table 3. Survey of operationally useable regeneration in total
Conditions % of plots – totally
% of plots above
700 m a.s.l.
% of plots below
700 m a.s.l.
No regeneration 41.3 (–3.8; 3.9) 44.0 (–4.1; 5.1) 37.4 (–5.8; 6.1)
Regeneration in open space 21.6 (–2.9; 3.1) 27.4 (–4.3; 4.5) 13.3 (–3.4; 4.0)
Regeneration under stand 37.3 (–3.8; 3.9) 28.6 (–4.6; 4.9) 49.3 (–6.3; 6.4)
– of that in stands over 80 years of age 20.9 (–2.8; 3.1) 16.8 (–3.3; 3.8) 28.6 (–5.0; 5.5)
Totally useable regeneration (open space +
regeneration in stands over 80 years of age)
42.5 44.2 41.9
Operationally useable regeneration includes only individuals from 0.1 m to 1.3 m
in
J. FOR. SCI., 55, 2009 (6): 279–292 285
etc., and their combination, which means that the
category of game damage is the sum of damage types
investigated during National Forests Inventory ac-
cording to its methodology.
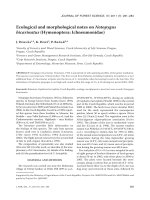
In the investigated territory regeneration damaged
by game browsing was found out on 32% of individu-
als in regeneration (type of damage, tree species, type
of regeneration and regeneration height classes were
not regarded). Of total regeneration found, 34% of
individuals were damaged in the open space and 32%
of individuals under shelterwood (see Table 5). e
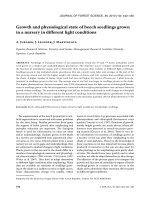
intensity of damage varied territorially (see Fig. 3).
Damage was evaluated for the particular tree spe-
cies or groups of tree species (according to their
representation in regeneration) occurring in this
area more frequently and can be compared with the
CR results (see Table 6). e tree species are grouped
in agreement with Table 1.
Spruce, the most frequently represented tree
species in regeneration, shows damage of 32% of
individuals in the investigated area (open space 34%
of damaged individuals, below the stand 32% of dam-
aged individuals) whilst average damage in the CR is
21% of damaged individuals.
Table 4. e occurrence of tree species in operationally useable regeneration (average number of individuals/ha of plot
with useable regeneration)
Species
Open space
Under stand
over 80 years of age
Average (according to share
of plot) open space + under
stand over 80 years of age
(%)
(pcs/ha)
Picea abies (L.) Karst. 4,976.0 (± 2,682.4) 21,743.4 (± 8,114.61) 12,526.9 (± 4,027.0) 74.0
Pinus sp. 119.9 (± 97.4) 35.1 (–35.1; 58.9) 81.7 0.5
Larix sp. 86.3 (± 68.5) 93.6 (–93.6; 101.3) 89.6 (± 58.8) 0.5
Picea exotics 182.2 (± 88.7) none 101.1 (± 49.6) 0.6
Quercus sp. 86.3 (± 61.6) 1,100.0 (± 924.5) 542.8 (± 418.7) 3.2
Fagus sylvatica L. 685.5 (± 557.5) 1,626.7 (± 976.5) 1,109.3 (± 535.3) 6.5
Carpinus betulus L. 28.8 (–28.8; 56.8) 187.2 (–187.2; 297.1) 100.1 0.6
Acer sp. 297.2 (± 229.6) 1,193.7 (± 840.1) 700.9 (± 399.4) 4.1
Fraxinus sp. 4.8 (–4.8; 9.5) 380.3 (–380.3; 496.9) 173.9 (–173.9; 223.3) 1.0
Betula sp. 776.6 (± 409.2) 204.8 (± 148.7) 519.1 (± 235.8) 3.1
Alnus sp. 19.2 (–19.2; 23.1) – 10.54 (–10.5; 12.7) 0.1
Populus tremula (L.) 62.3 (–62.3; 88.0) – 34.3 (–34.3; 48.3) 0.2
Salix sp. 67.1 (± 63.6) – 36.9 (± 35.0) 0.2
Sorbus aucuparia L.
1
599.2 (± 241.8) 1,293.1 (± 501.4) 911.7 (± 263.3) 5.4
Totally 7,991.3 (± 2,760.6) 27,858.0 (± 8,037.21) 16,937.9 (± 4,056.58) 100.0
1
Rowan (Sorbus aucuparia L.) is classified into the group of other deciduous tree species according to the methodology of
forest inventory
Table 5. Total damage to individuals in regeneration by game
Species
Totally Open space Under stand
number of individuals/ha number of individuals/ha number of individuals/ha
average (%) average (%) average (%)
Total regeneration 9,873.50 100.00 7,898.15 100.00 20,167.54 100.00
Game damage 3,190.74 32.32 2,688.81 34.04 6,401.83 31.74
286 J. FOR. SCI., 55, 2009 (6): 279–292
Fig. 3. Damage to regeneration
– all tree species
Double-plot – no regeneration
Single-plot – damage 0–17%
Single-plot – damage 17–35%
Single-plot – damage 35–100%
Table 6. Damage to tree species (comparison with results of National Forest Inventory in the CR)
1
st
measurement
in investigated area
2
nd
measurement
in investigated area
In CR from Forests Inventory
Tree species number error number error number error
Picea abies (L.) Karst. 31.9 –1.2 1.2 16.9 –1.9 2.0 21.0 –0.3 0.3
Abies alba Mill. – – – 0.0 – 97.5 34.4 –2.2 2.2
Pinus sp. 16.7 –11.0 18.1 0.0 – 26.5 18.8 –1.1 1.1
Larix sp. 45.9 –9.1 9.3 32.8 –11.5 13.2 29.3 –2.4 2.5
Pinus mugo Turra 12.5 –10.9 25.8 11.1 –10.8 37.1 23.3 –13.4 19.0
Pseudotsuga menziesii (Mirbel)
Franco
– – – – – – 30.0 –9.2 10.6
Abies grandis (D. Don) Lindl. – – – – – – 13.2 –8.7 14.9
Picea exotics 18.3 –6.6 8.3 11.3 –6.3 9.7 13.9 –3.4 4.0
Other coniferous species – – – – – – 11.1 –8.8 18.0
Quercus sp. 12.4 –3.6 4.4 12.1 –5.9 8.5 26.3 –0.5 0.5
Quercus rubra L. 0.0 – 97.5 50.0 –48.7 48.7 22.6 –1.6 1.7
Fagus sylvatica L. 26.8 –3.4 3.6 25.7 –4.1 4.4 21.2 –0.5 0.5
Carpinus betulus L. 11.1 –6.2 9.6 30.4 –12.7 15.3 49.3 –0.8 0.8
Acer sp. 19.7 –3.2 3.5 41.8 –6.4 6.6 36.5 –0.5 0.5
Fraxinus sp. 54.7 –8.1 7.9 67.4 –8.4 7.7 40.2 –0.7 0.7
Ulmus sp. 100.0 –97.5 – – – – 54.3 –3.5 3.5
Robinia pseudoacacia L. – – – – – – 22.3 –5.0 5.7
Betula sp. 8.8 –2.4 3.0 2.7 –1.5 2.6 18.3 –0.8 0.8
Alnus sp. 36.2 –13.5 15.3 20.0 –17.5 35.6 26.8 –2.8 2.9
Tilia sp. – – – 66.7 –57.2 32.5 30.4 –1.8 1.8
Populus tremula L. 5.9 –5.7 22.8 0.0 – 97.5 40.3 –1.8 1.9
Populus sp. – – – – – – 22.0 –10.5 14.0
Salix sp. 5.6 –5.4 21.7 25.0 –24.4 55.6 37.0 –3.8 3.9
Other deciduous 65.8 –3.5 3.4 42.0 –5.1 5.2 55.3 –0.7 0.7
Coniferous trees 31.8 –1.1 1.2 17.1 –1.8 1.9 21.3 –0.3 0.3
Deciduous trees 31.9 –1.7 1.7 30.7 –2.2 2.3 34.4 –0.2 0.2
Total 31.9 –0.9 1.0 24.0 –1.5 1.5 29.8 –0.2 0.2
J. FOR. SCI., 55, 2009 (6): 279–292 287
Damage of beech amounts to 27% of individuals
in the investigated area, average for the CR is 20%
of damaged individuals. This tree species shows
a marked difference in damage between the open
space and under shelterwood (damage of 67% indi-
viduals in the open space, under shelterwood 13% of
individuals). is was confirmed also by the investi-
gation in the Fláje preserve; game were much more
interested in beech individuals in the open space
and from planting than those regenerated naturally
below the stand.
e greatest damage by browsing occurs in the
other deciduous tree species, represented by more
than 95% of rowan in the investigated area. Damage
was found out on 65% of individuals whilst the CR
average is 41%.
Of other important tree species represented in
regeneration 19% of individuals of blue spruce are
damaged, especially their annual shoots are browsed
in the initial growth period. Due to the good regen-
eration ability of this species this damage is removed
quickly, and the individuals keep their upright
growth. Birch regeneration was damaged in 9% of
individuals within the investigated area.
Distribution of damage is remarkable when regen-
eration height classes are considered.
e survey (Table 7) shows that individuals from
0.5 m to 1.3 m (44 to 49%) are damaged to the great-
est extent and individuals over 1.3 m to a lesser ex
-
tent. No marked difference occurs in damage of the
particular height classes between the open space and
under shelterwood.
e repeated investigation in the Krušné hory Mts.
revealed a very serious failure of regeneration both
under shelterwood and in the open space. Out of the
average 9,787 individuals/ha only 2,996 individuals
persisted in regeneration during the repeated inves-
tigation (see Fig. 4).
Combining meteorological data and forest ex-
periences it is obvious that the extremely high re-
generation values in 2001 and 2002 were caused by
the coincidence of seed year and suitable climatic
conditions (see Table 8).
Krušné hory Mts. – peeling
Peeling and browsing are defined as the overall
damage to the bark and phloem of growing trees
caused by red deer feeding; peeling, i.e. the ripping of
phloem and bark strips lengthwise, can be done only
during the mobilization phase of tree species growth
in early spring and during the vegetation period.
Browsing appears mostly in winter; there are seen
teeth on the attacked plant part. Peeling and brows-
ing are classified into one category. During fraying
trees are damaged by antlers of ungulate game.
e assessment of peeling and browsing intensity
was carried out in two categories including individu-
als with dbh from 7 cm to 11.9 cm and individuals
with dbh from 12 cm to 20 cm. Individuals with dbh
Table 7. Damage to the particular height classes of total regeneration
Height class
Open space Under stand Totally
% of damaged individuals
From 0.1–0.5 m 32.77 30.73 31.02
0.5–1.3 m 43.58 49.30 45.60
1.3 m up to dbh 6.9 cm 25.60 31.62 27.51
Fig. 4. Reduction of regen-
eration during repeated
measurement
Non-forest
No change in presence of regeneration
Presence of regeneration only by 1
st
measurement
Presence of regeneration only by 2
nd
measurement
288 J. FOR. SCI., 55, 2009 (6): 279–292
over 20 cm were not evaluated because they do not
reflect the present state of damage by browsing and
peeling. Results are presented in Table 9.
Fraying was assessed for the category of regenera-
tion individuals in the height class from 1.3 m to dbh
6.9 cm. e total proportion of individuals damaged
by fraying (in this category) approaches 10% (8.2%
of damaged individuals). Of that the proportional
share of the other deciduous tree species (33.1% of
individuals) and larch (19.7% of individuals) is the
highest whilst fraying of the basic tree species spruce
is around 1% of individuals.
During the repeated investigation peeling re-
mained nearly unchanged.
e maps were processed aimed at summarizing the
damage (browsing, peeling) and at expressing both
types of damage together. As average values from the
preceding maps of browsing and peeling were used as
a basis, damage is not expressed in degrees but only
territories with lower, mean and higher degree of
damage are connected informatively (Fig. 5).
Fláje preserve
Game damage in the Fláje preserve was measured
in the framework of the project Game Impact on For-
est Ecosystems in the Krušné hory Mts. e primary
aim was to investigate a variety of impacts on the
ecosystem inside the preserve designated for game
in the whole territory of the Krušné hory Mts. In the
framework of this project the existing network of for-
est inventory in the CR was deepened and the results
became more provable. A more detailed investiga-
tion of game damage was carried out in the Fláje
preserve during the second measurement in order
to compare damage in this territory (higher load and
game presence) with the rest of the territory.
e determined original 9 points of inventory in
forests comprised 12 subplots while 6 of them were
with regeneration (during the first measurement –
5 subplots). e calculation for the needed number
of plots was based on the first measurement, i.e. on
the measurement of forest inventory. e aim was
to reduce the interval estimation so that the relative
error did not approach 100%, as it was in the majority
of measured variables of regeneration. Due to tens
of trees measured in the given territory results for
peeling were more qualified.
To improve the results additionally 56 plots with
regeneration (in total 64 plots, or 79 subplots, of
which 46 with regeneration) and 18 plots with re-
gard to peeling (totally 26 plots) were measured.
Another outside investigation was realized in 2007
(2 weeks).
Results show a distinct reduction in relative errors
of measured variables, for example for the occur-
Table 8. Development of regeneration
Conditions
Repeated investigation National Forest Inventory
p (%) error p (%) error
No regeneration 50.0 –4.2 4.2 29.9 –3.4 3.6
Regeneration in open space 23.1 –3.3 3.5 30.6 –3.4 3.6
Regeneration under shelterwood 26.9 –3.7 3.9 39.5 –3.9 4.0
Totally 100.0 100.0
Double-plot – no regeneration
Single-plot – lower damage
Single-plot – middle damage
Single-plot – higher damage
Fig. 5. Damage by game – combination of
browsing and peeling – all tree species
J. FOR. SCI., 55, 2009 (6): 279–292 289
Table 9. Damage caused by fraying, peeling and browsing of ungulate game
Type and volume of damage
From dbh 7.0–11.9 cm From dbh 12–20 cm
damage error damage error
All tree species
stem without damage 69.5 –3.8 3.6 66.7 –1.3 1.3
damage up to 1/8 of stem girth 3.7 –1.3 1.8 6.1 –0.6 0.7
damage over 1/8 of stem girth 26.8 –3.4 3.7 27.3 –1.2 1.2
totally 100.0 100.0
Conifers
stem without damage 56.3 –5.6 5.5 52.6 –1.7 1.7
damage up to 1/8 of stem girth 5.7 –2.3 3.1 8.2 –0.9 1.0
damage over 1/8 of stem girth 38.1 –5.4 5.6 39.1 –1.6 1.6
totally 100.0 100.0
Broadleaves
stem without damage 83.1 –4.7 4.0 93.2 –1.3 1.1
damage up to 1/8 of stem girth 1.6 –1.1 2.1 1.8 –0.6 0.7
damage over 1/8 of stem girth 15.3 –3.8 4.5 5.0 –1.0 1.1
totally 100.0 100.0
Picea abies (L.) Karst.
stem without damage 33.9 –6.7 7.2 36.4 –1.9 1.9
damage up to 1/8 of stem girth 7.9 –3.4 4.8 11.0 –1.2 1.3
damage over 1/8 of stem girth 58.2 –7.4 7.1 52.6 –2.0 2.0
totally 100.0 100.0
Larix sp.
stem without damage 75.6 –15.1 11.6 97.1 –1.8 1.3
damage up to 1/8 of stem girth 4.4 –3.9 10.7 0.8 –0.6 1.2
damage over 1/8 of stem girth 20 –10.4 14.6 2.1 –1.0 1.6
totally 100.0 100.0
Picea exotics
stem without damage 98.5 –6.7 1.5 97.9 –2.7 1.4
damage up to 1/8 of stem girth 1.5 –1.5 6.7 0.8 –0.7 2.1
damage over 1/8 of stem girth 0 1.2 –1.0 2.3
totally 100.0 100.0
Fagus sylvatica L.
stem without damage 100.0 –13.7 0.0 0.0
damage up to 1/8 of stem girth 0.0 0.0
damage over 1/8 of stem girth 0.0 0.0
totally 100.0 100.0
Betula sp.
stem without damage 100.0 –2.0 0.0 99.9 –0.4 0.1
damage up to 1/8 of stem girth 0.0 0.1 –0.1 0.4
damage over 1/8 of stem girth 0.0 0.0
totally 100.0 100.0
Other deciduous tree
species
stem without damage 25.4 –9.8 12.1 50.8 –6.5 6.4
damage up to 1/8 of stem girth 4.5 –3.5 8.1 12.7 –3.9 4.8
damage over 1/8 of stem girth 70.1 –12.4 10.6 36.5 –6.0 6.4
totally 100.0 100.0
290 J. FOR. SCI., 55, 2009 (6): 279–292
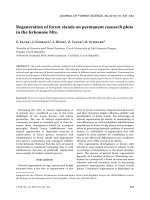
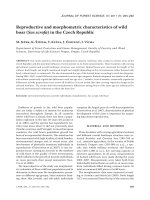
rence of regeneration on the plot from min. 70% to
min. 26%. Regeneration in the open space in Fláje
preserve is high – 46.3% in contradiction with 23.1%
in the whole territory of the Krušné hory Mts. Re-
generation under shelterwood is 13.1% and 40.3% of
plots are without regeneration (see Table 10).
Artificial regeneration in the preserve (41.9%) fully
prevails over natural regeneration (15.7%). However,
the whole territory of the Krušné hory Mts. shows the
opposite trend (artificial – 16.3%, natural – 30.9%).
Except for the lower species richness there is a high
representation of spruce exotics (18.0%).
e high proportion of beech in the preserve must
be taken cautiously; beech occurs only on a small
amount of plots along a stream but in abundance
which causes a high relative error.
A high proportion of protective measures was
found out in the preserve – 17.2% compared to the
whole territory 6.5%.
e regeneration damaged by browsing is pro-
portionally higher in the preserve than in the whole
territory of the Krušné hory Mts. (see Table 11).
If the original nine points of forest inventory are
taken for a basis and if the first and second measure-
ments are compared, it is interesting that very high
damage to regeneration is observed ranging from
original 19% (in 2002) to 58% (in 2006). When the
number of measurements is higher, then the final
result is lower, although similar – 51%.
In total more trees damaged by peeling are in the
preserve – by more than 10% – than in the whole
territory of the Krušné hory Mts.
Table 10. Regeneration on subplots
Conditions
Fláje preserve Krušné hory Mts.
average
negative
error
positive
error
average
negative
error
positive
error
No regeneration 40.7 –11.3 12.0 50.0 –4.2 4.2
Regeneration in open space 46.3 –11.6 11.8 23.1 –3.3 3.5
Regeneration under shelterwood 13.1 –7.1 10.6 26.9 –3.7 3.9
Totally 100.0 100.0
Totally is the sum of rounded values
Table 11. Total damage to regeneration by game
Type
Fláje preserve Krušné hory Mts.
average (pcs/ha) (%) average (pcs/ha) (%)
Total regeneration 2,236 100 2,996 100
Game damage 1,148 51 834 28
e Institute of Forest Ecosystem Research (IFER)
has conducted a survey of game damage at the na-
tional level in the five-year cycle since 1995. Random
sample of the sample plots is designed especially for
the whole area of the Czech Republic (three-stage
sampling). e results for the smaller area are not
possible (Č et al. 2002).
e last measurement was done in 2005. Sample
localities are 1.41 × 2.82 km. ere are 6 localities of
this type in the survey area of the Krušné hory Mts.
Total damage to regeneration is 34.43%, which is not
far from the result obtained from NFI measurements,
i.e. 32.32%. e methods are different mainly in the
forms of sampling individuals of regeneration, when
the targeted sampling by major tree species (spruce,
pine, beech, oak) was used (Č et al. 2007).
Another method of monitoring the activity of
game is the method of control fences (Decree No.
101/1996 of the Ministry of Agriculture), which was
modified by IFER in 1998. e development of veg-
etation cover inside and outside the fence was evalu-
ated. A similar method is used in Saxony (Germany),
where this method encounters practical difficulties
in the interpretation. is method is significantly
different by its nature from the investigation of Na-
tional Forest Inventory.
In Saxony, the other method has successfully been
applied. It is presented in the regulations concerning
the assessment of the forest vegetation status, dam-
age caused by grazing and peeling and restoration
of forest (VERWALTUNGSVORSCHRIFT 2000).
It is the methodics with targeted sampling again,
J. FOR. SCI., 55, 2009 (6): 279–292 291
where is selected one stand for the measuring of the
regeneration and one stand for peeling on 100 ha.
7–10 temporary sample plots are located in sample
stands (VERWALTUNGSVORSCHRIFT 2000). e
result is then taken into account by approving the
plan of hunting.
e methodology for Inventory of Game Damage
in the Smaller Territorial Units was designed by
IFER. e measuring was realized in two different
regions – Bruntál and Vlašim. e method is differ-
ent in the selection of sample plots. e intensity of
selection is greater by IFER and the results have a
smaller standard deviation (B et al. 2005).
Still, I tried to compare concrete results. I took
the results only from Vlašim. ere are 900 sample
plots with 10,649 individuals from measuring by
IFER and 71 inventory sample plots (94 subplots, i.e.
70 subplots with regeneration, i.e. 2,036 individu-
als) from National Forest Inventory. Damage to the
terminal shoot for all species: IFER 19%, NFI 25%.
But the damage is 19.5% when only the individuals
of regeneration in the open space are taken from
the database. e regeneration in the open space
corresponds better with the regeneration defined in
this project. When I take only the regeneration in the
open space, then I also get a similar result for spruce,
i.e. 18%. For beech, there is a larger difference:
IFER 24%, NFI 11%.
e methods are not equivalent. It can be simply
said that where the possibilities of National Forest
Inventory for the evaluation end, there comes the
Inventory of Game Damage in the Smaller Territo-
rial Units.
CONCLUSION
Results from National Forests Inventory can be
used for the evaluation of game damage in a small
territory like the Krušné hory Mts. eir interpreta-
tion can bring a lot of interesting knowledge. Needed
information can be acquired even for smaller areas
by suitable completion of measurements.
e original database was assessed and the follow-
ing results were obtained:
– Regeneration was found out on 70.1% of plots.
Norway spruce with its 52.8% has the highest
representation, followed by birch 13.8%, the other
tree species (mainly rowan) 13.8% and beech
7.4%.
– Operationally useable regeneration occurred only
on 26.8% of plots and its volume did not princi-
pally differ from localities below 700 m a.s.l. and
above 700 m a.s.l. e distribution of operation-
ally useable regeneration is different, on plots be-
low 700 m a.s.l. operationally useable regeneration
prevails under the stand and on plots above 700 m
a.s.l. in the open space.
– Total damage to regeneration in the Krušné hory
Mts. was 32.3% (there was no principal difference
in damage between plots under shelterwood and
in the open space). When compared with data
for the whole CR, regeneration damage in the
Krušné hory Mts. is higher. e most damaged
was rowan.
– The repeated investigation showed a marked
reduction in individuals in regeneration, total
regeneration damage by game decreased to 28%.
– Damage by peeling and fraying was observed in
the category from height 1.3 m to dbh 6.9 cm
– 13.4%, in the category from dbh 7–11.9 cm
– 30.5% and in the category from dbh 12–20 cm
– 33.3%. No important change was found out dur-
ing the repeated investigation.
– A higher number of regeneration individuals
was found in the Fláje preserve during repeated
investigation in comparison with the rest of the
investigated territory. In the course of five years, in
relation to the original points and on the basis of
a new investigation, an increase in game damage
was observed.
40.7
13.1
46.3
23.1
26.9
50
0
10
20
30
40
50
60
No regeneration Regenaration on
open space
Regenaration under
shelterwood
(%)
Fláje Total area
Fig. 6. Comparison of regeneration in
the Krušné hory Mts. and Fláje preserve
No regeneration Regeneration in Regeneration under
open space shelterwood
292 J. FOR. SCI., 55, 2009 (6): 279–292
References
AKÇA
A., 1997. Waldinventur. Göttingen, Cuvillier Verlag:
140.
BERANOVÁ J., ČERNÝ M., PAŘEZ J., VOPĚNKA P., 2005.
Inventarizace škod zvěří na menších územních celcích.
Lesnická práce, 84: 18–20.
ČERNÝ M., BERANOVÁ J., HOLÁ Š., 2002. Inventarizace
škod zvěří v roce 2000. Lesnická práce, 81: 3.
ČERNÝ
M. et al., 2007. Inventarizace škod zvěří na lesních po-
rostech a zemědělských kulturách (lesnická část). [Zpráva
o průběhu řešení v roce 2005–2006.] Jílové, IFER – Ústav
pro výzkum lesních ekosystémů, s. r. o.: 47.
HOLICKÝ, J., 2002. Inventarizace lesů v České republice I.
Lesnická práce, 81: 152–153.
LANGSAETER A., 1926. Om beregning av middelfeilen ved
regelmessige linjetaksering. Meddelelser fra det Norske
Skogforsøksvesen, 2: 5–47.
LANGSAETER A., 1932. Nøiaktigheten ved linjetaksering
av skog, I. Meddelelser fra det Norske Skogforsøksvesen,
4: 431–563.
LINDEBERG J.W., 1924. Über die Berechnung des Mittelfeh-
lers des Resultates einer Linientaxierung. Acta Forestalia
Fennica, 25: 22.
LINDEBERG J.W., 1926. Zur eorie der Linientaxierung.
Acta Forestalia Fennica, 31: 1–9.
LOETSCH F., ZÖHLER F., HALLER K., 1973. Forest Inven-
tory. Vol. I–II. BLV Verlaggesellschaft: 469.
ÖSTLING J., 1932. Erforderlig taxeringsprocent vid linjetaxe-
ring av. skog. Sveriges Skogsvårdsföreningens Tidskrift, 30.
SLODIČÁK M., BALCAR V., NOVÁK J., ŠRÁMEK V. et al.,
2008. Lesnické hospodaření v Krušných horách. Hradec
Králové, Edice grantové služby LČR: 480.
ŠMELKO
Š., 2000. Dendrometria. Zvolen, Vydavateľstvo TU
vo Zvolene: 399.
ÚHÚL, 2003. Inventarizace lesů, Metodika venkovního sběru
dat. Brandýs nad Labem, ÚHÚL: 136.
ÚHÚL, 2003. Inventarizace lesů, pracovní postupy (kancelářské
práce, venkovní práce). Brandýs nad Labem, ÚHÚL: 90.
ÚHÚL, 2007. Národní inventarizace lesů v České republice
2001–2004. Úvod, metody, výsledky. Brandýs nad Labem,
ČTK REPRO, a. s.: 224.
VERWALTUNGSVORSCHRIFT
des Sächsischen Staatsmini-
steriums für Umwelt und Landwirtschaft für die forstlichen
Gutachten über den Vegetationszustand, entstandene Ver-
biss- und Schälschäden und den Stand der Waldverjüngung
(VwV Forstgutachten) vom 4. April 2000 (SächsABl.S.398).
ZACH J., 2004. Inventarizace lesů v České republice. Sou
-
bor matematicko-statistických metod. [Interní materiál
ÚHÚL.] 233.
ZÖHLER
R., 1980. Forstinventur. Hamburg, Berlin, Verlag
Paul Parey: 207.
Received for publication September 26, 2008
Accepted after corrections November 24, 2008
Corresponding author:
Ing. L L, Ústav pro hospodářskou úpravu lesů Brandýs nad Labem, pobočka Plzeň,
Náměstí Generála Píky 8, 301 58, Plzeň-Slovany, Česká republika
tel.: + 420 373 729 990, fax: + 420 373 729 995, e-mail:
Obnova a škody zvěří v Krušných horách z měření Národní inventarizace lesů
České republiky
ABSTRAKT: V letech 2001–2004 proběhla v České republice Národní inventarizace lesů. Měřením celé řady veličin
vznikla rozsáhlá informační databáze využitelná pro hodnocení stavu a vývoje různých kvantitativních a kvalitativních
dendrometrických veličin. V práci jsou prezentovány výsledky zjištění stavu obnovy a škod zvěří v Krušných horách
na podkladě údajů Národní inventarizace lesů a druhého měření provedeného po pěti letech, které bylo v části obory
Fláje rozšířeno pro základní srovnání se zbytkem území. Ve výpočtech z dat starého i nového měření bylo použito
standardní metodiky použité při zpracování dat Národní inventarizace lesů. Srovnáním se zjistilo, že průměrný
počet jedinců obnovy v intervalu pěti let klesl více než o třetinu, klesl počet ploch s obnovou a kleslo i poškození
obnovy zvěří o 4 %. Podíl jedinců poškozených loupáním se za sledované období nezměnil. V oboře Fláje byl zjištěn
výrazný nárůst škod zvěří na obnově.
Klíčová slova: Národní inventarizace lesů; škody zvěří; Krušné hory