Báo cáo lâm nghiệp: "Soil characteristics under selected broadleaved tree species in East Norwa" docx
Bạn đang xem bản rút gọn của tài liệu. Xem và tải ngay bản đầy đủ của tài liệu tại đây (476.4 KB, 12 trang )
J. FOR. SCI., 56, 2010 (7): 295–306 295
JOURNAL OF FOREST SCIENCE, 56, 2010 (7): 295–306
e vegetation cover interacts with a wide range of
soil properties and feedback mechanisms are found
(B et al. 1995; B, G 1998). e
effect of particular soil properties on tree species has
been recognized for a long time (S, S
1934; B et al. 1992) and stands of conifers and
broadleaved trees are found to influence mineral soil
properties and/or forest floor characteristics differ-
ently (B et al. 1995; V, R-R-
1998). Forest trees also modify the stand
climate. Moreover, forests are often characterized
by well-developed O horizons, high water use and
net primary production along with, in non-tropi-
cal areas, large allocation of C to the soil (L,
W 1990). Even though tree species may grow
and survive in a wide range of soils and climates
strong relationships are normally found between
species composition and site class.
Although some Norwegian forest site evaluations
have been performed (T 1977; T 1999),
Soil characteristics under selected broadleaved tree
species in East Norway
K. R
1
, O. H
2
, A. S
3
, K. S
4
1
Faculty of Forestry and Wood Technology, Mendel University in Brno, Brno, Czech Republic
2
Norwegian University of Life Science, Ås, Norway
3
Department of Forest- and Natural Resource Policy, Ministery of Agriculture and Food,
Oslo, Norway
4
Faculty of Regional Development and International Studies, Mendel University in Brno,
Brno, Czech Republic
ABSTRACT: Comprehensive analyses of soil properties of sites of native Scandinavian broadleaved tree species were
performed in 36 habitats in East Norway. e material consisted of stands of silver birch (Betula pendula Roth.), white
birch (Betula pubescens Ehrh.), black alder (Alnus glutinosa Gaertn.), speckled alder (Alnus incana Moench.), Euro-
pean ash (Fraxinus excelsior L.), pedunculate oak (Quercus robur L.) and sessile oak (Quercus petraea [Matt.] Liebl.).
e main objective was to describe the vertical characteristics and variations in some selected soil variables of the soil
profiles. Particular soil horizons of 15 Brunisolic soils, 11 Regosolic soils, 6 Gleysolic and 4 Podzolic were sampled and
analyzed for soil texture, bulk density, specific density, porosity, oxidizable carbon, total nitrogen content, pH in water,
exchangeable acidity, exchangeable cations and anions (Mg, Ca, Mn, Al, S, Fe, B, P and K), cation exchange capacity
and base saturation. No regular patterns were found in selected soil properties when tested between various soil units
in silver birch stands. Furthermore, silver birch stands were found on sites, which topsoil (i) significantly differed in
their cation exchange capacities, (ii) did not differ significantly in their pH values, and (iii) mostly differed in their clay
contents and (iv) mostly did not differ in BS. Differences among the Humic Regosols, Luvic Gleysols, Sombric Brunisols,
Eutric Brunisols and Humo-Ferric Podzols for silver birch stands in their topmost horizons of humified organic matter
intimately mixed with the mineral fraction horizons and differences among particular soil horizons for the main soil
properties under all the selected broadleaved tree species stands are discussed.
Keywords: broadleaved forest stands; forest soils; soil chemistry; soil classification; soil properties
Supported by the Norwegian Research Council, Project No. 115143/111.
296 J. FOR. SCI., 56, 2010 (7): 295–306
these studies have not had special emphasis on soil
characteristics per se in broadleaved stands. To our
knowledge, such in-depth studies of Norwegian de-
ciduous forest types are lacking. is study was de-
signed to investigate not only the properties of soils
under broadleaved tree species but also to refer to
the likely patterns in selected soil properties among
different soil units in silver birch (Betula pubescens
Ehrh.) stands. In addition to the purely descriptive
potential, such data is also thought to be important
in a wider perspective, e.g. for studies focusing on
mineral status and decomposition dynamics of or-
ganic matter in forest soils (C et al. 2005;
D et al. 2005), and interrelationships between
trees and soils (V, R-R
1998). In this study detailed information of physical
and chemical soil properties, their vertical charac-
teristics and quantitative variations, are presented
for 36 broadleaved stands in East Norway.
MATERIALS AND METHODS
e study was focused on six broadleaved tree
species: silver birch (Betula pendula Roth.), white
birch (Betula pubescens Ehrh.), black alder (Alnus
glutinosa Gaertn.), smeckled alder (Alnus incana
Moench.), European ash (Fraxinus excelsior L.) and
pedunculate oak (Quercus robur L.). In total, 74 ex-
perimental sites of naturally occurring pure stands
of native Scandinavian deciduous tree species were
studied. However, only sites having minimally three
of the same soil units (N = 36) could be treated sta-
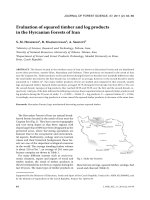
tistically and chosen to be reported here. e study
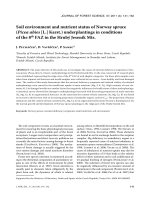
area was located in East Norway (Fig. 1).
e soil classification was performed according to
the Canadian System of Soil Classification (1998). Soils
were classified in great soil groups where up to ten dif-
ferent horizons were described. Different tree species
tended to some extent to occupy habitats with different
soil types (Table 1). To reflect spatial variation in the soil
a design-based sampling was used. An extensive pool-
ing of the soil samples, both from the different walls in
the profile together with the same horizons from the
sub-pits. e subsoil was sampled from one deep soil
pit, whereas the topsoil was sampled from the central
soil pit and four shallow sub-pits. us, three individual
soil samples for particular subsoil horizons and seven
individual soil samples for particular topsoil horizons
were taken at each study plot.
Twenty basic soil properties were determined in
each soil sample and analyzed according to O et
al. (1991). Soil physics and chemistry were described
Southern Norway
East
km
0 100 200 300 400 500
Fig. 1. Location of the study area in East Norway
Table 1. Number of study plots of dierent tree species and soil groups
Soil great group
Tree species
Bpe Bpu Agl Ain Fex Qro Sum
Humic Regosol 3 1 6 1 11
Luvic Gleysol 2 3 1 6
Sombric Brunisol 4 1 1 6
Melanic Brunisol 3 3
Eutric Brunisol 6 6
Humo-Ferric Podzol 4 4
Sum 22 1 5 1 6 1 36
Bpe –Betula pendula; Bpu – Betula pubescens; Agl – Alnus glutinosa; Ain – Alnus incana; Fex – Fraxinus excelsior; Qro
– Quercus robur
J. FOR. SCI., 56, 2010 (7): 295–306 297
by particle size analyses (clay < 0.002 mm; silt 0.002 to
0.06 mm; sand 0.06 to 2.0 mm; gravel > 2.0 mm), bulk
density, specific density, porosity, C
ox
and N
t
, C:N ratio,
active soil reaction (pH/H
2
0), exchangeable acidity in
the 1M NH
4
NO
3
extract, exchangeable cations and
anions (Mg, Ca, Mn, Al, S, Fe, B, P and K) by the ICP
techniques in the same extract, cation exchange capac-
ity (CEC) and base saturation (BS). All analyses were
performed for each particular soil horizon: the main
horizons to focus on were selected in the compliance
with the stratigraphy of particular soil units.
e data were statistically treated by Shapiro-Wilk
test of normality and analysis of variance. Confi-
dence intervals for t-scores means and medians were
computed by multisample data using the binomial
distribution. e comparison of soil characteristics
between two horizons were carried out by separate
variance t- and F-tests. The comparisons among
more horizons were performed by homogeneity
of variance tests, ANOVA and Tukey-HSD multi-
ple comparisons (J et al. 1987; W
2001). Using 0.05% as the limit of significance, sig-
nificantly different pairs and homogeneous subsets
were targeted. Non-parametric Cochran test for
analyzing randomized complete block designs with
the response variable as binary variable (K,
S 1979), were commonly used in the statistical
treatment. Cochran’s test for homogeneity of vari-
ances for equal or unequal sample sizes is based on
Cochran’s cumulative distribution function (cochcdf)
and expressed by Cochran’s C significance. Estimat-
ing differences within the selected soil properties, the
initial data from nineteen soil profiles in silver birch
stands were used for multiple comparisons of A/A2.
Differences in selected soil variables were tested us-
ing great soil groups (N = 5) as independent variables
and soil variables (N = 7) in particular soil horizons
as dependent variables. e minimum number of
study plots for particular great soil group tested
was four (N > 4). Where only two sets of data were
available, the soil properties selected were treated on
the level of t- and F-tests. Where three or more set
of data were available, 2-Tail Probability (P(2-tail)),
Right-Tail Probability (PNorm) and Cochran’s C sig-
nificance were given.
RESULTS AND DISCUSSION
Results of soil physical and chemical properties
from 11 Humic Regosols (Table 2; RN according to
N et al. 2001), 6 Luvic Gleysols (Table 2; PG
according to N et al. 2001), 15 Brunisols (Ta-
bles 2 and 3; KA according to N et al. 2001)
and 4 Podzols (Table 3; PZ according to N et
al. 2001) under selected broadleaved tree species in
East Norway are reported.
Humic Regosol
H horizons
With respect to soil reaction, Humic Regosols
showed moderately acid surface organic Layer
with pH 5.94. The amount of nitrogen in these
soils displayed high share, equally with high con-
tents of phosphorus (244.9 mmolkg
–1
), sulphur
(2.24 mmolkg
–1
) and very high C:N ratio (~30). On
the contrary, there were low amounts of potassium,
calcium and magnesium. e mean nitrogen content
reached 1.62%, the mean C:N 30 where the SD value
of nitrogen is 1.7 and SD of C:N is 3.6. Comparing the
findings with an evaluation of organic surface layer
on shallow silicate soils (W 2005) and an evalu-
ation of highly productive forest ecosystems devel-
oped on pure skeletal detritus (R et al. 2002),
the results indicate favourable growth conditions for
deciduous tree species. is suggests that there is a
high rate of dead organic matter mineralization.
A horizons
Sandy particles showed a high share of the various
particle size classes (58.9%). e concentration of
potassium was very high, the concentrations of cal-
cium and magnesium low. Both the cation exchange
capacity and the C:N ratio were high.
C horizons
An evaluation of physical and chemical properties is
of limited value due to the likely very different origin
and characteristics of the pedogenetic substrates of the
soils even though physical characteristics of C horizon
are important for the water supply and chemical ones
for nutrient supply. However, low amounts of clay, fa-
vourable porosity and the moderately acid conditions
showing high BS (71.04 mmolkg
–1
) were found.
Generally, Humic Regosols showed prominent
signs of an intensive humification on weathered
rock. is is in contrast to findings by S
et al. (2004) performed in medium textured Dystric
Regosol at North Savo Research Station (63°10'N,
27°18'E), Finland even when such study plots were
situated in much colder climate.
Luvic Gleysol
O horizons
Very high nitrogen (2.26%), phosphorus
(235.5 mmolkg
–1
) and sulphur (1.44 mmolkg
–1
)
contents were found compared to findings of K
298 J. FOR. SCI., 56, 2010 (7): 295–306
Table 2. Physical and chemical characteristics of Humic Regosols, Luvic Gleysols and Melanic Brunisol, East Norway
(B) Soil chemistry
Horizon
(cm)
pH C:N
CEC
exchangeable
acidity
BS N
t
Ca P K Mg S
(mmolkg
–1
) (%) (mmolkg
–1
)
Humic Regosols (N = 11)
H (3–6)
6.0 ± 0.6 30 ± 3.6 143 ± 65 17 ± 7.5 88 ± 3.1 1.6 ± 1.7 89 ± 33 245 ± 128 22 ± 25 15 ± 9.6 2.2 ± 2.7
A (6–30)
5.0 ± 0.7 22 ± 5.6 114 ± 69 15 ± 6.2 87 ± 14 1.1 ± 0.7 82 ± 54 59 ± 47 6.8 ± 4.4 11 ± 7.9 1.0 ± 0.5
C (30 →)
5.5 ± 0.7 21 ± 16 62 ± 62 18 ± 4.6 71 ± 29 0.1 ± 0.1 41 ± 58 2.3 ± 4.8 1.2 ± 1.0 6.7 ± 7.4 0.3 ± 0.5
Luvic Gleysols (N = 6)
O (0–1)
5.6 ± 0.3 22 ± 4.9 147 ± 72 24 ± 12 83 ± 1.1 2.3 ± 0.8 79 ± 35 236 ± 67 27 ± 28 14 ± 7.7 1.4 ± 0.6
A1 (1–18)
4.5 ± 0.5 18 ± 4.6 51 ± 20 13 ± 6.1 74 ± 16 0.7 ± 0.7 26 ± 15 35 ± 55 5.7 ± 1.9 5.3 ± 3.8 1.0 ± 0.4
A2 (18–42)
5.2 ± 0.2 14 ± 3.0 34 ± 17 13 ± 5.4 63 ± 22 0.1 ± 0.1 15 ± 11 1.7 ± 1.7 3.7 ± 1.6 2.3 ± 1.5 0.4 ± 0.3
B (42–90)
5.4 ± 0.6 19 ± 5.7 47 ± 41 13 ± 2.1 73 ± 28 0.0 ± 0.0 31 ± 31 2.0 ± 1.2 3.6 ± 1.4 8.7 ± 9.7 0.2 ± 0.3
C (90 →)
5.6 ± 0.5 54 ± 34 46 ± 44 14 ± 1.7 71 ± 8.7 0.0 ± 0.0 31 ± 34 2.5 ± 1.6 3.8 ± 2.2 6.7 ± 6.9 0.3 ± 0.3
Melanic Brunisol (N = 3)
A (2–19)
4.9 ± 0.4 15 ± 2.4 56 ± 22 6.5 ± 3.1 88 ± 31 0.3 ± 0.0 32 ± 46 6.2 ± 1.0 3.6 ± 0.9 12 ± 8.7 1.1 ± 1.1
B (19–49)
4.9 ± 0.2 15 ± 3.3 12 ± 7.6 2.2 ± 0.9 82 ± 25 0.1 ± 0.0 3.6 ± 6.1 1.3 ± 1.0 1.1 ± 0.2 4.5 ± 4.2 0.8 ± 0.8
BC (49–75)
4.7 ± 0.6 17 ± 8.7 24 ± 0.5 8.9 ± 4.0 63 ± 15 0.0 ± 0.1 5.0 ± 7.1 0.6 ± 0.6 1.2 ± 0.1 8.6 ± 11 0.9 ± 1.1
C (75 →)
5.3 ± 0.7 26 ± 20 34 ± 26 7.7 ± 3.1 77 ± 39 0.0 ± 0.0 3.0 ± 5.1 1.7 ± 0.9 1.6 ± 1.3 21 ± 33.5 1.0 ± 1.0
(A) Soil physics
Horizon
(cm)
< 0.002 0.002–0.06 0.06–2.0 > 2.0 Porosity
Bulk density
(gcm
–3
)
(%)
Humic Regosols (N = 11)
A (6–30)
6.3 ± 3.7 35 ± 8.4 59 ± 14 16 ± 8.0 58 ± 5.3 1.1 ± 0.1
C (30 →)
8.6 ± 7.3 40 ± 17 52 ± 24 30 ± 26 49 ± 4.3 1.4 ± 0.1
Luvic Gleysols (N = 6)
A2 (18–42)
5.9 ± 2.3 30 ± 20 64 ± 21 8.4 ± 5.7 59 ± 5.8 1.0 ± 0.0
B (42–90)
11 ± 3.4 36 ± 25 54 ± 28 11 ± 9.7 45 ± 6.6 1.4 ± 0.1
C (90 →)
11 ± 8.2 37 ± 18 52 ± 27 13 ± 10 42 ± 6.7 1.5 ± 0.1
Melanic Brunisol (N = 3)
A (2–19) 5.2 ± 2.6 30 ± 13 65 ± 16 22 ± 9.9 65 ± 0.5 0.9 ± 0.0
B (19–49) 5.4 ± 1.9 27 ± 18 58 ± 22 33 ± 6.1 47 ± 3.7 1.3 ± 0.1
BC (49–75) 5.4 ± 2.1 25 ± 15 70 ± 20 23 ± 8.2 48 ± 9.1 1.4 ± 0.1
C (75 →)
6.2 ± 2.8 40 ± 20 54 ± 15 29 ± 25 44 ± 2.4 1.4 ± 0.1
(2002), who stated that the pools of organic matter
in Estonian Gleysols did not show a notably positive
correlation with soil productivity.
A horizons
Within the topmost horizons, Luvic Gleysols
were characterized as sandy (63.7% of sandy parti-
cles) and further by average levels of porosity, bulk
density, contents of nitrogen, phosphorus, sulphur
and potassium. e pH (4.51) and C:N ratio (17.6,
resp. 14.4) was lower than what could be expected
(V et al. 2002).
B horizons
In general, they were more silty and clayey than
A horizons, having medium porosities, high bulk
J. FOR. SCI., 56, 2010 (7): 295–306 299
Table 3. Physical and chemical characteristic of Eutric Brunisol, Sombric Brunisol and Humo-Ferric Podzols, East Norway
(B) Soil chemistry
Horizon
(cm)
pH C:N
CEC
exchangeable
acidity
BS N
t
Ca P K Mg S
(mmolkg
–1
) (%) (mmolkg
–1
)
Eutric Brunisol (N = 6)
A (3–9)
5.1 ± 0.4 20 ± 4.3 67 ± 18.4 17 ± 7.3 75 ± 10.0 0.3 ± 0.1 41 ± 18.6 17 ± 16.2 4.1 ± 0.9 4.1 ± 1.6 1.4 ± 0.4
B (9–45)
5.2 ± 0.2 18 ± 5.3 41 ± 20.2 21 ± 9.1 48 ± 16.7 0.1 ± 0.0 16 ± 14.2 5.3 ± 6.1 1.4 ± 0.8 2.0 ± 2.0 1.0 ± 0.4
C (45 →)
5.3 ± 0.5 22 ± 4.0 33 ± 19.0 17 ± 7.9 49 ± 25.0 0.0 ± 0.0 13 ± 12.4 7.2 ± 12.7 1.1 ± 0.5 1.1 ± 1.1 1.0 ± 0.6
Sombric Brunisol (N = 6)
A (2–4)
5.1 ± 0.7 25 ± 7.1 120 ± 61
24 ± 11 80 ± 1.8 1.8 ± 0.5 76 ± 54 153 ± 88 8.2 ± 2.6 11 ± 7.3 1.3 ± 1.0
B (4–17)
4.6 ± 0.3 18 ± 3.9 130 ± 82
59 ± 30 55 ± 23 0.9 ± 0.6 61 ± 56 40 ± 69 4.5 ± 2.1 4.6 ± 3.1 1.2 ± 0.5
BC (17–40)
5.0 ± 0.4 16 ± 3.4 56 ± 34
29 ± 13 49 ± 32 0.1 ± 0.1 23 ± 16 2.6 ± 1.8 1.4 ± 0.6 1.5 ± 1.8 0.8 ± 0.5
C (40–50)
5.4 ± 0.5 18 ± 0.4 59 ± 36
27 ± 11 55 ± 42 0.0 ± 0.0 28 ± 26 2.5 ± 3.2 1.6 ± 0.9 1.6 ± 2.0 0.7 ± 0.4
Humo-Ferric Podzols (N = 4)
H (7–9)
4.5 ± 0.7 24 ± 3.4 127 ± 19 16 ± 7.1 88 ± 6.2 1.6 ± 0.4 90 ± 21 97 ± 14 9.6 ± 2.4 10 ± 4.9 1.7 ± 0.6
A (9–11)
4.5 ± 0.5 22 ± 2.4 44 ± 12 17 ± 7.2 62 ± 25 0.1 ± 0.1 21 ± 14 16 ± 12 1.9 ± 0.7 3.8 ± 3.8 0.7 ± 0.5
B1 (11–20)
5.1 ± 0.5 15 ± 4.8 38 ± 5.2 12 ± 3.3 67 ± 8.2 0.1 ± 0.1 21 ± 8.3 24 ± 6.9 1.2 ± 0.3 2.1 ± 0.8 0.9 ± 0.2
B2 (20–36)
4.9 ± 0.8 25 ± 0.2 25 ± 14 17 ± 8.3 32 ± 19 0.0 ± 0.0 5.3 ± 4.4 7.9 ± 6.3 1.2 ± 0.3 0.8 ± 0.7 0.6 ± 0.8
BC (36–50)
5.0 ± 0.5 26 ± 3.2 20 ± 6.3 13 ± 5.7 33 ± 21 0.0 ± 0.0 3.0 ± 1.3 6.7 ± 6.5 1.6 ± 0.4 1.0 ± 1.0 0.9 ± 1.1
C (50 →)
4.9 ± 0.2 34 ± 9.3 29 ± 12 18 ± 6.7 38 ± 5 0.0 ± 0.0 6.9 ± 5.2 5.6 ± 7.0 0.9 ± 0.3 2.6 ± 2.7 0.2 ± 0.0
(A) Soil physics
Horizon
(cm)
< 0.002 0.002–0.06 0.06–2.0 > 2.0 Porosity
Bulk density
(gcm
–3
)
(%)
Eutric Brunisol (N = 6)
A (3–9) 2.3 ± 1.5 22 ± 14.7 76 ± 16.3 24 ± 20.2 58 ± 8.6 1.0 ± 0.2
B (9–45) 1.8 ± 1.4 16 ± 18.8 83 ± 19.4 39 ± 24.1 51 ± 5.0 1.4 ± 0.1
C (45 →)
2.5 ± 1.5 19 ± 16.1 79 ± 17.0 56 ± 28.0 48 ± 4.1 1.4 ± 0.1
Sombric Brunisol (N = 6)
A (4–17) 2.9 ± 4.6 16 ± 22 81 ± 26 16 ± 13 64 ± 7.9 0.9 ± 0.2
B (17–40) 4.6 ± 3.6 25 ± 16 70 ± 16 34 ± 17 51 ± 5.2 1.3 ± 0.0
BC (40–5) 6.6 ± 3.1 35 ± 5.9 59 ± 21 21 ± 9.3 52 ± 3.8 1.3 ± 0.2
C (55 →)
4.9 ± 3.9 34 ± 14 71 ± 1.9 43 ± 9.1 46 ± 4.4 1.4 ± 0.0
Humo-Ferric Podzols (N = 4)
A (9–11)
3.8 ± 3.0 41 ± 4.4 55 ± 1.5 21 ± 8.4 51 ± 1.5 1.1 ± 0.2
B1 (11–20)
4.9 ± 2.1 29 ± 9.6 67 ± 4.9 17 ± 5.1 53 ± 5.9 1.2 ± 2.5
B2 (20–36)
2.3 ± 1.9 19 ± 11 79 ± 13 48 ± 19 48 ± 3.7 1.3 ± 0.1
BC (36–50)
2.8 ± 0.9 20 ± 3.2 77 ± 8.1 53 ± 9.2 47 ± 8.9 1.4 ± 0.4
C (50 →)
2.9 ± 1.3 34 ± 28 64 ± 29 53 ± 18 49 ± 5.2 1.4 ± 0.1
300 J. FOR. SCI., 56, 2010 (7): 295–306
densities (1.43 gcm
–3
), showing mild soil reactions
and low exchangeable acidity, relatively higher both
CEC, BS and calcium content.
C horizons
e moderately acid horizons (pH 5.59) showed
low exchangeable acidities (13.52 mmolkg
–1
) and
average BS. Luvic Gleysols stocked by alders and
silver birch seemed to be relatively fertile soils cre-
ating favourable conditions for these tree species.
e results presented are in compliance with com-
prehensive studies about Gleysols in forests done by
M et al. (2000) and H et al. (2001).
Brunisolic soils
H horizons
Surface organic material from four stands grow-
ing on Sombric Brunisols was analyzed. These
samples showed high C:N ratios (25.4) and high
levels of phosphorus (152.87 mmolkg
–1
) and sul-
phur (1.29 mmolkg
–1
), together with relatively
high calcium content (76.30 mmolkg
–1
), CEC
(120.43 mmolkg
–1
) and BS (80.5%). Intermediate
contents of nitrogen and potassium were found. Dif-
ferences in chemical parameters of overlying organic
layers in Sombric Brunisols is assumed to be due to
variation in the decomposition and humification of
dead organic matter between the localities (V
P 1997).
A horizons
e levels of porosities, bulk densities, C:N ra-
tios and the amounts of potassium were noticeably
similar seen in the light of the very diverse content
of phosphorus and levels of exchangeable acidities.
Dealing with the particle-size classes, the level of clay
and silt contents are more diverse than the gravel
content nevertheless the very high level of SD did
not allow to draw strong conclusions. However, pH,
levels of calcium, magnesium, CEC and BS were
found to distinguish the different soils within this
great group and also between different soil orders
(e Canadian System of Soil Classification 1998).
B horizons
A low variability was found in all physical charac-
teristics whereas the chemical characteristics – espe-
cially soil reaction, BS and contents of phosphorus,
calcium, and magnesium showed a large variability.
C:N ratios and contents of nitrogen and potassium
were comparable between the different localities.
Large differences were found in pH, contents of
sulphur, phosphorus, calcium and magnesium, ex-
changeable acidities and CEC, while signs of a gen-
erally expected natural acidification in B horizons
(B et al. 1990; L et al. 1993)
have not been found.
C horizons
Considering the characteristics of brunification
products (S 2000), a similar nature in the
soil physics was confirmed in terms of (i) a sandy
nature of the parent material (e.g., 78.8% in Eutric
Brunisols) and (ii) very similar values of porosities
and bulk densities. Large variability in soil chemis-
try was found, e.g. the exchangeable acidity reached
31.82 mmolkg
–1
in Sombric Brunisols and only
7.72 molkg
–1
in Melanic Brunisols.
Podzolic order
H horizons
ese horizons were strongly acid and, with re-
spect to silver birch litter, the levels of CEC, BS, C:N
ratios and exchangeable acidities were at levels found
by A et al. (1982) and P and M-
C (1988). Looking at the SD values for sulphur,
phosphorus and calcium, they are smaller than we
find in most other tables: such nutrient concentra-
tions did not showed a great variability.
A horizons
In contrast to A et al. (1982) and B,
P (2001), similar contents of silt and sand
(41% and 55.1%, respectively) were measured in sur-
face organomineral horizons. In these horizons, low
values of soil reaction and high values of C:N ratios
were found. e level of both CEC and BS were also
found by G et al. (2000).
Upper B horizons
ese horizons were characterized by low values of
CEC and BS, less acid with equally lower exchange-
able acidities compared to other horizons and high
contents of sand. Contrasting to the usually high po-
rosity negatively correlated to bulk density, the data
showed high porosity together with bulk density: in
Table 3, B1 horizon has a porosity 53 and bulk densi-
ty 1.2, where SD for both characteristics is high (bulk
density of 2.5). In addition, there were markedly high
concentrations of phosphorus (7.86 mmolkg
–1
) and
potassium (1.24 mmolkg
–1
).
C horizons
C horizons are characterized by relatively high
content of sandy particles and high acidity (pH 4.91)
combined with much phosphorus (5.55 mmolkg
–1
).
J. FOR. SCI., 56, 2010 (7): 295–306 301
e concentration of sulphur (0.18 mmolkg
–1
) is low
compared to other soil orders. Related to massive
translocations in the topsoils (L et al.
2000), the other soil parameters ranged within values
which are expected.
Effect of tree species on selected soil properties
Comparing the values of C:N and CEC in dif-
ferent soil horizons of Humic Regosol and Luvic
Gleysol in plots with silver birch and black alder,
no significant differences were found. Similarly to
the study of Z (2002) from Central Europe and
R et al. (2001) from Northern Europe, the
particular chemical parameters of soils in our study
sites were not influenced by the presence of the tree
species. Our results are in agreement with studies
(e.g. D et al. 2001), indicating that other
factors, as the chemical composition of the parent
material and the soil texture, can discriminate the
influence of tree species on soil properties. Equally
to results from the study of 104 forest tree species
stands by J (2006) at latitude 56–63°N in
Sweden focused on site index conversion equations,
an important role of soil inorganic stores ought to
be taken into mind discussing the interrelationships
between the soil properties and the tree species.
Differences among particular soil horizons
e results of the testing for differences in selected
soil variables are shown in Tables 4–8. Humic Re-
gosols were tested for differences in physical proper-
ties in A and C horizons and for chemical properties
in H, A, and C horizons (Table 4). e contents of
clay (standard errors, SE: A – 0.29; C – 0.66) and
skeletal (SE: A – 1.17; C – 2.46) particles, and po-
rosity (SE: A – 1.31; C – 1.07) were treated on the
level of t- and F-tests. Highly significant differences
within the profiles were found for the content of
clay (P(2-tail) = 0.04; PNorm = 0.0071), poros-
ity (P(2-tail) = 0.000; PNorm = 0.263), gravel (P(2-
tail) = 0.001; PNorm = 0.014). Both pH (Cochran’s
C significance: 0.76; P = 0.001) and CEC (Cochran’s
C significance: 0.47;
P = 0.001) showed highly sig-
nificant differences within the entire depth. For
calcium content (Cochran’s C significance: 0.14,
P
= 0.001), there are significant differences between
Table 4. Multiple comparisons of vertical characteristics for Humic Regosols between soil horizons and selected soil
properties
Soil horizons pH CEC Ca
H–A < 0.001 0.010 0.989
H–C < 0.001 < 0.001 0.003
A–C < 0.001 < 0.001 0.004
Values in bold are statistically different (P < 0.05)
Table 5. Multiple comparisons of vertical soil characteristics for Luvic Gleysols – P-values of differences between soil
horizons and soil properties
Soil horizons Clay Porosity pH
O–A1 < 0.001
O–A2 0.207
O–B 0.106
O–C 0.962
A1–A2 0.002
A1–B 0.002
A1–C < 0.001
A2–B < 0.001 < 0.001 0.999
A2–C < 0.001 < 0.001 0.056
B–C 0.179 0.112 0.046
Values in bold are statistically different (P < 0.05)
302 J. FOR. SCI., 56, 2010 (7): 295–306
H–C and A–C, but not between H–A. e values
of BS showed non-homogenous variances and could
therefore not be analyzed.
Luvic Gleysols (Table 5) were tested for their
physical properties in A2, B and C horizons and their
chemical properties in O, A1 (upper part), A2 (lower
part), B and C horizons. e initial data from six soil
profiles were treated. For most horizons, no signifi-
cant differences were found in the vertical charac-
teristics of the physical properties. e content of
clay (Cochran’s C significance: 0.29; P = 0.001) and
porosity (Cochran’s C significance: 1.0; P = 0.001)
were significantly different between organo-mineral
topmost and subsurface mineral horizons, but not
within subsurface mineral horizons. e pH (Co-
chran’s C significance: 0.07; P = 0.001) was signifi-
cantly different between A1 horizon and all the other
horizons, and between B and C horizons. Other than
for the A1 horizon, no significant differences were
found in soil reaction between the A2 horizon and
the other horizons; the same was valid for O horizon,
except for a comparison with the A1 horizon (see
above). No significant differences in the content of
gravel (P = 0.1544) were found. Nevertheless, it can
be expected that the gravel content affects the quality
of these horizons to a great extent making essential
differences within the soil depth (H et al.
2002). Validity of statistical testing for the calcium
content was rejected by non-homogenous variances
(Cochran’s C significance: 0.0048), CEC (Cochran’s
C significance: 0.0168) and BS (Cochran’s C signifi-
cance: 0.0019) values, which underlined the hetero-
geneity of such soil units.
Eutric Brunisols (Table 6) were tested for their
physical properties in A, B and C horizons and for
chemical properties in H, A, B and C horizons. For
the clay content, statistical differences were only
found between B and both other horizons (Cochran’s
C significance: 0.29; P = 0.01), and for the percentage
of porosity, only between A, and both other horizons
Table 6. Multiple comparisons of vertical soil characteristics of Eutric Brunisols – P-values of differences between soil
horizons and soil properties
Soil horizons Clay Gravel Porosity pH CEC
H–A 0.028 < 0.001
H–B 0.350 < 0.001
H–C 0.925 < 0.001
A–B 0.029 0.237 < 0.001 0.527 0.003
A–C 0.907 0.018 < 0.001 0.098 < 0.001
B–C 0.013 0.348 0.402 0.705 0.482
Values in bold are statistically different (P < 0.05)
Table 7. Multiple comparisons of vertical soil characteristics for Sombric Brunisols – P-values of differences between
soil horizons and soil properties
Soil horizons Gravel Porosity CEC BS Ca
H–A 0.348 0.011 0.661
H–B < 0.001 0.001 0.002
H–BC < 0.001 0.053 0.001
H–C 0.009 0.407 0.668
A–B 0.007 < 0.001 0.007 0.854 0.047
A–BC 0.591 < 0.001 < 0.001 0.958 0.027
A–C < 0.001 < 0.001 < 0.001 0.390 0.999
B–BC 0.103 0.167 0.995 0.463 0.999
B–C 0.132 0.090 < 0.001 0.066 0.045
BC–C 0.001 0.001 < 0.001 0.790 0.026
Values in bold are statistically different (P < 0.05)
J. FOR. SCI., 56, 2010 (7): 295–306 303
(Cochran’s C significance: 0.06; P = 0.0). e gravel
content (Cochran’s C significance: 0.06; P = 0.02) was
only found to be statistically different between A and
C horizons, i.e. any content of gravel in B horizon had
no relation to contents in other horizons. Non-ho-
mogenous variances were found among all BS (Co-
chran’s C significance: 0.019) and calcium (Cochran’s
C significance: 0.0065) data. Almost all horizons, ex-
cept for the comparison between B and C horizons,
were statistically highly different between each other
for CEC (Cochran’s C significance: 0.74; P = 0.0). Sig-
nificant differences in pH were only found between
H and A horizons (Cochran’s C significance: 0.56;
P
= 0.03). e results confirmed the similar pattern
of brunification in different ecological circumstances
where the time of weathering and content of primary
iron compounds form taxonomically related soil
units (N, Jø 2003).
Sombric Brunisols (Table 7) were tested for their
physical properties in A, B, BC and C horizons, and
for their chemical properties in H, A, B, BC and C
horizons. e clay content and the pH were not
statistically treatable due to non-homogenous vari-
ances. Generally, the other selected soil properties
showed a bit larger variability in the Sombric Bru-
nisols than in the Eutric Brunisols. Most horizons
showed significant differences among each other
for gravel content (Cochran’s C significance: 0.07;
P = 0.0), porosity (Cochran’s C significance: 0.8;
P = 0.0), calcium content (Cochran’s C significance:
0.02; P = 0.0002) and CEC (Cochran’s C significance:
0.69; P = 0.0). On the contrary, the Table 7 does
not show significant differences between A and B
horizons for BS and not among H horizons and all
others.
Humo-Ferric Podzols (Table 8) were tested for
their physical properties in A, B1, B2, BC and C
horizons, and for their chemical properties in H,
A, B1, B2, BC and C horizons. Significant differ-
ences were detected between most horizons in
contents of gravel (P < 0.001), CEC (P < 0.001)
and BS (P < 0.001). Clay contents (P = 0.012) and
pH (P = 0.006) only showed significant differences
among a few horizons. No significant differences
were found in porosity or calcium contents between
soils in this great soil group.
Evaluation of soil properties of particular soil
units in silver birch stands
Multiple comparisons of the various soil properties
in the A and A2 horizons were tested in five soil units
found in the silver birch stand (Table 9), derived
from three profiles of Humic Regosols, two profiles
of Luvic Gleysols, six profiles of Eutric Brunisols,
four profiles of Sombric Brunisols and four profiles
Table 8. Multiple comparisons of vertical soil characteristics for Humo-Ferric Podzoils – P-values of differences between
soil horizons and soil properties
Soil horizons Clay Gravel pH CEC BS
H–A 0.999 < 0.001 0.001
H–B1 0.092 < 0.001 0.004
H–B2 0.328 < 0.001 < 0.001
H–BC 0.036 < 0.001 < 0.001
H–C 0.159 < 0.001 < 0.001
A–B1 0.570 0.721 0.054 0.945 0.981
A–B2 0.280 < 0.001 0.213 0.043 0.001
A–BC 0.424 < 0.001 0.020 0.004 < 0.001
A–C 0.471 < 0.001 0.096 0.062 0.002
B1–B2 0.019 < 0.001 0.971 0.219 < 0.001
B1–BC 0.035 < 0.001 0.996 0.028 < 0.001
B1–C 0.041 < 0.001 0.999 0.292 0.001
B2–BC 0.998 0.993 0.813 0.875 0.971
B2–C 0.995 0.969 0.997 0.999 0.965
BC–C 0.999 0.999 0.967 0.790 0.636
Values in bold are statistically different (P < 0.05)
304 J. FOR. SCI., 56, 2010 (7): 295–306
of Humo-Ferric Podzols. Detecting no regular pat-
terns between the soil units compared were given.
Silver birch stands were found on sites which topsoil
(i) significantly differed in their cation exchange
capacities, and (ii) did not differ significantly in
their pH and BS. e calcium contents (Cochran’s
C significance: 0.0506; P = 0.003) and porosities
(Cochran’s C significance: 0.07; P = 0.0) of the top-
soils did not show any straightforward tendencies.
Nevertheless, the results indicate an uncertainty
how to evaluate the relationship between pH, BS and
silver birch: silver birch stands were found on soils
where mean pH varies between 4.5 and 5.1 with SD
values up to 0.5. Furthermore, the results indicate
that values of BS (Cochran’s C significance: 0.99;
P = 0.008) of the topsoil in the studied silver birch
stands play an important role for an occurrence of
this species irrespectively of the particular soil units.
Further, both CEC (Cochran’s C significance: 1.0;
P = 0.0) and clay contents (Cochran’s C significance:
0.1932; P = 0.0001) were specifically related just to
their soil units and not to the presence of silver birch.
Nevertheless, a large spatial variation was expected.
H et al. (2001) showed similar variation in
an evaluation of the nutrient pools of organic layers
and the mineral soil in forest stands dominated by
silver birch.
CONCLUSIONS
Referring to properties of soils under broadleaved
tree species, Humic Regosols in East Norway showed
prominent signs of an intensive humification on
weathered rock. Luvic Gleysols displayed values of
fertile soils. Brunisols manifested a similar nature
in the soil physical properties and very varying soil
chemistry. In Podzols, particular horizons showed
particular patterns: (i) H horizons were strongly
acid with a great variability in nutrient contents, (ii)
A horizons showed similar contents of silt and sand,
low values of soil reaction and high values of C:N
ratios, (iii) upper B horizons were characterized by
low CEC and BS values, and less acidity than other
horizons with equally low exchangeable acidities,
and (iv) C horizons were characterized by relatively
high content of sandy particles, low soil reaction and
sulphur content, and very high phosphorus content.
ere were no significant differences in values of
C:N and CEC in different soil horizons of Humic
Regosol and Luvic Gleysol on plots with silver birch
and black alder, i.e. the levels of C:N and CEC were
not influenced by the presence of those tree species
in our study sites.
Dealing with differences among particular soil
horizons, Humic Regosols showed highly significant
differences within the entire depth for the contents of
clayey and gravel particles, porosity, pH and CEC. In
the Luvic Gleysols, nearly no significant differences
in the vertical characteristics were found. Almost
all horizons of Eutric Brunisols were highly statisti-
cally different for CEC. e multiple comparisons
of properties in horizons of Sombric Brunisols
showed more different values within their vertical
distribution than in Eutric Brunisols, which showed
most significant relationships. Here, most horizons
showed significant differences among each other for
gravel content, porosity, calcium content and CEC.
In terms of Humo-Ferric Podzols, there were found
Table 9. Multiple comparisons of A/A2 horizon for particular soil units in silver birch stands – P-values of differences
between soil units and soil properties
Soil units Clay Porosity pH CEC BS Ca
Eutric Brunisol – Regosol < 0.001 0.971 0.895 0.004 0.108 0.098
Eutric Brunisol – Gleysol 0.003 0.969 0.899 0.006 0.736 0.540
Eutric Brunisol –Podzol 0.174 < 0.001 0.080 0.020 0.491 0.477
Eutric Brunisol – Sombric Brunisol 0.734 0.507 0.243 < 0.001 0.394 0.194
Sombric Brunisol – Regosol 0.002 0.344 0.845 < 0.001 0.009 0.977
Sombric Brunisol – Gleysol 0.027 0.412 0.158 < 0.001 0.999 0.042
Sombric Brunisol – Podzol 0.823 < 0.001 0.970 < 0.001 0.999 0.019
Regosol – Gleysol 0.910 0.999 0.590 < 0.001 0.045 0.024
Regosol – Podzol 0.010 0.001 0.529 < 0.001 0.012 0.011
Gleysol – Podzol 0.125 0.004 0.066 0.665 0.999 0.999
Values in bold are statistically different (P < 0.05)
J. FOR. SCI., 56, 2010 (7): 295–306 305
significant differences in the gravel content and BS
among most horizons.
No regular patterns were found in selected soil
properties when tested between various soil units in
silver birch stands. Furthermore, silver birch stands
were found on sites which topsoil (i) significantly dif-
fered in their cation exchange capacities, (ii) did not
differ significantly in their pH values, and (iii) mostly
differed in their clay contents, and (iv) mostly did not
differ in BS. e results indicate that values of BS in
the topsoil play an important role for occurrence of
silver birch stands irrespectively of the particular soil
units. In contrast, both pH, CEC and clay contents
were specifically related just to their soil units and
not to the presence of silver birch.
Acknowledgements
We express our gratitude to the private forest own-
ers that have contributed with broadleaved stands in
this research project. In addition, we gratefully ac-
knowledge contributions of Dipl. Ing. P S,
e Forest Management Institute, Czech Republic,
division Frýdek-Místek.
R efe re nc es
A H.A., B M.L., F V.C., H
A., R J.D., W A.D. (1982): A reassessment of
podzol formation processes. Journal of Soil Science, 33:
125–136.
B D., S P., B R., S D., M D.
(1992): Biogeochemistry of adjacent conifer and conifer-
hardwood stands. Ecology, 73: 2022–2033.
B D., G C. (1998): Why do tree species affect
soils? e warp and woof of tree-soil interactions. Biogeo-
chemistry, 42: 89–106.
B J.R., P R.F. (2001): Forest Soils and Ecosystem
Sustainability. Amsterdam, Elsevier: 464.
B S., C C., B Y., P D. (1995): Changes
in nutrient availability and forest floor characteristics in
relation to stand age and forest composition in the southern
part of the boreal forest of Northwestern Quebec. Forest
Ecology and Management, 76: 181–189.
B M., M E., U B. (1990): Internal and
external proton load to forest soils in northern Germany.
Journal of Environmental Quality, 19: 469–477.
C M., H K., M E.P., Ó P.,
S T., R D., D J., W
S., M P., W S., V T. (2005): Dead wood in
European beech (Fagus sylvatica) forest reserves. Forest
Ecology and Management, 210: 267–282.
D H., D E., G A., L D V., B-
C., F C., B N. (2005): Modelling carbon
and water cycles in a beech forest. Part II: Validation of
the main processes form organ to stand scale. Ecological
Modelling, 185: 387–407.
D C., Z W., E W. (2003): Growth varia-
tions of Common beech (Fagus sylvatica L.) under differ-
ent climatic and environmental conditions in Europe – a
dendroecological study. Forest Ecology and Management,
173: 63–78.
D A.J., H A.J., K M.L., O T., P
J.W. (2001): Soil-Vegetation-Atmosphere Transfer Schemes
and Large-Scale Hydrological Models. Wallingford, Inter-
national Association of Hydrological Sciences: 270.
E B., F H. (1998): Soil Fertility. Berlin, Springer:
326.
G R., I H., N I., H P.A.W.,
S M., B K., L U.S. (2000): Mobiliza-
tion of Al, Fe, Si and base cations in three podzols. Geo-
derma, 94: 247–261.
H F., B J.B., S P. (2001): Contrasting
dynamics of dissolved inorganic and organic nitrogen in soil
and surface waters of forested catchments with Gleysols.
Geoderma, 100: 173–192.
H D., S E., L C. (2001): Effects of
coppicing in temperate deciduous forests on ecosystem
nutrient pools and soil fertility. Basic and Applied Ecology,
2: 155–164.
H D., H D., L C., H
M. (2002): Tree species diversity and soil patchiness in a
temperate broad-leaved forest with limited rooting space.
Flora – Morphology, Distribution, Functional Ecology of
Plants, 197: 118–125.
J T. (2006): Site index conversion equations for
Picea abies and five broadleaved species in Sweden: Alnus
glutinosa, Alnus incana, Betula pendula, Betula pubescens
and Populus tremula. Scandinavian Journal of Forest Re-
search, 21: 14–19.
J R.H., B C.J.F., T O.F.R.
(1987): Data Analysis in Community and Landscape Ecol-
ogy. Wageningen, Pudoc: 306.
K M., S A. (1979): e Advanced eory of Sta-
tistics. London & High Wycombe, Charles Griffin: 748.
Kõ R. (2002): Productivity and humus status of forest
soils in Estonia. Forest Ecology and Management, 171:
169–179.
L A., B B., U B. (1993): Input-out-
put relations of major ions in European forest ecosystems.
Agriculture, Ecosystems and Environment, 47: 175–184.
L U.S., B N., B D.C., H
P.A.W., G R., G J.O., V H.,
K E., M P-A., O M., R G., W-
O., B A., B K., F R., J
A.G., M T., M H., N A.,
N L., S M., T S L. (2000): Advances
in understanding the podzolization process resulting from
306 J. FOR. SCI., 56, 2010 (7): 295–306
a multidisciplinary study of three coniferous forest soils in
the Nordic Countries. Geoderma, 94: 335–353.
L J.M., W J.M. (1990): Substrate flow in the rhizo-
sphere. Plant and Soil, 129: 1–10.
M J., S A., H F., S P.,
B R. (2000): Increased rates of denitrification in
nitrogen-treated forest soils. Forest Ecology and Manage-
ment, 137: 113–119.
N J., V J., S J., M J., K J.
(2001): Soil Taxonomic Classification System for Czech
Republic. Praha, ČZU: 79. (in Czech)
N C.N., J F.V. (2003): Phenology and di-
ameter increment in seedlings of European beech (Fagus
sylvatica L.) as affected by different soil water contents:
variation between and within provenances. Forest Ecology
and Management, 174: 233–249.
O G., O M., R G., S G., S B.
(1991): e Chemical Analysis Program of the Norwegian
Forest Research Institute. Ås, NISK: 21.
P A.A., MC J.G. (1988): Soluble organics from
forest litter and their role in metal dissolution. Soil Science
Society of America Journal, 52: 265–271.
R C., K F., F B., K G.,
N H., E P. (2001): Comparison of
the element composition in several plant species and their
substrate from a 1,500,000 km
2
area in Northern Europe.
e Science of the Total Environment, 278: 87–112.
R L., K E., R I. (2002): Development of
soil organic matter under pine on quarry detritus of open-
cast oil-shale mining. Forest Ecology and Management,
171: 191–198.
S K., V P., H-T H.,
T I. (2004): N and P leaching and microbial
contamination from intensively managed pasture and cut
sward on sandy soil in Finland. Agriculture, Ecosystems
and Environment, 104: 621–630.
S G.M., S W.D. (1934): Moisture and pH studies
of the soil under forest trees. Ecology, 15: 134–153.
S M.E. (2000): Handbook of Soil Science. Boca Raton,
CRC Press: 710.
T F., C J. (1999): Daily and seasonal vari-
ation of stem radius in oak. Annals of Forest Science, 56:
579–590.
e Canadian System of Soil Classification (1998): Publica-
tion No. 1646. Ottawa, Agriculture and Agri-Food Canada:
188.
T S.M. (1999): Skog 2000: Statistics of Forest Condi-
tions and Resources in Norway. Ås, Norwegian Institute of
Land Inventory: 84.
T B. (1977): Site index curves for Norway spruce. Med-
delelser fra Norsk Institutt for Skogforskning, 33: 1–84. (In
Norwegian with English summary)
V N. (1995): A brief overview of Norwegian agricul-
ture and environment. European Society for Soil Conserva-
tion, Newsletter, 1: 4–6.
P W.H. (1997): Plant-soil feedback as a selec-
tive force. Trends in Ecology and Evolution, 12: 169–170.
V L., R-R K. (1998): Forest floor
chemistry under seven tree species along a soil fertility gradi-
ent. Canadian Journal of Forest Research, 28: 1636–1647.
V A., H P.M., B J-M., G L.
(2002): Soil Mineral-Organic Matter-Microorganism In-
teractions and Ecosystem Health. Volume 28A: Dynamics,
Mobility and Transformation of Pollutants and Nutrients.
Amsterdam, Elsevier: 480.
W R. (2001): Statistics to support soil research and
their presentation. European Journal of Soil Science, 52:
331–340.
W R.E. (2005): Principles and Practice of Soil Science. e
Soil as a Natural Resource. Oxford, Blackwell: 384.
Z V. (2002): Restoration of natural broad-leaved wood-
land in Central Europe on sites with coniferous forest plan-
tations. Forest Ecology and Management, 167: 27–42.
Received for publication August 25, 2009
Accepted after corrections March 9, 2010
Corresponding author :
Doc. Ing. K R, CSc., Mendelova univerzita v Brně, Lesnická a dřevařská fakulta, Zemědělská 3,
613 00 Brno, Česká republika
Tel.: + 420 545 134 039, fax: + 420 545 134 035, e-mail: