Báo cáo lâm nghiệp: "Variability of spruce (Picea abies [L.] Karst.) compression strength with present reaction wood" pdf
Bạn đang xem bản rút gọn của tài liệu. Xem và tải ngay bản đầy đủ của tài liệu tại đây (455.35 KB, 8 trang )
J. FOR. SCI., 55, 2009 (9): 415–422 415
JOURNAL OF FOREST SCIENCE, 55, 2009 (9): 415–422
As we use wood as a construction material, we
have to consider several vital factors to evaluate its
quality; and these are not only its physical properties
and imperfections, but also its strength properties
(wood strength and modules of elasticity). e evalu-
ation of wood is much more complicated than the
evaluation of metal because wood is an inhomogene-
ous anisotropic material. From the practical point of
view, wood compression strength parallel to grain is
one of the most important wood properties. When a
force is applied, deformation occurs. is deforma-
tion is manifested as the shortening of the object in
the direction of the applied force.
e wood strength parallel to grain, and also the
level of the deformation of conifers, depends pre-
dominantly on the interconnection of individual tra-
cheids. e strength mainly depends on the S2 layer
of the secondary cell wall and the fibril deflection
in this layer. e tension is transferred via cellulose
macromolecules in the cell walls. Hemicelluloses
and lignin fill up the cellulose skeleton and they play
a role in the total stability of the cell wall (P
et al. 1997).
e important factors which affect the compres-
sion strength are wood density, its species, grain
deflection, moisture content, and ambient tempera-
ture. e influence of wood density on the strength
is positive. Increased density means increased wood
strength. e wood species affects the compression
strength indirectly through wood density and also
through structural parameters, such as the tracheid
length, the proportion of lignin and the propor-
tion of late wood. Compression strength of wood
parallel to grain decreases with the degree of grain
deflection from the longitudinal direction to 90°.
Grain deflection by 15° can bring about up to a 20%
decrease in the strength. With increasing moisture
content (from 0% to the fibre saturation point) com-
pression strength decreases: moisture content being
increased by 1%, compression strength decreases
Variability of spruce (Picea abies [L.] Karst.) compression
strength with present reaction wood
V. G, H. V
Faculty of Forestry and Wood Technology, Mendel University of Agriculture and Forestry
in Brno, Brno, Czech Republic
ABSTRACT: e aim of research was to find out the variability of spruce (Picea abies [L.]) Karst.) wood compression
strength limits in the direction parallel to grain. e wood strength was examined using samples from a tree with present
reaction (compression) wood. e strength was found out for individual stem zones (CW, OW, SWL and SWR). e
zone with present compression wood (CW) demonstrated slightly higher values of wood strength limits. e differ-
ences in the limits of compression strength parallel to grain in individual zones were not statistically significant. All
the data acquired by measuring were used to create 3D models for each zone. e models describe the strength along
the radius and along the stem height. e change of strength along the stem radius was statistically highly significant.
ere was an obvious tendency towards an increase in the strength limit in the first 40 years. With the increased stem
height, there is a slight decrease in wood strength.
Keywords: strength parallel to grain; spruce; compression wood; reaction wood
Supported by the Ministry of Education, Youth and Sports of the Czech Republic, Project No. 6215648902.
416 J. FOR. SCI., 55, 2009 (9): 415–422
by 4%. e negative influence of the temperature
on wood compression strength parallel to grain is
especially obvious after a long-term exposure to
higher temperatures (K 1951; N
1993; P et al. 1997).
As wood density is highly variable in relation to
the position in the stem, also variable strength in
the appropriate stem parts can be expected. at is
why P and K (1961) examined the
variability of the spruce and fir wood compression
strength parallel to grain in dependence on the posi-
tion in the stem. ey found out that the maximum
compression strength parallel to grain decreases in
the transversal direction from the stem perimeter to
its centre and in the longitudinal direction from the
stem base to its top. erefore, the authors conclude
that the most suitable properties are localized in the
stem perimeter and in its lower third.
e compression strength parallel to grain of com-
pression wood was an object of interest as early as
at the end of the 19
th
century. N (1890)
was the first to state that spruce compression wood
will have the only slightly higher wood compression
strength parallel to grain than normal wood. Also,
the majority of other authors confirmed the higher
compression strength parallel to grain in comparison
with the strength of normal wood (V 1928;
T 1986; P et al. 1997; G 2002;
H et al. 2003).
B (1985) determined the values of
strength for various ways of load application, both
of samples of normal wood and samples with present
compression wood. In contrast to the other authors,
B (1985) found out that the presence of
compression wood influences the strength negatively
for all examined ways of load application. e com-
pression strength parallel to grain is slightly lower in
the samples with present compression wood than in
the samples of normal wood.
When fresh wood dries up, even normal wood
becomes stronger. e same principle applies to
compression wood. When fresh, compression
wood is considerably stronger than normal wood.
S (1904) confirmed that the compression
strength of fresh spruce is (44%) higher than that of
normal wood.
e objectives of this paper are to find out the lim-
its of compression strength parallel to grain of spruce
wood with present reaction compression wood, to
describe the strength for individual stem zones, and
to create models which would describe the variability
of wood compression strength parallel to grain along
the radius and the stem height.
MATERIALS AND METHODS
We have selected a sample spruce (Picea abies
[L.] Karst.) where the presence of reaction wood
was anticipated. e tree was selected in the Křtiny
Training Forest Enterprise Masaryk Forest – Men-
del University of Agriculture and Forestry in Brno,
Habrůvka Forest District, area 164 C 11. e average
annual temperature in this locality is 7.5°C and the
average annual precipitation is 610 mm.
e tree stem axis was diverted from the direction
of the gravity. e axis was diverted in one plane
only and the diversion angle at the stem base was
21°. e tree was 110 years old and its total height
was 33 m.
Logs (20 cm high) were taken at various heights
(6, 8, 10, 12, 15, 18, 20 and 22 m) and the directions of
measurements were marked on them. en, blocks
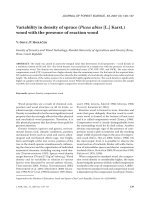
Fig. 1. A diagram of the production of a
sample out of the log and the dimensions
of the sample (CW – compression zone,
OW – opposite zone, SWL and SWR
– side zones)
CW
SWL
OW
SWR
30
30
30
30
A11
A12
A13
A14
A15
A16
A17
A21
B21
C21
E21
D21
F21
J. FOR. SCI., 55, 2009 (9): 415–422 417
of wood were sawn out of the logs for individual
zones (a block of CW – compression wood zone,
CW/CW – a sample containing 25% of compres-
sion wood at minimum, a block of OW – opposite
zone, and two blocks from side zones, i.e. SWL and
SWR). e blocks were then dried in the chamber
kiln until the final 12% wood moisture content was
achieved. After drying, samples with these dimen-
sions were made: 30 ± 0.5 mm long, 20 ± 0.5 mm
wide and 20 ± 0.5 mm thick (Fig. 1). It was necessary
that the samples were of a special orthotropic shape.
e maximum allowed divergence of rings was set
to 5° for testing, the maximum allowed divergence
of fibres was also set to 5°. Each sample was marked
so that an exact identification of the position in the
stem was later possible.
e wood compression strength parallel to grain
was examined using the universal testing device
ZWICK Z 050 (according to Czech national stand
-
ard ČSN 49 0110.). To define the influence of the
compression wood presence in the sample on the
wood density, the sample fronts were digitalized us-
ing an EPSON scanner (Epson Perfection 1660 Pho
-
to). e parameters of scanning were: colour image
with 600 dpi resolution. e digital images of the
fronts were used in LUCIA application. e appli-
cation defined the spot where compression wood is
present. It compared the entire sample area with the
defined compression wood. e proportion of pixels
with compression wood in the entire image gave us
the final result of the proportion of compression
wood in the sample. e samples from the CW zone
which contained min. 25% of compression wood are
marked as data file CW/CW in calculations.
e average ring width in the sample was set in
compliance with ČSN 49 0102 standard. e width
was measured using a stereo magnifier (Nikon SMZ
660) (R et al. 2007).
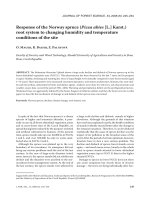
RESULTS
e box graph (Fig. 2) shows that the differences
in wood strength between the zones are very small.
The compression zone (CW) with the value of
45 MPa does not differ much from the remaining
zones: OW (44.78 MPa), SWL (45.30 MPa) and SWR
(44.75 MPa). e samples with present compression
wood (CW/CW) manifest slightly higher compres-
sion strength reaching the value of nearly 50 MPa.
e statistical examination did not confirm any sta-
tistically significant differences in the wood strength
in individual zones (Table 1). Table 2 presents the
descriptive statistics for the compression strength
parallel to grain in individual zones and heights.
e influence of the position in the stem (the radius
and the height) seemed to be statistically significant
for the compression parallel to grain. e heights
of 22 m, 10 m and 12 m are statistically significant
for the CW zone; only the height of 22 m is statisti-
cally significant for the OW zone; predominantly the
heights of 8 m and 10 m are statistically significant
for the SWL zone; and the heights of 6 m, 8 m and
15 m are statistically significant for the SWR zone.
e influence of the stem radius seems to be more
important. ere were statistically significant differ-
ences between all rings in all zones. No statistically
significant differences in the remaining zones (OW,
SWL and SWR) were found near the pith and in the
stem perimeter (SWL and SWR).
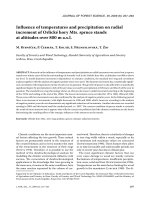
e influence of the ring width on wood strength
is exhibited in all the zones as a decrease in wood
strength with the increasing ring width. Fig. 3
clearly shows that the trends are very similar in all
the zones. ere are two obvious groups of data
in the models. e first group contains the data in
the area of the central part of the stem. Here, the
Strenght parallel to the grain (MPa)
58
54
50
46
42
38
34
30
Mean
± SD
± 1.96 SD
CW OW SWR
CW/CW SWL
Fig. 2. A box graph, wood compression strength parallel to
grain (MPa) for individual stem zones (CW – compression
zone, CW/CW – samples with present compression wood,
OW – opposite zone, SWL and SWR – side zones)
Table 1. Results of Tukey’s test based on multiple
comparison of wood compression strength parallel to
grain (P < 0.05 statistically significant difference, P > 0.05
statistically insignificant difference)
Zone CW OW SWL SWR
CW 0.72 0.97 0.61
OW 0.72 0.54 0.99
SWL 0.97 0.54 0.45
SWR 0.61 0.99 0.45
418 J. FOR. SCI., 55, 2009 (9): 415–422
Table 2. Descriptive statistics of the strength parallel to grain for individual heights and zones
Height (m) Statistical variable
Zone
CW CW/CW OW SWL SWR
22
N 12 6 15 10 9
mean (MPa) 49.68 53.02 47.97 46.68 44.13
variance (MPa)
2
14.58 1.38 7.53 2.50 3.31
coefficient of variation (%) 7.69 2.22 5.72 3.39 4.12
20
N 19 16 16 15 15
mean (MPa) 46.13 45.39 42.73 43.93 44.24
variance (MPa)
2
21.84 22.25 6.46 12.27 4.25
coefficient of variation (%) 10.13 10.39 5.95 7.97 4.66
18
N 27 16 16 22 15
mean (MPa) 45.88 47.22 45.16 45.92 47.66
variance (MPa)
2
8.44 4.25 15.97 1.63 4.69
coefficient of variation (%) 6.33 4.37 8.85 2.78 4.54
15
N 27 17 23 22 25
mean (MPa) 44.14 45.83 45.59 42.87 51.31
variance (MPa)
2
10.48 5.92 10.11 5.90 10.59
coefficient of variation (%) 7.33 5.31 6.98 5.6 6.34
12
N 40 17 23 20 25
mean (MPa) 42.96 47.73 44.35 43.87 45.12
variance (MPa)
2
28.79 11.47 17.76 11.95 23.90
coefficient of variation (%) 12.49 7.10 9.50 7.88 10.84
10
N 44 12 31 28 23
mean (MPa) 42.98 47.86 44.86 41.84 46.96
variance (MPa)
2
20.00 13.91 40.24 6.75 24.08
coefficient of variation (%) 10.40 7.79 14.14 6.21 10.45
8
N 61 22 40 39 47
mean (MPa) 45.54 52.20 44.30 49.94 41.62
variance (MPa)
2
43.01 8.62 25.77 32.88 19.76
coefficient of variation (%) 14.40 5.63 11.46 11.48 10.68
6
N 67 27 40 46 58
mean (MPa) 45.59 53.90 43.67 45.41 39.94
variance (MPa)
2
77.10 11.34 52.17 61.94 27.40
coefficient of variation (%) 19.26 6.25 16.54 17.33 13.11
∑
N 297 133 204 202 217
mean (MPa) 45.06 45.39 44.78 45.30 44.75
variance (MPa)
2
36.06 55.99 27.85 30.69 68.36
coefficient of variation (%) 13.33 14.98 11.79 12.63 18.48
J. FOR. SCI., 55, 2009 (9): 415–422 419
wood strength ranges around 40 MPa. e second
group of the data is related to the strength found in
the stem perimeter. e strength is higher in these
parts and ranges between 45 MPa and 50 MPa. e
strength increase corresponds with the difference in
wood structure between the central and the perim-
eter stem parts. Higher values of strength (55 MPa)
in the CW zone can be seen for the ring width of
1.8 mm. Such strength corresponds to compression
wood. e established functions, equation coef-
ficients, and the correlation coefficient of the selec-
tive and the basic sample are presented in Table 3.
e correlation coefficient of the selective sample
ranged between 0.321 and 0.538, which confirms
a middle level of dependence of wood strength on
the ring width.
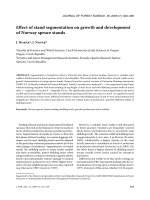
All the measured data was used to create 3D mo-
dels (Fig. 4) describing the dependence of the com-
pression strength parallel to grain on the position in
the stem. e influence of the radius is clearly obvi-
ous for all the zones. is corresponds to the out-
comes of the statistical examination using ANOVA.
In the CW, SWL and SWR zones there is an evident
increase in wood strength in the central part of the
stem, i.e. in the first 40 years. In the following years,
there is a slight increase and in the last years stagna-
tion comes. Only in the CW zone there is a distinct
decrease in wood strength in the stem perimeter. In
Fig. 3. e influence of the ring width on wood strength for individual stem zones (w = 12%)
SWL
OWCW
SWR
60
55
50
45
40
35
30
25
Ring width (mm) Ring width (mm)
Ring width (mm)Ring width (mm)
σ
12
(MPa)
σ
12
(MPa)
σ
12
(MPa)
60
55
50
45
40
35
30
25
σ
12
(MPa)
60
55
50
45
40
35
30
25
65
60
55
50
45
40
35
30
1 2 3 4 5
1 2 3 4
1 2 3 4
1 2 3 4 5
Table 3. e resulting functions for the model of compression strength parallel to grain in dependence on the ring
width
Zone Function
Coefficient of determination Coefficients
sampling basis a b
CW y = a + bx 0.487 0.483 52.61 –3.15
OW y = a + bx 0.487 0.473 50.58 –2.41
SWL y = a + bx 0.321 0.312 50.47 –2.75
SWR y = a + bx 0.538 0.533 50.74 –3.27
420 J. FOR. SCI., 55, 2009 (9): 415–422
the OW zone the increase in wood strength is linear
along the entire stem radius.
With the increasing stem height, the wood strength
in the CW, OW and SWL zones decreases. Only in
the SWR zone the trend is increasing. A possible ex-
planation for the inverted trend is the lower number
of data with a higher dispersion of values, or missing
data from lower heights. e resulting functions of
the selected models, the equation coefficients and
the correlation coefficients are presented in Table 4.
e values of the correlation coefficients range be-
tween 0.52 and 0.63, which confirms a middle up to
a high level of dependence of the wood strength on
the position in the stem.
DISCUSSION
As wood is used as a construction material,
several vital factors to evaluate its quality have to
be considered; and these are not only its physical
properties and imperfections, but also its strength
properties (P, K 1961). Com-
pression strength parallel to grain of normal wood
is usually stated to be between 34 and 52 MPa
(F et al. 1986; N 1993; P et
al. 1997). e strength in the OW, SWL and SWR
zones was around 45 MPa, which corresponds
with the published values. Most authors agree that
compression wood has higher strength than normal
wood (T 1986; F et al. 1986; G
2002). e wood compression strength parallel to
grain in the CW zone was also 45 MPa, therefore
the statistically significant variance in the middle
values of strength between individual zones was not
confirmed. However, the strength of compression
wood (the samples with at least 25% of compres-
sion wood present – the CW/CW zone – were
used) was higher, the value being 49.94 MPa. is
value corresponds to the data for the compression
wood of spruce (Picea abies) with 12% of moisture
content published by G (2002) and H et
al. (2003). e higher strength of compression wood
is caused by higher wood density, which is predomi-
nantly brought about by the presence of thick-walled
compression tracheids. erefore, it is possible to re-
ject conclusions of B (1985), who reported
lower compression strength for wood with present
compression wood. e lower value of strength in his
results was probably also affected by the lower wood
density with present compression wood (although
the difference between normal wood and wood with
present compression wood is 8 kg/m
3
).
60
55
50
45
40
35
30
25
σ
12
(MPa)
60
55
50
45
40
35
30
25
65
60
55
50
45
40
35
30
65
60
55
50
45
40
35
30
20 30 40 50 60 70 80 90
Number of rings from cambium
30 40 50 60 70 80 90
Number of rings from cambium
OWCW
20 15 10 5
Height (mm)
20 15 10 5
Height (mm)
σ
12
(MPa)
Fig. 4. e resulting functions for the model of wood strength dependence on the position in the stem
Table 4. e resulting functions for the model of wood strength in dependence on the position in the stem
Zone Function
Coefficient of determination Coefficients
sampling basis a b c d
CW z = a + bx + cy + dy
2
0.630 0.625 45.65 –0.254 0.417 –0.006
OW z = a + bx + cy 0.539 0.532 56.52 –0.185 –0.223
SWL z = a + bx + cy + dy
2
0.518 0.507 49.79 –0.379 0.252 –0.005
SWR z = a + bx + cy + dy
2
0.559 0.549 40.41 0.299 0.241 –0.004
J. FOR. SCI., 55, 2009 (9): 415–422 421
P and K (1961) described the
significant dependence of compression strength
parallel to grain on the percentage of late wood. ey
found out that with an increasing percentage of late
wood the compression strength grows. Assuming
that the percentage of late wood is related to the ring
width, it is logical that there was a decrease in wood
strength in all the zones (see Fig. 3). ere is a lower
percentage of late wood in a wider ring, therefore
the wood compression strength is lower. e lower
strength of the wood in wide rings can be inferred
from the presence of juvenile wood.
e created 3D models (see Fig. 4) unequivocally
confirmed the increase in wood strength in the di-
rection from the centre to the stem perimeter. Such
a trend corresponds to the results presented by
P and K (1961), also for spruce.
As far as the stem height is concerned, the decreas-
ing trend was confirmed for the CW, OW and SWL
zones. An inverted trend was found only for the
SWR zone. e inverted trend might have been
caused by missing values from lower stem heights.
P and K (1961) stated that the
compression strength parallel to grain corresponds
to macroscopic features, i.e. the ring width and
the percentage of late wood. eir conclusions can
be accepted, as also in the case of the sample tree
we can see the same relationships of dependence.
Especially the variability of the ring width and the
late wood percentage along the radius considerably
affect the integral physical property – wood density.
If wood is to be used as a construction material,
the vital factors to consider are, besides its physical
properties and imperfections, its strength proper-
ties (P, K 1961).
If wood density has a positive influence on wood
strength (P, Z 1980), it is logical that
the increasing wood density along the stem radius
(G, H 2007) has to bring about an in-
crease in wood strength along the stem radius. e
decreasing wood density along the stem height
causes a decrease in the wood strength.
R ef er enc es
BERNHART A., 1985. Über die statische und dynamische
Kurzzeitfestigkeit von Fichtenholz – absolut, rohdichtebe-
zogen und unter Druckholzeinfluß. Forstwissenschaftliche
Zentralblatt, 104: 275–295.
FRÜHWALD A., SCHWAB E., GÖTSCHE-KÜHN H., 1986.
Technologische Eigenschaften des Holzes von Fichten
unterschiedlichen Erkrankungszustand. Holz als Roh- und
Werkstoff, 44: 299–300.
GINDL W., 2002. Comparing mechanical properties of nor-
mal an compression wood in Norway spruce: e role of
lignin in compression parallel to the grain. Holzforschung,
56: 395–401.
GRYC V., HORÁČEK P., 2007. e variability of spruce (Picea
abies [L.] Karst.) wood density with present reaction wood.
Journal of Forest Science, 53: 129–137.
HORÁČEK P., KOŇAS P., GRYC V., TIPPNER J., ZEJDA J.,
2003. Zvláštní vědecké posouzení. Pád vánočního stromu
na Staroměstském náměstí v Praze dne 6. 12. 2003. Brno,
MZLU, Ústav nauky o dřevě: 34.
KOLLMANN F., 1951. Technologie des Holzes und der
Holzwerkstoffe. Berlin, Göttingen, Heidelberg, Springer
Verlag: 1050.
NIEMZ P., 1993. Physik der Holzes und der Holzwerkstoffe.
Weinbrenner, DRW-Verlag: 243.
NÖRDLINGER H., 1890. Die gewerblichen Eigenschaften der
Hölzer. Sttutgart, Cottasche Buchhandlung: 92.
PALOVIČ J., KAMENICKÝ J., 1961. Rozloženie rozhodujú-
cich fyzikálnych a mechanických vlastností v kmeni smreka
a jedle a ich vzťah k rozvoju nových smerov technológií
ihličnatých drevín, I. časť: Rozptyl a rozloženie objemovej
váhy, šírky ročných kruhov, podielu letného prírastku.
Drevársky výskum, 6: 85–101.
PANSHIN A.J., DE ZEEUW C., 1980. Textbook of Wood
Technology. Structure, Identifications, Properties, and Uses
of the Commercial Woods of the United States and Canada.
New York, McGraw-Hill, Inc.: 722.
POŽGAJ A., CHOVANEC D., KURJATKO S., BABIAK M.,
1997. Štruktúra a vlastnosti dreva. Bratislava, Príroda: 486.
RYBNÍČEK M., GRYC V., VAVRČÍK H., HORÁČEK P., 2007.
Annual ring analysis of the root system of Scots pine. Wood
Research, 52: 1–14.
SONNTAG P., 1904. Über die mechanischen Eigenschaften
des Roth- und Weißholzes der Fichte und anderer Na-
delhölzer. Jahrbücher für wissenschaftliche Botanik, 39:
71–105.
TIMELL T.E., 1986. Compression Wood in Gymnosperms,
Volume 1. Bibliography, Historical Background, Deter-
mination, Structure, Chemistry, Topochemistry, Physical
Properties, Origin and Formation of Compression Wood.
Berlin, Springer Verlag: 705.
VERALL A.F., 1928. A comparative study of the structure and
physical properties of compression wood and normal wood.
St. Paul, University of Minnesota: 37.
ČSN 49 0102, 1988. Metóda zisťovania priemernej šírky
letokruhov a priemerného podielu letného dreva. Praha,
Vydavatelství Úřadu pro normalizaci a měření: 8.
ČSN 49 0110, 1980. Drevo. Medza pevnosti v tlaku ve smere
vlákien. Praha, Vydavatelství Úřadu pro normalizaci
a měření: 4.
Received for publication January 30, 2009
Accepted after corrections March 18, 2009
422 J. FOR. SCI., 55, 2009 (9): 415–422
Variabilita pevnosti dřeva v tlaku ve směru vláken smrku (Picea abies
[L.] Karst.) s přítomností reakčního dřeva
ABSTRAKT: Cílem práce byla zjistit variabilitu meze pevnosti dřeva v tlaku ve směru vláken smrkového dřeva (Picea
abies [L.] Karst.). Pevnost dřeva byla zjišťována na vzorcích, které pocházely ze vzorníkového stromu s přítomností
reakčního (tlakového) dřeva. Pevnost dřeva byla zjišťována pro jednotlivé zóny kmene (CW, OW, SWL a SWR). Zóna
s přítomností tlakového dřeva (CW) vykazovala o něco vyšší hodnoty meze pevnosti dřeva. Rozdíly v mezi pevnosti
dřeva v tlaku ve směru vláken nebyly mezi jednotlivými zónami statisticky významné. Ze všech naměřených dat
byly pro jednotlivé zóny vytvořeny 3D modely, které popisují pevnost dřeva po poloměru a po výšce kmene. Změna
pevnosti po poloměru kmene byla statisticky velmi významná. Byl pozorován zřetelný trend zvýšení meze pevnosti
dřeva v prvních čtyřiceti letech. Se zvyšující se výškou kmene dochází k mírnému poklesu pevnosti dřeva.
Klíčová slova: mez pevnosti dřeva v tlaku ve směru vláken; smrk; tlakové dřevo; reakční dřevo
Corresponding author:
Ing. V G, Ph.D., Mendelova zemědělská a lesnická univerzita v Brně, Lesnická a dřevařská fakulta,
Lesnická 37, 613 00 Brno, Česká republika
tel.: + 420 545 134 548, fax: + 420 545 211 422, e-mail: