Báo cáo lâm nghiệp: "Environmental risk assessment based on semi-quantitative analysis of forest management data" pptx
Bạn đang xem bản rút gọn của tài liệu. Xem và tải ngay bản đầy đủ của tài liệu tại đây (380.82 KB, 7 trang )
J. FOR. SCI., 57, 2011 (3): 89–95 89
JOURNAL OF FOREST SCIENCE, 57, 2011 (3): 89–95
Environmental risk assessment based on semi-quantitative
analysis of forest management data
L. K
1
, R. M
2
1
Forest Research Institute in Zvolen, National Forest Centre, Zvolen, Slovakia
2
Faculty of Forestry and Wood Sciences, Czech University of Life Sciences Prague,
Prague, Czech Republic
ABSTRACT: The paper deals with environmental risk assessment in prevailingly unnatural spruce (Picea abies [L.]
Karst.) forests in three regions with different patterns of forest damage in the Slovak part of the West Carpathians.
Logistic regression was used to estimate the effect of 7 site-related, 5 stand-related and 2 anthropogenic factors on the
probability that critical forest damage will occur. The results show that regression models can describe cause-effect
relationships in regions with different regimes of forest decline. Stand age, proportion of spruce, and distance from
the focus of biotic agent activity predicted decline in two regions with generally lower elevation in northern Slovakia
(Kysuce and Orava). In a mountain region (Low Tatras), the importance of factors contributing to the static stability of
trees and position towards dangerous winds increased significantly. The quality of the derived models and prospects
for their usefulness in risk assessment are discussed.
Keywords: ecological factors; forest damage; forest management; logistic regression; Norway spruce; risk assessment
Supported by EU through the ERDF-funded operational programme of Slovak Republic "Research and Development",
Project No. ITMS26220220026, and by the Ministry of Agriculture of the Czech Republic, Project No. QH91097.
e general forest management scheme in Europe
primarily aims to achieve high-quality and large-
dimension timber production, which, depending
on site conditions and tree species growth charac-
teristics, usually requires a growing period of about
100 years or longer. A wide range of disturbances
typically occurs during this period. Because a profi t
is expected at the end of the forest production cycle
(rotation period), each aspect or incidence of dam-
age causes a loss in value. erefore one of the main
tasks of forest management is to reduce such dam-
age by the proper long-term planning of suitable
silvicultural measures.
Risk is defi ned in terms of a loss event (distur-
bance) that is comprised of two components: po-
tency (cost, severity, or extent of the loss event)
and chance (the likelihood of occurrence the loss
event). Sometimes only potency is examined, and
this is measured in terms of severity, intensity or
level of mortality. It is often referred to as “hazard”.
In other instances, risk is analyzed only as the like-
lihood of a loss event, wherein either probability
of an event is estimated or predisposition to a loss
event is assessed (S 2001).
Modelling of tree mortality as a highly stochas-
tic process is limited. erefore, H (2000)
suggested a shift towards modelling for purposes
of exploration and explanation rather than for the
aim of generating precise predictions.
Several approaches to risk assessment in for-
est management were described by H
(2002). e fi rst approach is based on an extensive
literature review or even just on local experience.
Its examples are expert systems used in assessing
the infl uence of site and stand factors on the bark
beetle hazard in spruce stands (J 1998; N
et al. 2001), a system for the honey fungus risk as-
sessment under climate change (Č et al.
2004) or a simple qualitative risk rating scheme for
main European tree species and main types of risk
(B et al. 2001). e second approach
– actually the most common – is the use of various
90 J. FOR. SCI., 57, 2011 (3): 89–95
deterministic and stochastic models. An example
of the deterministic approach is to derive transition
probabilities for age classes using Markov chains
(S 1971). Such a technique was applied to esti-
mate the infl uence of salvage cuttings on harvesting
strategies (K 1989) and on insurance models
in forestry (H, H 2006). Logistic
regression is a frequently used stochastic technique
for risk assessment in forestry – for example for the
analysis of wind and snow damage (V, F-
1999; J, M 2000) or for the
occurrence of general forest damage (K, H-
2008). A third alternative is the use of artifi cial
intelligence techniques – for example artifi cial neu-
ral networks to build nonlinear regression models
(S 2001; H 2002).
is paper presents the results of a logistic regres-
sion-based risk analysis utilizing forest management
data. e analysis was carried out in unnatural Nor-
way spruce forests aff ected by diff erent types of forest
decline. e fi ndings can provide eff ective support to
optimization of medium- and long-term forest man-
agement planning. In particular, we focus upon:
(1) introducing the data and methodology used in
the analysis,
(2) developing and describing logistic regression
models for three spruce-dominated regions in
the West Carpathians,
(3) discussing the prospects of such models to be
used in forest management.
MATERIAL AND METHODS
Regions of interest
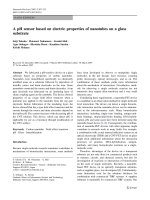
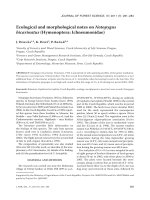
ree spruce-dominated regions in the Slovak part
of the West Carpathians, representing various site
conditions and disturbance regimes, were subjected
to analysis (Fig. 1). Intensive spruce decline has been
observed in all three regions in recent years.
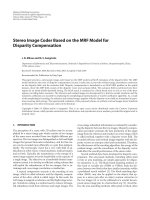
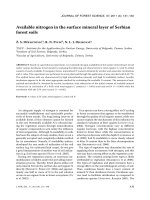
e Kysuce region represents a lower situated
hilly landscape. e geological substratum is pal-
aeogenetic fl ysch, built of sandstone, slate and clay-
stone. Moderately cold and very wet climate is typi-
cal of the region. Recently, bark beetles (Scolytidae)
and honey fungus (Armillaria sp.) have played the
most important roles in spruce decline in this re-
gion (Fig. 2).
e Orava region also belongs to the West Beskids
fl ysch geological sub-base. Its geomorphology is
much more diverse compared to the Kysuce region,
with hilly and high mountain parts. Cold and very
wet climate prevails. Recently, elevated activity
and severity of both destructive (mainly wind and
snow) and biotic damage have been observed.
e Low Tatras region represents a typical Cen-
tral Carpathians high-mountain massif built of
crystalline silicate rocks. e climate is cold and
wet, but more continental than in the previously
named regions. Long-term impacts of windstorms
with subsequent bark beetle outbreaks comprise a
typical forest disturbance regime.
Description of variables
Data from forest management plans in use at the
beginning of the 10-year period of interest were
used for analyses. Seven site-related, fi ve stand-re-
lated, and two anthropogenic factors with the as-
sumed infl uence on the probability of forest dam-
age occurrence were used as explanatory variables
in the logistic regression models (Table 1). All of
them were either directly available in forest man-
agement plans or were derived from these data.
West Carpathians
study regions
state border
Slovakia
Slovakia
Fig. 1. Localization of study regions in
the frame of Slovakia and West Car-
pathians. 1 – the Kysuce region, 2 – the
Orava region, 3 – the Low Tatras region
J. FOR. SCI., 57, 2011 (3): 89–95 91
Qualitative variables were quantifi ed by means of
simplifi ed ordinal scales (for details see Table 1).
e dependent variable was designed on the ba-
sis of direct visual assessment of forest damage
according to classifi cation scales given in Table2.
Critical damage occurrence (level 3) expressed on
a binomial scale (1 – critical damage occurred;
0– critical damage did not occur) was ultimately
used as the dependent variable. Such assessment
was carried out on sample plots arranged on linear
transects situated across the Kysuce and Orava re-
gions in directions of the highest variability of site
and stand conditions.
Sample plots approximately 1 ha in size and rep-
resentative of the surrounding forest stand were
identifi ed in each forest compartment through
which a transect line passed. Airborne imagery
taken in the period prior to the occurrence of ex-
tensive spruce dieback (2002–2003) was used for
pre-selection of sample plot centres. Plot centres
were visually pre-selected, considering the relief,
tree species composition and canopy structure.
Subsequently, plot centres were identifi ed in the
fi eld by GPS. In this way, 297 sample plots were de-
signed in the Kysuce region and 245 in the Orava
region during the period 2007–2008.
No fi eld survey was carried out in the Low Tatras
region. A linear discriminant model was designed
using the Orava dataset to obtain a dependent
variable for the Low Tatras region (Table 3). Two
out of the fi ve tested discriminators were included
in the fi nal model using a stepwise forward proce-
dure: stand age and proportion of salvage cutting in
actual timber stock. Subsequently, using available
data from forest management plans and records
of salvage cutting, scores for critical damage oc-
currence were assigned to all forest compartments
in this region. Discriminant model parameters
(Table3) indicate the signifi cance of discriminant
functions, which was proved by a test of Mahala-
nobis distance. e model was also proved to have
fairly good stability by its validation on an inde-
pendent data set from the Kysuce region, although
the accuracy of classifi cation was only about 80%.
Fig. 2. Diff erences between the importance of biotic
and abiotic destructive agents in the study regions
Kysuce region
e Low Tatras region
Orava region
Salvage cuttings (m
3
·ha
–1
)Salvage cuttings (m
3
·ha
–1
)Salvage cuttings (m
3
·ha
–1
)
6
5
4
3
2
1
0
6
5
4
3
2
1
0
6
5
4
3
2
1
0
1972 1976 1980 1984 1988 1992 1996 2000 2004
1972 1976 1980 1984 1988 1992 1996 2000 2004
1972 1976 1980 1984 1988 1992 1996 2000 2004
Destructive abiotic
Bark beetles
Wood destructing fungi
92 J. FOR. SCI., 57, 2011 (3): 89–95
Methods
Logistic regression can be used to predict a de-
pendent variable on the basis of continuous and/or
categorical independents. Logistic regression applies
maximum likelihood estimation after transforming
the dependent into a logit variable (the natural log
of the odds of the dependent variable occurring or
not). In this way, logistic regression estimates the
probability of occurrence of a certain event (e.g.
DM 1992).
Logistic regression was used to identify the infl u-
ence of cardinal, ordinal and binomial explanatory
variables (Table 1) on critical forest damage occur-
rence. Deviance residuals and Pearson χ
2
residuals
were calculated to check the suitability of the de-
signed model for the prediction. Deviance residu-
als are based on the contribution of the observed
responses to the log-likelihood statistic, while
Pearson χ
2
is expressed as the diff erence between
the observed responses and predicted values.
A logistic regression model was created using the
GLM module in STATISTICA 7.0. e logit link
function and the forward stepwise procedure for
factors entering the model were applied. e re-
sults were interpreted according to standard proce-
dures used for the evaluation of logistic regression
models (e.g. M et al. 2005).
RESULTS
e quality of the derived models as indicated by the
ratios of residuals and degrees of freedom was satisfac-
tory. e ratios were below or close to 1.0 in all cases
(Table 4), and thus there was no evidence of overdis-
persion and the models fi tted the data well (H,
L 2000). In addition, how well the regres-
sion models fi tted was assessed by the proportion of
cases correctly classifi ed by the model and observed
values of the dependent variable. While overall cor-
rectness of all models varied in a range of 82–93%, in
Table 1. Explanatory variables used for the development of logistic regression models and scales used for quantifi ca-
tion of individual variables
Factor
Scale
type range
Site
altitudinal vegetation zone ordinal 3–6 3: oak-beech … 6: fi r-beech-spruce
1
ecological-trophical order ordinal 1–6 1: oligotrophic … 6: calcaric
1
hydric order ordinal 1–5 1: extremely limited … 5: waterlogged
1
site extremity ordinal 1–3 1: no extremity … 3: high extremity
1
natural presence of beech binomic 0–1 0: natural absence … 1: nat. presence
1
radiation load ordinal 1–4 1: N-NE expositions … 4: SW-S exp.
2
zone of biotic hazard ordinal 1–3 1: no hazard … 3: focus of activity
3
Stand
stand age cardinal years
proportion of spruce cardinal % of relative crown cover
stand density ordinal 1–10 1: crown cover 5–15% 10: 95–100%
vertical structure ordinal 1–3 1: one layer … 3: three or more layers
initial damage ordinal 1–3 1: undamaged … 3: critically damaged
4
Man
pollution load ordinal 0–2 0: without load … 2: medium load
5
management system ordinal 1–3 1: reliable … 3: questionable
6
1
Ecological factors derived from the qualitative parameter “forest type” according to H (1972), quantifi ed accord-
ing to Z (1976) and B and L (2000)
2
relative radiation input, assessed by relief aspect
3
biotic hazard categories designed as result of spatial analysis of sanitary cuttings caused by biotic agents (for details see
K, H 2008; H et al. 2009)
4
forest damage at the beginning of the model parameterisation period scaled according to Table2
5
assessed level of both present-day and past air pollution load, spatially expressed by “zones of pollution threat” according
to forest management legislation in Slovakia
6
the reliability of systematic management is prejudged by a decreasing gradient, starting from state forests, through mu-
nicipality and community forests, to small owners’ forests, often without legal personality
J. FOR. SCI., 57, 2011 (3): 89–95 93
less frequent category 1 (critical damage occurred) the
classifi cation was much poorer and varied between
38% and 73%, depending on the proportion of this cat-
egory in model calibration data (Table 5).
No over- or underestimation was detected in the
Orava region, where the ratio of risk category 1 to
category 0 was nearly 1:2. Underestimation by about
13% was detected for category 1 in the Kysuce re-
gion, where this ratio was nearly 1:3. is indicates
that the number of forest compartments with pre-
dicted critical forest damage was lower by 13% than
the number of compartments with observed criti-
cal damage. In the Low Tatras region, this value ap-
proached 1:10 and an underestimation of 47% was
detected for risk category 1. Hence, these results
should be regarded as less reliable and to have re-
duced applicability as compared to those from the
previous regions. In addition, the indirect assess-
ment of critical damage using a discriminant model
markedly limits the use of the acquired results.
Table 4 describes diff erences in the cause-eff ect
pattern among the studied regions. In the Kysuce
region, which has been massively aff ected main-
ly by biotic agents in the last decade, the highest
probability of critical damage occurrence was as-
sociated with older stands, higher proportion of
spruce, location in the vicinity of the focus of biotic
agent activity, and growing at drier sites (the order
is based on Wald statistics).
Mature stands at lower altitudes, northern expo-
sures, and at the wettest sites were found to be the
most endangered in the Low Tatras region. Supposed
reasons are the susceptibility of stands to windthrow
due to larger dimensions of trees, lower rooting sta-
bility, and exposure to prevailing wind directions
(according to K et al. 2008). e position
towards the focus of biotic pest activity also plays a
role as do the increasing proportion of spruce, higher
level of initial damage, and management uncertainty
(for variable descriptions see Table1). is probably
relates to the frequent neglect of tending and forest
sanitation measures on the part of small owners.
In the Orava region, where the disturbance pattern
is in transition between the previous regions, the or-
der of factors was similar to that for the Kysuce re-
gion. e most important factors were the position
towards the focus of biotic pest activity, stand age, and
the proportion of spruce in a given stand. e fourth
Table 2. Forest damage classifi cation and assignment of binary values to “critical damage occurrence” in order to
create a binomial dependent variable for logistic risk regression model
Damage level Critical damage occurrence Canopy compactness Canopy transparency
1 – undamaged 0 intact < 30%
2 – moderately damaged 0 disrupted (gaps < 0.01 ha prevail) 30–60%
3 – critically damaged 1 open (patches > 0.01 ha prevail) > 60%
Table 3. Linear discriminant coeffi cients and parameters of the discriminant model, used for the estimation, whether
the critical damage occurred or did not occur in the Low Tatras region, as a surrogate of direct visual classifi cation
of forest damage
Factors tested as potential discriminants
Risk category
0
(critical damage did not occur)
1
(critical damage occurred)
Stand age +0.106 +0.133
Salvage cuttings proportion
1
–0.011 +0.099
Stand density 0 0
Vertical structure 0 0
Initial damage 0 0
Interception –3.844 –8.065
Mahalanobis distance test M
2
= 2.84; F = 74.1; P = 0.00
Corectness of classifi cation on analyzed data (Orava region, n = 226) 78.3%
Corectness of classifi cation on independent data (Kysuce region, n = 286) 85.7%
1
% of removed timber stock in the forest compartment since the beginning of the analyzed period due to a salvage cuttings,
M
2
– Mahalanobis distance, F – F-test value, P – F-test signifi cation
94 J. FOR. SCI., 57, 2011 (3): 89–95
factor was the vertical stand structure which indicates
increasing importance of destructive damage.
DISCUSSION
e developed regression models can be considered
as standalone complex models of environmental risk
prediction allowing the “chance and potency” analysis
using a traditional regression technique (S
2001). “Chance” is computed as probability of the
critical damage occurrence for forest compartments
and “potency” is a specifi c level of forest damage con-
sidered as critical in forest management.
e results proved the statement of H
(2002) that the ability of such models to predict dam-
age to forest is limited, especially when the numbers
of damaged and undamaged stands in the sample
data diff er signifi cantly. e results indicate a pos-
sibility of under- or overestimation of predicted risk
given unbalanced data sets, i.e. when one risk cat-
egory prevails over another at a ratio lower than 1:3.
Table 4. Results of logistic regression, evaluating estimated infl uence of searched factors to the critical damage oc-
currence in all study regions. Signs of b
i
indicate whether increasing value of factors (according to scale in Table 1)
infl uence critical damage occurrence positively or negatively, increasing values of Wald statistic indicate the statistical
weight of this infl uence. Empty fi elds means that factor was not included to the model by forward stepwise procedure
Explanatory variable
(b
i
)
Kysuce region Orava region e Low Tatras region
estimation Wald st. estimation Wald st. estimation Wald st.
b
i
(b
i
/s(b
i
))
2
b
i
(b
i
/s(b
i
))
2
b
i
(b
i
/s(b
i
))
2
Altitudinal vegetation zone – – – – –1.231 148.2**
Ecological-trophical order +0.837 4.2* – – – –
Hydric order –1.757 14.1** – – +0.412 15.3**
Site extremity – – – – – –
Natural presence of beech – – – – – –
Radiation load – – – – –0.268 18.2**
Zone of biotic hazard +1.611 22.0** +1.711 21.9** +0.641 24.0**
Stand age +0.076 35.5** +0.042 16.6** +0.077 414.4**
Proportion of spruce +0.091 34.2** +0.079 13.7** +0.010 13.9**
Stand density – – – – – –
Vertical structure +1.174 6.5* –2.391 11.7** – –
Initial damage – – +0.959 6.2* +0.335 8.1**
Pollution load – – +1.323 6.3* – –
Management system – – –0.630 3.6* +0.366 7.2**
Intercept –16.41 38.8** –15.49 27.7** –5.94 74.7**
Deviance (D/df ) 0.55 0.72 0.37
Pearson residuals (χ
2
/df )
0.57 0.67 0.67
**P < 0.01; *0.01 < P < 0.05, Wald st. – Wald statistic, s – standard deviation, D – deviation of the model, df – degree
of freedom, χ
2
– chi squared distribution
Table 5. Classifi cation matrices expressing the correctness of classifi cation of cases (sample plots, in the case of the
Low Tatras region forest compartments) from the analysed data set by derived logistic models
Kysuce region Orava region e Low Tatras region
Observed
predicted
observed
predicted
observed
predicted
1 0 correct (%) 1 0 correct (%) 1 0 correct (%)
1 47 23 67.1 1 58 22 72.5 1 152 252 37.6
0 14 213 93.8 0 23 142 86.1 0 63 3,960 98.4
All 87.5 81.6 92.9
J. FOR. SCI., 57, 2011 (3): 89–95 95
Hence, an adjusting procedure can be performed on
logistic regression results, e.g. shifting the thresh-
old point of the relative operational characteristic
(M et al. 2005) or using alternative techniques
such as those based on artifi cial intelligence.
e developed regression models identifi ed under-
standable and ecologically well interpretable region-
specifi c cause-eff ect interactions. As the models have
been developed using data from forest management
plans, quantitative information about risk (probability
of critical damage occurrence, including confi dence
intervals) associated with individual forest compart-
ments can be obtained. In this way, the results can
provide profound information for knowledge-based
forest management. While recognizing the aforemen-
tioned limitations, the proposed system based on the
quantifi cation of qualitative forest management data
appears to be suitable for complex environmental risk
assessment using generally available data.
R e fe r e n c e s
B M., L N., S-B H.,
L B.V. (2001): Risk appraisal for forest management
with respect to site quality and environmental changes.
In: G K.V. (ed.): Managing Forest Ecosystems 2:
Risk Analysis in Forest Management. Dordrecht/Boston/
London, Kluwer Academic Publishers: 21–48.
B A., L J. (2000): Geobiocenology II. Brno, MZLU:
249. (in Czech)
Č P., J L., C P. (2004): Risk evalua-
tion of the climatic change impact on secondary Norway
spruce stands as exemplifi ed by the Křtiny training forest
enterprise. Journal of Forest Science 50: 256–262.
DM A. (1992): Logit modeling: Practical applications.
ousand Oaks, CA: Sage Publications. Series: Quantita-
tive Applications in the Social Sciences, 106: 87.
H L. (1972): Forest Types of Slovakia. Bratislava,
Príroda: 307. (in Slovak)
H M. (2002): Climatic Hazards and their Con-
sequences for Forest Management. In: A M., B
Y., C J.M. (eds): Risk Management and Sustainable
Forestry. EFI Proceedings, 45: 21–28.
H C. (2000): Woody plant mortality algorithms: de-
scription, problems and progress. Ecological Modelling,
126: 225–248.
H T., K L., B I., T M.,
S Z.,
K M. (2009): e proposal of biotic hazard zones in
selected spruce dominated regions in Slovakia. Journal of
Forest Science 56: 236–242.
H J., H M. (2006): A forest management risk
insurance model and its application to coniferous stands in
southwest Germany. Forest Policy and Economics, 8: 161–174.
H D.W., L S. (2000): Applied Logistic Re-
gression. 2
nd
Ed. New York, John Wiley & Sons, Inc.: 392.
J R. (1998): Types of bark beetle (Coleoptera, Scolytidae)
infestation in spruce forest stands aff ected by air pollu-
tion, bark beetle outbreak and honey fungus (Armillaria
mellea). Anzeiger für Schadlingskunde, Pfl antzenschutz,
Umweltschutz, 73: 41–49.
J A., M U. (2000): Logistic regression mod-
els for wind and snow damage in Northern Finland based
on the National Forest Inventory data. Forest Ecology and
Management, 135: 315–330.
K J. (1989): eory of normal forest following random
processes, probability of salvage cuttings, and forest pro-
duction. Lesnictví, 36: 925–944. (in Czech)
K J., K B., R R., N C. (2008):
Dangerous directions of winds in Slovakia. Lesnícke štúdie
60, NLC-LVÚ Zvolen: 81. (in Slovak)
K L., H T. (2008): Multi factorial hazard assess-
ment as a support for conversion priority rating in declin-
ing spruce forests. Lesnícky časopis – Forestry Journal,
54: 43–52.
M M., M J., H M. (2005): PC-Based Analysis
of Multidimensional Data in Excercises. Praha, Academia:
449. (in Czech)
N U., N S., E O., F E. (2001):
Parameters for the assessment of the predisposition of
Spruce-dominated forests to various disturbing factors
with special regard to 8-toothed Spruce bark beetle (Ips
typographus L.). In: F A., L O., K-
T. (eds): Criteria and indicators for sustainable
forest management at the forest management unit level.
EFI Proceedings, 38: 99–108.
S D.L. (2001): Application of artifi cial intelligence
to risk analysis for forest ecosystems. In: G K.V.
(ed.): Managing Forest Ecosystems 2: Risk Analysis in
Forest Management. Dordrecht/Boston/London, Kluwer
Academic Publishers: 49–74.
S T. (1971): Forest Transition as a Stochastic Process.
Wien, Mitteilungen der Forstlichen Bundesversuchsanstalt
(FBVA), Heft 91: 137–150.
V E., F J. (1999): Models to asses the risk of
snow and wind damage in pine, spruce and birch forests
in Sweden. Environmental Management, 24: 209–217.
Z A. (1976): Forest Phytocenology. Praha, SZN: 495.
(in Czech)
Received for publication March 30, 2010
Accepted after corrections October 26, 2010
Corresponding author
Ing. L K, PhD., National Forest Centre, Forest Research Institute Zvolen,
T. G. Masaryka 22, 960 92 Zvolen, Slovakia
e-mail: