Báo cáo lâm nghiệp: "Structure and development of forest stands on permanent research plots in the Krkonoše Mts" pdf
Bạn đang xem bản rút gọn của tài liệu. Xem và tải ngay bản đầy đủ của tài liệu tại đây (784.25 KB, 13 trang )
518 J. FOR. SCI., 56, 2010 (11): 518–530
JOURNAL OF FOREST SCIENCE, 56, 2010 (11): 518–530
Structure and development of forest stands on permanent
research plots in the Krkonoše Mts.
S. V
1
, Z. V
1
, L. B
1
, I. N
1
, O. S
2
1
Faculty of Forestry and Wood Sciences, Czech University of Life Sciences Prague,
Prague, Czech Republic
2
Krkonoše National Park Administration, Vrchlabí, Czech Republic
ABSTRACT: The research is focused on structure and development of forest stands from 5
th
to 8
th
forest vegetation
zone in the Krkonoše Mts. The forest stand diversity according to tree species composition and representation, hori-
zontal and vertical structure was evaluated by using following indices: Clark-Evans aggregation index (C, E
1954), standardised Arten-profil index (P 2005) and index of complex diversity after J, D
(1997). Growth model SIBYLA (F, Ď 2005) was used for visualizations and growth predictions of forest
stands on particular plots. Based on research results, management recommendations were evaluated.
Keywords: forest development; mountain forest; structural diversity
Foresters and naturalists often relate the forest
to the idea of steadiness, homeostasis and ecologi-
cal, production and environmental continuity with
respect to particular forest developmental phase.
is functional continuity can be negatively infl u-
enced by several disruptive factors. For some part
of conservationists the natural development of
forests and forest stands without any human inter-
vention is the highest priority, nevertheless in the
conditions of Central Europe this requirement is
often only illusory. In changed ecosystems is than
their disturbance considered as part of natural
development with no respect to their ecological
stability or the level of autoregulation processes.
For the reason of rational and permanent forest
use, near to nature management demands a vast
knowledge of the forest ecosystem and the control
of natural processes in the forest (B 2000;
S-T, S 2002). e protection of
natural processes in forest ecosystems with no re-
lation to their structural diversity is not based on
correct assumptions. Complete die back of woody
compartment in forest ecosystem leads for exam-
ple to diff erent developmental trajectory than that
of natural forest ecosystem whose high degree of
“naturalness” or “authenticity” was the primary
impuls for their protection. In the Krkonoše Mts.
these trends occured mainly during the air pollu-
tion and following ecological calamity in the 1980s
of the last century. In these cases the restoration
of forest stands and diff erentiated forest manage-
ment enhancing ecological stability, biodiversity
and autoregulation processes is the essential tool of
nature protection and conservation.
During the last decade in both National Parks
(Krkonošský národní park and Karkonoski Park
Narodowy) the ecological stability and biodiversity
of forest stands was increased due to diff erentiated
management based on stand and site characteris-
tics and new zonation. More emphasis is given to
close-to-nature forest management and natural
processes, namely spontaneous and controlled nat-
ural regeneration, which is of great importance in
the genetically most valuable forest stands.
Supported by the Ministry of Education, Youth and Sports of the Czech Republic, Project No. MSM 2B06012, by the
Ministry of Environment of the Czech Republic, Project No. SP/2d3/149/07.
J. FOR. SCI., 56, 2010 (11): 518–530 519
With the objective to optimize future forest man-
agement in both national parks, on 38 permanent
research plots (PRP) the structure and develop-
ment of forest stands were evaluated. e research
results represent 30 years of observations. Based
on particular site and stand characteristics the
prediction of tree component development was
done in the horizon of 20 years.
MATERIAL AND METHODS
Characteristics of permanent research plots
In the area of Krkonoše Mts. from 5
th
to 8
th
forest
vegetation zone 32 permanent research plots were
established and market PRP 1–32. All PRP represent
beech, mixed (beech spruce and spruce beech for-
est) and spruce stands on diff erent site conditions,
with diff erent levels of air-pollution and subsequent
acidifi cation. Most of these plots were established
in 1980, PRP 11 to 15 were established already in
1976. ese plots were between 1981–2004 com-
pleted by another two PRP in the ecotone of the
upper forest limit with the objective to study veg-
etative reproduction of spruce and beech. 4 PRP
were newly established in the Polish part of the
Krkonoše Mts. in forest types, which do not occur
in the Czech Republic (locality Chojnik and the up-
per watershed of Lomniczka): relict pine woods, sil-
ver fi r spruce forest, herb-rich beech forest and the
highest locality of acidophilus beech forest. Plots are
rectangular, mainly 50 × 50 m (area 0.25 ha). Excep-
tion are PRP6 (100×50 m), PRP 7 (100 ×100 m),
PRP 33 (25×35m), PRP 37 (40 × 60 m) and PRP 38
(40×60m). Detailed description of permanent re-
search plots is given in M et al. (2010).
Methodology
e structure of forest stands was evaluated by
standard dendrometric methods. Within each PRP
enumerated trees were mapped using the right
angle prism and measure tapes. For each stem, the
dbh (double measurement with calliper, accuracy
1 mm), the height, the crown height (hypsometer
Blume-Leiss, accuracy 0.5 m) were measured. e
crown projection of each live stem by measuring
four cardinal crown radii per tree was mapped
(by using system of measure tapes, ranging poles
and swiveling telescope). e repeated horizontal
mapping was done with the equipment Field-Map
(IFER-Monitoring and Mapping Solutions Ltd.).
Within PRP the positions of all woody stems≥5cm
dbh were remeasured. e heights were remea-
sured with the hypsometer Vertex (accuracy 0.1 m).
Growth model SIBYLA (F, Ď 2005)
was used for visualisations and growth predictions
of forest stands on particular plots. e results
are presented in graphical and numerical way (cf.
M 2006).
e models of spontaneous development were
done for 38 permanent research plots in beech,
mixed (spruce beech and silver fi r beech forest)
and spruce stands. Same simulations were also per-
formed on PRPs located in the ecotone of the up-
per forest limit and in relict pine wood. For all these
PRP structural analyses in steps of fi ve years were
done. Under the conditions of spontaneous develop-
ment in ecologically stable environment the predic-
tion was calculated for period of 20 years. In spruce
stands endangered by bark beetle disturbances more
precise predictions in 5 year steps were conduced. In
selected stands with the absence of silver fi r (PRP6
and 28) virtual underplanting of this species was
done and prediction of development after 25 and
50 years performed.
e forest stand diversity according to tree spe-
cies composition and representation, horizontal
and vertical structure was evaluated by using fol-
lowing indices:
– Clark-Evans aggregation index (C, E
1954);
– Standardized Arten-profi l index (P
2001) as relative rate of diversity;
– Complex diversity index by J, D-
(1997) – (B > 5 – highly diff erentiated for-
est stands).
RESULTS AND DISCUSSION
Structure and development of forest stands
Besides the common characteristics of natural
forest development, stand dynamics show more or
less expressed diff erences in relation to site condi-
tions (
K et al. 1991; V 2000; V et al.
2009). is variance has to be considered as result
of diff erent ecological conditions, environmental
limits and biological properties of dominant tree
species. On extreme sites after air-pollution and
ecological calamity still elements of large devel-
opmental cycle with higher ratio of pioneer tree
species are characteristic. Ecologically stable au-
tochthonous forest stands develop within the small
developmental cycle.
520 J. FOR. SCI., 56, 2010 (11): 518–530
Beech stands
Natural beech stands in the Krkonoše Mts. are
marked by high age heterogeneity, low volume and
structure variability and small-scale texture – the
smallest of the zonal Central European natural for-
ests. ese developmental trends are result of maxi-
mal shade-tolerance and relatively shorter life span
of this tree species. e duration of one mosaic cycle
is normally not longer than 230–250 years. e op-
timal stage is relatively short (max. 40 years), and is
characterized by lower dbh variability of the upper
layer and reduced number of trees in the lower lay-
er. e shade tolerance of beech results in two and
three layered beech stands during important part of
the whole life cycle. Simple structures with only one
storey are rather exceptional and occur only in the
optimal stage. Developmental independence is due to
fi ne grained mosaic reached already within areas of
25–30 ha. Number of trees in the optimal stage varies
between 350 and 550 per 1 ha (50%), the volume var-
ies in the range of 30% and reaches on average sites
values between 400 and 600 m
3
·ha
–1
, on better sites
then 550–800 m
3
·ha
–1
(cf. V et al. 1988).
Abundant natural regeneration occurs in the inter-
val 100–120 years, which corresponds to the early de-
struction phase of mature stands. For natural beech
stands is typical the occurrence of overtopping trees
that locally survive in more favorable site conditions.
ey develop after sporadic natural regeneration,
which precedes abundant natural regeneration after
expressed gap formation in forest stands.
Forest stands are mainly described from follow-
ing localities: river valley of Jizera, Boberská stráň,
Rýchory (Czech Republic), Chojnik, Szklarka, Nad
Jagnadkówem and river valley of Lomniczka (Poland).
PRP 29 – U Bukového pralesa B
Site and stand characteristics
Forest stand 536 A17/2/1b with PRP 29 – U Bu-
kového pralesa B is located on gentle slope with
SE exposition. e stand can be characterized as
overmatured with relatively opened canopy and
abundant beech regeneration of diff erent size and
age. Within the forest cycle the prevalent aggrada-
tion stage is accompanied by fragments of destruc-
tion stage. e stand is classifi ed as phenotype
category B with above average production and
good health status. e age of the upper storey is
173 years and is formed by dominant beech (93%)
and spruce (7%). e middle layer and lower layer are
completely formed by beech of age 23 and 9 years,
respectively. Individually admixed trees species are
rowan and spruce. Middle height of the upper storey
is 25 m, stocking is 6. Low canopy cover of the upper
storey (55%) results in higher radiation in the inner
of the stand forming suitable conditions for develop-
ment of natural regeneration. e stand belongs to
target management set 546 and air-pollution zone C.
PRP 29 was established in 1980, the forest type
is determined as nutrient-medium spruce-beech
stand with Oxalis acetosella (6S1). Soil type is
modal Cambisol. e ground vegetation cover is
very low (5%).
Forest structure
Autochthonous beech forest stand on PRP 29
– U Bukového pralesa B (admixed spruce, rowan
and Sycamore maple less than 3%) can be char-
acterized as three-storeyed stand with partial
selection structure. e distribution of natural re-
generation is mainly infl uenced by the canopy cover
of middle and upper storey. Total number of trees
in regeneration layer is 13,320 ind. per ha. Beech
forms almost 100%, rowan and spruce are only
admixed. Trees of the main canopy are distributed
randomly.
In the upper layer mainly trees of dbh > 50 cm
are represented. Relatively frequent are also trees
with lower dbh and very thick trees. High number
of relatively thin trees (dbh around 10 cm) and the
absence of lower dbh classes refl ect former natural
regeneration of the stand ceased in the past. e
occurrence of new regeneration will depend on
the creation of new canopy openings in the upper
layer. e green crown height of the upper storey
is relatively variable reaching values between 8m
and 16 m. e crown length is proportional to
tree height in all storeys, the h:d ratio is in lower
storey extremely variable and shows no relation to
dbh. e h:d ratio of larger trees in the middle and
upper storey reaches constantly values around 50
and shows only slight decrease with increasing dbh.
Growth visualizations and forest structure
simulations
Main characteristics used for simulation on PRP 29
– U Bukového pralesa B:
– altitude: 950 m,
– forest type: 6S1,
– natural tree species composition: Beech 4, Spruce 4,
Silver fi r 2, Sycamore maple,
– average age: 142 years,
– vegetation period: 110 days,
– precipitation of the vegetation period: 640 mm,
– annual temperature amplitude: 18°C,
J. FOR. SCI., 56, 2010 (11): 518–530 521
48.02
49.79
0.0
48.86
49.79
0.0
(A)
(B)
– mean temperature of the vegetation period: 10°C,
– water saturation: 0.50,
– nutrients saturation: 0.50.
Main forest characteristics:
– Beech 98, h:d – 21:44, 471 m
3
·ha
–1
, 252 N·ha
–1
,
– Spruce 2, h:d – 13:27, 7 m
3
·ha
–1
, 16 N·ha
–1
,
– Rowan 0, h:d – 10:15, 2 m
3
·ha
–1
, 56 N·ha
–1
,
– Sycamore maple 0, h:d – 11:24, 1 m
3
·ha
–1
, 4 N·ha
–1
,
– Mixture: individual,
– Texture – distribution: regular.
At present (2010) the beech stand shows high
structural and age diversifi cation. Rowan,
spruce and sycamore maple are only individually
admixed.
– Age of storeys: 9/23/173 years,
– tree species composition: Beech 98, Spruce 2,
Rowan, Sycamore maple.
Forest dynamics
e autochthonous beech forest stand (admixed
spruce, rowan and sycamore maple less than 3%)
is located in the 1
st
zone of the National Park. e
tree species composition can be characterized as
natural. e actual stand corresponds to shift be-
tween tree species within the small developmental
forest cycle. e spatial and age diff erentiation is
very high; the destruction stage of the upper storey
is accompanied by aggradation stage of the middle
layer. Advanced natural regeneration of beech,
rowan and spruce occurs on areas with lower cano-
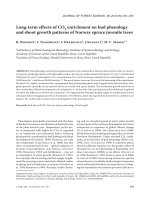
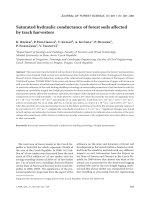
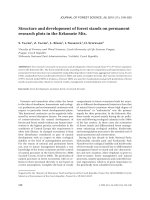
py (V et al. 2009). Maximal use of production
potential is accompanied by intense autoreduction
of tree numbers in lower layers (Fig. 1). e forest
dynamics are typical for small developmental cycle
with high autoregulation potential. e stand can
be left for spontaneous development.
Structural diff erentiation of the forest stand
Table 1 gives overview of all three structural in-
dices used in the study. The horizontal structure
of the forest stand was from the first year of ob-
servation till 2010 random; in following years the
stand tends to more aggregation. The spatial di-
versity of the stand is medial with slight increase
as result of ongoing destruction of the parent
Fig. 1. (A) Visualization of forest structure in 1980 and (B) forest structure prediction in 2030 on PRP 29 – U Buko-
vého pralesa B
Picea abies, Abies alba, Pinus sylvestris,
Pinus mugo, Fagus sylvatica, Sorbus aucuparia, Acer pseu-
doplatanus, A. platanoides, Ulmus glabra, Quercus petrae, Betula pendula
522 J. FOR. SCI., 56, 2010 (11): 518–530
stand and establishment of natural regeneration.
The complex diversity of the stand was in the first
year of measurement also medial, but shows slight
decrease during following decades as result of
destruction of the ageing stand. Table 2 presents
growth variables after spontaneous development
for the whole stand and beech as dominant tree
species.
Mixed stands
Mixed forest stands of beech, fi r and spruce are
marked by long developmental cycle lasting over
350–400 years. is very long period is mainly de-
termined by long life span of silver fi r. e life span
of spruce is 300–350 years, of beech 200–250 years.
ese diff erences in developmental cycles of particu-
lar tree species result in high variability and complex-
ity of natural forest dynamics in the 5
th
and 6
th
forest
vegetation zone. It can be generally stated that dur-
ing one generation of fi r or spruce, beech normally
changes two generations. us, tree species com-
position and their volume can change dramatically
during the developmental cycle. Almost pure forest
stands with increased ratio of coniferous species on
the one hand or with beech on the other hand are
not exceptional. Higher portion of beech is related
to shorter optimal stage; on the contrary higher por-
tion of spruce results in to longer optimal stage with
horizontal canopy. e optimal stage repeats after
220–260 years, dominance of particular tree species
Table 1. Indices prediction on PRP 29 – U Bukového
pralesa B after spontaneous development
Year
Index
R (C&Ei) A (Pi) B (J&Di)
1980 1.122 0.367 6.086
1990 1.163 0.366 5.868
2000 1.066 0.366 5.751
2010 0.987 0.354 5.599
2020 0.914 0.376 5.601
2030 0.885 0.428 5.531
Table 2. Growth tables for beech stand on PRP 29 – U Bukového pralesa B based on the simulation of spontaneous
development (values for admixed tree species are not included)
Period Year
Stand – including dead individuals
tdhfvNGVh:d TCI TAI TPV
Tot al
1 1980 246 39.6 19.01 0.628 1.470 328 40.3 482 0.480 0.0 1.96 482
3 1990 259 42.6 20.30 0.600 1.737 288 40.9 500 0.477 5.2 2.07 537
5 2000 266 45.2 21.40 0.575 1.976 220 35.2 435 0.473 4.3 2.19 583
7 2010 278 48.4 21.67 0.567 2.260 176 32.3 398 0.448 4.1 2.25 626
9 2020 290 49.9 21.56 0.571 2.407 156 30.3 375 0.432 3.6 2.29 664
11 2030 283 49.9 21.52 0.568 2.392 144 28.0 344 0.431 3.7 2.48 701
Beech
1 1980 250 44.1 21.48 0.57 1.870 252 38.4 471 0.487 0 1.88 471
2 1985 254 45.2 21.70 0.569 1.981 252 40.3 499 0.480 5.3 1.96 499
3 1990 262 46.5 22.14 0.561 2.108 232 39.2 489 0.476 5.0 2.00 524
4 1995 265 47.1 22.66 0.554 2.186 208 36.2 455 0.481 4.5 2.07 549
5 2000 269 48.3 22.83 0.549 2.298 184 33.6 423 0.473 4.2 2.12 569
6 2005 274 49.4 22.94 0.550 2.417 180 34.4 435 0.464 4.2 2.16 591
7 2010 283 50.8 22.59 0.553 2.533 152 30.7 385 0.445 3.9 2.16 611
8 2015 287 51.6 22.49 0.556 2.614 144 30.0 376 0.436 3.6 2.20 630
9 2020 295 52.6 22.47 0.560 2.736 132 28.5 361 0.427 3.4 2.19 647
10 2025 288 51.9 22.47 0.561 2.669 124 26.1 331 0.433 3.4 2.31 664
11 2030 289 52.6 22.39 0.561 2.732 120 26.0 328 0.426 3.4 2.36 681
t – average age of stand; d – the average diameter at breast height (cm); h – mean stand height (m); f – form factor; v – average
tree volume (m
3
); N – number of trees per 1 ha; G – basal area per hectare (m
2
·ha
–1
); V – volume of growing stock (m
3
·ha
–1
);
h:d – slenderness ratio; TCI – total current increment (m
3
·ha
–1
·year
–1
); TAI – total average increment (m
3
·ha
–1
·year
–1
);
TPV – total production volume (m
3
·ha
–1
)
J. FOR. SCI., 56, 2010 (11): 518–530 523
repeats after 130 years as result of changing genera-
tions of beech. In Krkonoše Mts. the largest reported
tree is silver fi r with 182 cm of dbh and 58 m of height.
Total volume of forest stands varies between 500 and
900m
3
·ha
–1
. e regeneration occurs exclusively un-
der the shelter of parent stand, coniferous tree species
regenerate rather in groups, beech on larger continu-
ous areas. During the last decades the ratio of fi r in
natural regeneration signifi cantly decreased, on the
other hand we observe increasing vital regeneration
of beech. (cf.
V et al. 1987).
Natural spruce beech forest stands with admixed fi r
are mainly described from following localities: river
valley of Jizera, Boberská stráň, Rýchory, VBažinkách
(Czech Republic), Nad Jagnadkówem, Szklarka, river
valley of Lomniczka and Pod Kociołom Szrenickim
(Poland).
PRP 36 – Chojnik – silver fi r beech stand
Site and stands characteristics
e forest stand 213f withPRP 36 – Chojnik – sil-
ver fi r beech forest is located on gentle slope with S
exposition. e stand can be characterized as ma-
tured with abundant natural regeneration of shade
tolerant tree species (beech and silver fi r) accompa-
nied by more light demanding tree species of diff er-
ent age and size. e stand is classifi ed as phenotype
category B. e upper storey (118 years) is formed by
spruce (40%), silver fi r (30%), beech (20%) and pine
(10%). In the middle- and understorey (27 and 10
years) the beech is represented by 75%, silver fi r 15%,
sycamore maple 5% and Norway maple 5%. Middle
height of the stand is 25 m, stocking is 9. e canopy
cover of the upper layer is relatively high (95%), thus
the conditions for successful development of natural
regeneration are rather limited. e stand belongs to
target management set 452 and air-pollution zone D.
PRP 36 was established in 1980, the forest site
type is determined as las mieszany górski świeży
(LMwyż-św) (forest type 4S1 – nutrient medium
beech stand with Oxalis acetosella). Soil type is
modal Cambisol. e ground vegetation cover is
low (30%) and is dominated by Oxalis acetosella.
us, the competition of herbal vegetation for re-
sources is rather low with suitable conditions for
natural regeneration.
Forest structure
Highly diff erentiated autochthonous silver fi r
beech forest stand on PRP 36 – Chojnik (admixed
spruce, sycamore maple, Norway maple and Scotch
elm 20%) can be characterized as three-storeyed
stand with partial selection structure.
Number of tree regeneration strongly depends
on the canopy cover of the parent stand, on the soil
surface conditions and ground vegetation and moss
cover. Total number of trees in regeneration layer
is 90,200 ind. per ha. Beech forms 91%, silver fi r
6%, other tree species are represented by less than
1% (sessile oak, Crataegus monogyna, rowan, syca-
more maple, Norway maple, small-leaved linden,
spruce and Sambucus recemosa). Individuals of the
parent stand are distributed randomly.
e dbh structure of the forest stand is highly dif-
ferentiated. Mostly represented are lowest diameter
classes (beech with admixed sycamore maple). Di-
ameter classes between 15 and 30 cm are strongly
underrepresented. Silver fi rs of dbh around 35cm
form an important part of the stand, in higher dbh
classes the number of individuals constantly de-
creases, the thickest trees are exclusively beeches.
e height of trees increases rapidly up to dbh
40 cm, after this value the increase is rather slow.
In the upper storey the height of green crowns is
between 10 and 20 m, in the understorey between
1 m and 3 m. e crown length is proportional to
tree height in all storeys. In the case of silver fi r this
relation is more obvious than in the case of beech.
e h:d ratio is in lower storey extremely variable
and shows no relation to dbh (values are from 70 to
150). On the contrary, by trees thicker than 25 cm
the h:d ratio shows decrease with increasing dbh.
Growth visualizations and forest structure
simulations
Main characteristics used for simulation on PRP 36
– Chojnik – silver fi r beech stand:
– altitude: 940 m,
– forest type: 4S1,
– natural tree species composition: Beech 8, Sil-
verfi r 2, Lime tree, Maple, Oak, Hornbeam,
– average age: 118 years,
– vegetation period: 130 days,
– precipitation of the vegetation period: 650 mm,
– annual temperature amplitude: 19.9°C,
– mean temperature of the vegetation period: 12.9°C,
– water saturation: 0.37,
– nutrients saturation: 0.50.
Main forest characteristics:
– Beech 48, h:d – 18:35, 283 m
3
·ha
–1
, 192 N·ha
–1
,
– Silver fi r 32, h:d – 28:37, 193 m
3
·ha
–1
, 144 N·ha
–1
,
– Spruce 18, h:d – 31:42, 108 m
3
·ha
–1
, 64 N·ha
–1
,
– Scotch elm 2, h:d – 35:50, 11 m
3
·ha
–1
, 4 N·ha
–1
,
– Sycamore maple 0, h:d – 11:11, 2 m
3
·ha
–1
, 48 N·ha
–1
,
– Norway maple 0, h:d – 11:11, 0 m
3
·ha
–1
, 4 N·ha
–1
,
– Mixture: individual,
524 J. FOR. SCI., 56, 2010 (11): 518–530
Table 3. Indices prediction on PRP 36 – Chojnik – Silver
fi r beech stand after spontaneous development
Year
Index
R (C&Ei) A (Pi) B (J&Di)
2007 0.983 0.616 9.260
2012 0.983 0.622 9.239
2017 0.991 0.628 9.109
2022 0.964 0.616 8.881
2027 0.901 0.659 8.296
2032 0.893 0.656 8.197
2037 0.893 0.657 8.099
2042 0.893 0.639 8.037
2047 0.893 0.654 8.000
2052 0.893 0.653 7.952
2057 0.893 0.644 7.874
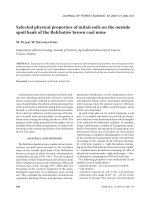
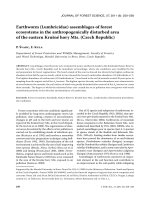
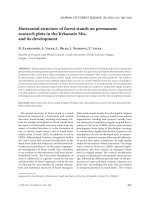
Fig. 2. (A) Visualization of forest structure in 2007 and (B) forest structure prediction in 2027 on PRP 36 – Chojnik – Silver
fi r beech forest. For explanation see Fig. 1
– Texture – distribution: random.
At present (2010) the stand shows high struc-
tural and age diversifi cation. e stand is formed
by beech, silver fi r, spruce, sycamore maple with
individually admixed elm tree.
– Age of storeys: 10/27/118 years
– Tree species composition: Beech 50, Silver fi r 30,
Norway spruce 10, Sycamore maple 9, Elm tree 1.
Forest dynamics
e autochthonous silver beech forest stand (ad-
mixed spruce, sycamore maple, Norway maple,
Scotch elm 20%) is located in the 1
st
zone of the
National Park. e tree species composition can
be characterized as natural. e actual stand cor-
responds to shift between tree species within the
small developmental forest cycle. e spatial and
age diff erentiation is very high; the optimal stage
of the upper storey is accompanied by aggradation
stage of the middle layer. Advanced natural regen-
eration mainly of beech and sporadical silver fi r,
sessile oak, rowan, sycamore maple, Norway maple,
small-leaved linden, spruce, Crataegus monogyna
and Sambucus recemosa occur on areas with lower
canopy (V et al. 2009). e forest dynamics are
typical for small developmental cycle with high au-
toregulation potential.
0.0
49.3
52.8
(A)
0.0
49.3
48.9
(B)
J. FOR. SCI., 56, 2010 (11): 518–530 525
Table 4. Growth tables for silver fi r beech stand on PRP 36 – Chojnik based on the simulation of spontaneous development
Period Year
Stand – including dead individuals
tdhfvNGVh:d TCI TAI TPV
Tot al
1 2007 117 34.8 22.44 0.614 1.310 456 43.3 597 0.645 0 5.10 597
2 2012 121 36.1 23.00 0.603 1.420 456 46.6 648 0.637 10.4 5.36 648
3 2017 126 37.6 23.40 0.599 1.557 444 49.3 691 0.622 10.0 5.56 701
4 2022 131 37.5 23.67 0.572 1.495 420 46.3 628 0.631 9.4 5.71 748
5 2027 135 38.1 23.90 0.556 1.514 380 43.2 575 0.627 9.4 5.89 795
6 2032 140 39.8 24.57 0.547 1.672 372 46.3 622 0.617 9.4 6.01 842
7 2037 145 41.2 24.97 0.54 1.798 372 49.4 669 0.606 9.5 6.13 889
8 2042 150 42.5 25.30 0.537 1.927 372 52.7 717 0.595 9.2 6.25 937
9 2047 155 43.7 25.60 0.532 2.044 372 55.7 761 0.586 8.7 6.33 981
10 2052 160 44.8 25.87 0.53 2.162 372 58.6 804 0.577 9.3 6.40 1,024
11 2057 165 46.1 26.13 0.527 2.296 372 62.0 854 0.567 9.3 6.51 1,074
Beech
1 2007 115 34.7 18.29 0.853 1.475 192 18.0 283 0.527 0 2.46 283
2 2012 120 35.7 18.92 0.834 1.580 192 19.0 303 0.530 3.9 2.53 303
3 2017 125 36.6 19.51 0.819 1.681 192 20.0 323 0.533 3.4 2.58 322
4 2022 128 33.2 18.86 0.808 1.319 172 14.7 227 0.568 2.8 2.63 337
5 2027 129 29.5 17.91 0.823 1.007 148 10.0 149 0.607 2.5 2.71 350
6 2032 133 30.8 18.63 0.807 1.120 144 10.6 161 0.605 2.5 2.72 362
7 2037 138 31.8 19.15 0.795 1.209 144 11.3 174 0.602 2.6 2.72 375
8 2042 143 32.7 19.59 0.788 1.296 144 12.0 187 0.599 2.1 2.71 388
9 2047 148 33.4 19.99 0.774 1.356 144 12.5 195 0.599 2.0 2.68 396
10 2052 153 34.2 20.32 0.770 1.436 144 13.1 207 0.594 2.3 2.67 408
11 2057 159 35.0 20.63 0.763 1.514 144 13.7 218 0.589 2.3 2.64 419
Silver fi r
1 2007 118 36.9 28.07 0.446 1.338 144 15.4 193 0.761 0 1.64 193
2 2012 123 38.5 28.54 0.444 1.475 144 16.8 212 0.741 4.1 1.73 213
3 2017 128 40.9 29.12 0.438 1.676 136 17.8 228 0.712 4.2 1.83 234
4 2022 133 42.5 29.50 0.438 1.832 136 19.3 249 0.694 4.3 1.92 255
5 2027 138 44.9 30.20 0.432 2.067 128 20.2 265 0.673 4.5 2.01 277
6 2032 143 46.6 30.61 0.430 2.247 128 21.8 288 0.657 4.6 2.10 300
7 2037 148 48.3 30.97 0.428 2.428 128 23.4 311 0.641 4.7 2.18 323
8 2042 153 50.0 31.26 0.426 2.617 128 25.1 335 0.625 4.7 2.27 347
9 2047 158 51.6 31.50 0.425 2.797 128 26.7 358 0.61 4.5 2.34 370
10 2052 163 53.1 31.74 0.422 2.969 128 28.3 380 0.598 5.0 2.40 392
11 2057 168 54.9 31.98 0.421 3.185 128 30.2 408 0.583 5.0 2.50 420
t – average age of stand; d – the average diameter at breast height (cm); h – mean stand height (m); f – form factor;
v – average tree volume (m
3
); N – number of trees per 1 ha; G – basal area per hectare (m
2
·ha
–1
); V – volume of growing
stock(m
3
·ha
–1
); h:d – slenderness ratio; TCI – total current increment (m
3
·ha
–1
·year
–1
); TAI – total average increment (m
3
·ha
–1
·year
–1
);
TPV – total production volume (m
3
·ha
–1
)
Structural diff erentiation of the forest stand
Table 3 gives overview of all three structural in-
dices used in the study. e horizontal structure of
the forest stand was from the fi rst year of obser-
vation random; in following years the stand tends
to more aggregation, after 2022 clumped structure
of the stand is predicted. e spatial diversity of
the stand is medial with slight increase as result
of higher ratio of silver fi r in the forest stand. e
complex diversity of the stand was in the fi rst year
of measurement very high, but shows slight de-
crease during following years (mainly after 2022).
526 J. FOR. SCI., 56, 2010 (11): 518–530
Table 4 presents growth variables after spontane-
ous development for the whole stand and particu-
lar tree species.
Spruce stands
Also spruce stands have expressed dynamics in
higher mountain areas. is tree species has the
highest competitive ability in higher elevations
and tolerates conditions in the ecotone of the up-
per forest limit, although its optimal growth and
production is reached in the conditions of the 5
th
and 6
th
forest vegetation zone. Development and
dynamics of natural spruce stands are highly re-
lated to altitude and site conditions. In lower el-
evations on average sites spruce stands have rather
homogenous structures with expressed horizontal
canopy. ese stands however have high age varia-
tion between individuals. e developmental cycle
completes after 300–400 years. In spruce stands
(due to the longevity of this tree species) typically
develops structure, which is subject to abiotic (and
biotic) disturbances. Large scale forest disruption
with subsequent ecological succession is a usual
mode of spruce forest regeneration, but normal-
ly do not reach the dimensions often seen in bo-
real regions. In the 8
th
vegetation zone other tree
species occur only sporadically. Within the large
developmental cycle the share of pioneer tree spe-
cies can temporarily increase. Spruce regeneration
tends to occur on microsite elevations, mainly on
logs. Optimal stage is relatively large but can be
shortened by e.g. bark beetle calamity. Similar de-
velopment occurs also in artifi cial spruce monocul-
tures outside its natural range with the exception
of high age variation. Inclination to catastrophic
disturbances is in this case even more expressed
(cf.
V 1990).
Natural spruce forest stands are mainly described
from following localities: Labský důl, Modrý důl,
Obří důl, Koule, Střední hora (Czech Republic)
Kocioł Lomniczki, Mumlawski Wierch, Kamennik
and Maly Staw (Poland).
PRP 24 – Střední hora
Site and stand characteristics
e forest stand 330 D17a/1a with PRP 24 – Střední
hora is located on middle slope with SE exposition.
e stand can be characterized as matured with
partial natural regeneration of spruce. e upper
storey (183 years) is formed by spruce (100%). e
understorey (15 years) is formed by spruce (99%)
and rowan (1%). Middle height of the stand is 21 m,
stocking is 7. e canopy cover of the upper layer is
relatively high (75%), thus the natural regeneration
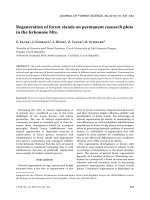
occurs only in few smaller gaps (Fig. 3). e stand
belongs to target management set 21 and air-pollution
zone B. e forest stand is during last two years from
its SW border attacked by bark beetle.
PRP 24 was established in 1980, the forest type is
determined as 8Z4 – rowan-spruce stand with Ca-
lamagrostis. Soil type is modal Podsol. e ground
vegetation cover high (85%) and is dominated by
Calamagrostis villosa and Avenella fl exuosa. us,
the competition of herbal vegetation for resources
is rather high with less suitable conditions for natu-
ral regeneration.
Forest structure
Almost on the entire area of the autochthonous
spruce stand prevails single storeyed stand with low
degree of diff erentiation with partial natural regen-
eration of spruce. Number of tree regeneration is dif-
ferentiated according to canopy cover of the parent
stand, soil surface characteristics (with clear pref-
erence of elevations including CWD) and ground
vegetation and moss cover (preference of mosses
and Avenella fl exuosa). Total number of trees in
regeneration layer is 4,640 ind. per ha. Spruce forms
83%, rowan 17%. e natural regeneration of both
species occurs mainly in small groups and is bound
to elevations and areas with lower canopy cover. e
horizontal structure of the forest stand is shown on
Fig. 3.
e dbh diversifi cation of the forest stand is low
indicating optimal stage of the forest developmen-
tal cycle. Mostly represented are diameter classes
around 35 cm. e representation of individuals in
lower and higher dbh classes constantly decreases.
e height of trees is rather independent on their
dbh, the stand forms expressed horizontal canopy.
e height of trees is between 20 and 25 m. Also
crown height and crown length have no dependen-
cy on the dbh. On the other hand, the h:d ratio is
closely correlated with dbh (with the exception of
the smallest trees). By trees thicker than 40 cm the
ratio decreases slower.
Growth visualisations and forest structure
simulations
Main characteristics used for simulation on PRP 24
– Střední hora:
– altitude: 1,250 m,
J. FOR. SCI., 56, 2010 (11): 518–530 527
45.2
49.7
0.0
43.0
46.6
0.0
Fig. 3.(A) Visualization of forest structure in 1980, (B)
forest structure prediction in 2030, and
(C) forest struc-
ture prediction in 2015 after bark beetle disturbance on
PRP24 – Střední hora. For explanation see Fig. 1
43.0
46.6
0.0
(A) (B)
(C)
528 J. FOR. SCI., 56, 2010 (11): 518–530
Table 5. Indices prediction on PRP 24 – Střední hora after
spontaneous development
Years
Index
R (C&Ei) A (Pi) B (J&Di)
1980 0.924 0.426 3.656
1985 0.924 0.427 3.652
1990 0.939 0.444 3.609
1995 0.901 0.445 3.510
2000 0.908 0.441 3.301
2005 0.935 0.459 3.293
2010 0.943 0.472 3.299
2015 0.924 0.481 3.287
2020 0.960 0.473 3.281
2025 0.939 0.476 3.281
2030 0.939 0.475 3.275
Table 6. Growth tables for spruce stand on PRP 24 – Střední hora based on the simulation of spontaneous development
Period Year
Stand – including dead individuals
tdhfvNGVh:d TCI TAI TPV
1 1980 164 39.4 21.32 0.388 1.008 528 64.5 532 0.541 0 3.24 532
2 1985 169 40.2 21.38 0.386 1.048 528 67.0 553 0.532 4.1 3.27 553
3 1990 174 41.5 21.68 0.383 1.122 480 64.9 539 0.522 4.1 3.29 573
4 1995 179 42.6 21.93 0.382 1.193 436 62.2 520 0.515 4.1 3.32 594
5 2000 184 43.9 22.11 0.380 1.270 392 59.4 498 0.504 4.0 3.34 614
6 2005 189 45.1 22.18 0.377 1.334 380 60.6 507 0.492 3.6 3.35 634
7 2010 194 46.3 22.29 0.376 1.411 360 60.7 508 0.481 2.9 3.35 650
8 2015 199 49.3 22.21 0.370 1.571 200 38.1 314 0.451 2.3 3.33 663
9 2020 204 50.3 22.25 0.369 1.632 196 38.9 320 0.442 2.1 3.30 673
10 2025 209 51.1 22.29 0.369 1.687 196 40.2 331 0.436 2.1 3.27 684
11 2030 214 52.2 22.31 0.367 1.752 192 41.0 336 0.427 2.1 3.24 694
t – average age of stand; d – the average diameter at breast height (cm); h – mean stand height (m); f – form factor; v–average
tree volume (m
3
); N – number of trees per 1 ha; G – basal area per hectare (m
2
·ha
–1
); V – volume of growing stock (m
3
·ha
–1
);
h:d – slenderness ratio; TCI – total current increment (m
3
·ha
–1
·year
–1
); TAI – total average increment (m
3
·ha
–1
year
–1
);
TPV – total production volume (m
3
·ha
–1
)
– forest type: 8Z4,
– natural tree species composition: Spruce 9,
Rowan 1, Betula pubescens, Dwarf pine, Betula
carpatica,
– average age: 164 years,
– vegetation period: 70 days,
– precipitation of the vegetation period: 690 mm,
– annual temperature amplitude: 17.6°C,
– mean temperature of the vegetation period: 7.5°C,
– water saturation: 0.115,
– nutrients saturation: 0.125.
Main forest characteristics:
– Spruce 100, h:d – 21:39, 532 m
3
·ha
–1
, 528 N·ha
–1
,
– Texture – distribution: clumped.
At present (2010) the stand shows slight struc-
tural and age diversifi cation. e stand is domi-
nated by spruce.
– Age of storeys: 15/183 years
– Tree species composition: Spruce 100.
Forest dynamics
e autochthonous spruce forest stand is located
in the 2
nd
zone of the National Park. e tree spe-
cies composition can be characterized as natural.
e spatial and age diff erentiation is low; the mature
overstorey is dominated by spruce, in the natural re-
generation the ratio of rowan slightly increases (V-
et al. 2009). e production potential of the site
is almost completely used, nevertheless with ongoing
bark beetle disturbance the use may decrease. e
forest dynamics are typical for small developmental
cycle with high autoregulation potential (Fig. 3).
Structural diff erentiation of the forest stand
Table 5 gives overview of all three structural in-
dices used in the study. e horizontal structure of
the forest stand was from the fi rst year of obser-
vation slightly aggregated, during the last two de-
J. FOR. SCI., 56, 2010 (11): 518–530 529
cades the spatial pattern of the parent stand moves
to more randomness. e spatial diversity of the
stand is medial with predicted slight decrease af-
ter 2010. e complex diversity of the stand was in
the fi rst year of measurement low with decreasing
tendency. e downgrading was even faster after
1985. Table 6 presents growth variables after spon-
taneous development for the whole stand formed
exclusively by spruce.
CONCLUSIONS
e presented research on structure and develop-
ment of forest stands in national parks of Krkonoše
Mts. describes the stand of forest ecosystems before
during and after the air pollution and subsequent
ecological calamity including the regeneration pro-
cesses. From this point of view the presented re-
sults are unique also in pan-European context. e
structural dynamics of beech, mixed (fi r beech and
spruce beech stands) and spruce stands, relict pine
woods and stands in the ecotone of the upper forest
limit in diff erent site, stand, air-pollution and eco-
logical conditions were examined. e main atten-
tion was paid to areas with autochthonous forests
stands with lowest human impact in the past and at
present. Based on long term observations of verti-
cal and horizontal patterns, structural processes in
relation to abovementioned stand types and par-
ticular developmental phases were evaluated.
On extreme sites after air pollution calamity, at-
tributes of large developmental cycles still play im-
portant role in the development of forest stands
(e.g. the presence of pioneer tree species and intro-
duced allochthonous tree species). Ecologically sta-
ble autochthonous forest stands regenerate within
the small developmental cycle. Natural beech
stands are marked by high age heterogeneity, low
volume and structure variability and small-scale
texture – the smallest of the zonal Central Euro-
pean natural forest. e duration of one mosaic
cycle is not normally longer than 230–250 years.
Mixed forest stands of beech, fi r and spruce are
characterized by a very long developmental cycle
lasting over 350–400 years. is very long period is
mainly infl uenced by the long life span of silver fi r.
Spruce stands in higher mountain areas also show
pronounce dynamics of structural development.
e developmental cycle completes after 300–400
years. In the ecotone of the upper forest limit the
cycle is shorter as result of extreme climatic condi-
tion and normally does not last longer than 120–
200 years. Here, the importance of ecological side
cover increases and trees typically build clumped
structures. In natural pine stands in the Krkonoše
Mts. one developmental cycle completes after
150–240 years as result of fragmentation of these
stand types within the zone of species-rich beech
forest.
Research results presented here were broadly
used for the formulation of management objectives
in given conditions. e authors lay emphasis on
sustainable forest management and on close-to-na-
ture management. A greater emphasis is placed also
on ecosystematic approach to the forest, on transi-
tion to the forest of native populations of tree spe-
cies with natural structures, on individual or group
selection management system and maximum use
of natural processes (e.g. natural regeneration).
After more than 30 years of observations, valu-
able fi ndings as base for appropriate management
of mountain forests were gathered. Nevertheless,
the transition of forest stands after hundreds years
of anthropogenic activities to more “natural” struc-
tures is very long process far overreaching the ho-
rizon of human life. Moreover, as almost all forests
in Europe has been managed, forest restoration has
always had to deal with stands with a composition,
structure and function developed through a histo-
ry of repeated, intense anthropogenic disturbances
(W 2005). Any wood, which is to be treated as
a natural reserve and restored, will inherit a struc-
ture created by past management. From this point
of view this research can be regarded as fi rst step
towards abovementioned objectives of close-to-
nature management of mountain forest ecosystem
not only in Krkonoše Mts., but in similar air-pollu-
tion and ecological conditions throughout Central
Europe.
References
B A. (2000): Comparison of structure and biodiversity
in the Rajhenav virgin forest remnant and managed for-
est in the Dinaric region of Slovenia. Global Ecology and
Biogeography, 9: 201–211.
C P.J., E F.C. (1954): Distance to nearest neighbour
as a measure of spatial relationship in populations. Ecol-
ogy, 35: 445–453.
F M., Ď J. (2005): Tree Growth Simulators.
Zvolen, EFRA: 112. (in Slovak)
J S.C., D A. (1997): Ein Verfahren zur
Beurteilung der Bestandesdiversität. Forstwissenschaftli-
ches Centralblatt, 116: 333–345.
K Š. (1991): Silviculture. Bratislava, Príroda: 475.
(in Slovak)
530 J. FOR. SCI., 56, 2010 (11): 518–530
M K., V S., P V. (2010): Develop-
ment of forest soils in the Krkonoše Mts. in the period
1980–2009. Journal of Forest Science, 56: 485–504.
M T. (2006): Modelling the structure and development
of forest stands using the growth simulator SIBYLA. In:
V S. (ed.): Increasing the Ratio of Close-to-Nature
Structures of Forests with Special Status of Conservation.
Proceedings of Conference. Brno 6. 12. 2006, Brno, Prague,
MUAF, CULS: 7–10. (in Czech)
P H. (2001): Modellierung des Waldwachstums.
Berlin, Wien, Blackwell Wissenschafts-Verlag: 341.
S-T K., S J.P. (2002): e structure of
natural oriental beech (Fagus orientalis) forests in the
Caspian region of Iran and potential for the application of
the group selection system. Forestry, 75: 465–472.
V S. (1990): Analysis of autochthonous spruce popu-
lations on the Strmá stráň in the Krkonoše Mts. Opera
Corcontica, 27: 59–103. (in Czech)
V S. (2000): Structure, development and management of
forest ecosystems in Krkonoše Mts. [DrSc. esis.] Opočno,
Prague, Forestry and Game Management Research Institute,
Czech University of Life Sciences Prague: 684. (in Czech)
V S., M V., V V. (1987): Analysis of autoch-
thonous spruce stands in NNR V Bažinkách. Opera Cor-
contica, 24: 95–132. (in Czech)
Corresponding author:
Prof. RNDr. S V, DrSc., Česká zemědělská univerzita, Fakulta lesnická a dřevařská,
Kamýcká 129, 165 21 Praha 6-Suchdol, Česká republika
tel.: + 420 224 382 870, fax: + 420 234 381 860, e-mail: vacekstanislav@fl d.czu.cz
V S., V V., B Z. (1988): Analysis of autoch-
thonous spruce stands in NNR Rýchory and Boberská stráň.
Opera Corcontica, 25: 13–55. (in Czech)
V S., S J., R J., P V., M T.,
M M., M V., J L., T M.,
J R., S O., K J., V M., L
D., H T., Z M., K F., T J.,
H Š. (2007): Management of Structure-Rich
and Close-to-Nature Forest. Kostelec nad Černými lesy,
Lesnická práce: 447. (in Czech)
V S., V Z., S O., R A., N I.,
B Z., B D., B Z., R V.,
H E., Z D., M M., H
V., B M., B L., M V., Š R., B J.
(2009): Regeneration of Forest Stands on Research Plots in
the Krkonoše National Parks. Kostelec nad Černými lesy,
Lesnická práce: 288. (in Czech)
W A. (2005): Fifty year record of change in tree spatial
patterns within a mixed deciduous forest. Forest Ecology
and Management, 215: 212–223.
Received for publication April 24, 2010
Accepted after corrections June 29, 2010