Báo cáo lâm nghiệp: "Biomass functions applicable to oak trees grown in Central-European forestry" doc
Bạn đang xem bản rút gọn của tài liệu. Xem và tải ngay bản đầy đủ của tài liệu tại đây (913.67 KB, 12 trang )
J. FOR. SCI., 54, 2008 (3): 109–120 109
JOURNAL OF FOREST SCIENCE, 54, 2008 (3): 109–120
Tree biomass equations are tools to express
biomass components in terms of dry mass on the
basis of easily measurable variables. ese are gen-
erally tree diameter at breast height (D) and tree
height (H). Other variables such as crown length,
crown width or tree age are sometimes estimated
in ecosystem studies and specific inventories of
forest ecosystem and may additionally improve the
tree biomass assessment. e information on tree
biomass is required to assess the amount of carbon
held in trees, which in turn represents the basis
of the assessment of carbon stock held in forests.
is leads to the estimation of forest carbon stock
changes, which belongs to reporting requirements
of the parties to the United Nations Framework
Convention on Climate Change and its Kyoto Pro-
tocol. As these policies require transparent and ver-
ifiable reporting of emissions by sources and sinks
related to carbon stock changes in forests, countries
develop suitable methodological approaches to do
so. e fundamental methodological advice on the
carbon reporting from the sector Land Use, Land
Use Change and Forestry (LULUCF) is given in the
Good Practice Guidance (GPG) for the LULUCF
sector (IPCC 2003). GPG encourages using and/or
developing suitable region- and species-specific
tree biomass functions. Tree biomass equations
may be used directly at tree level or as a compo-
nent of biomass expansion factors, which may be
also designed to be applicable to aggregated stand
level data (e.g. L et al. 2004; S et
al. 2007).
Supported by the Ministry of Environment of the Czech Republic, Project CzechCARBO – VaV/640/18/03.
Biomass functions applicable to oak trees grown
in Central-European forestry
E. C, J. A, Z. E, F. T
Institute of Forest Ecosystem Research (IFER), Jílové u Prahy, Czech Republic
ABSTRACT: is study describes the parameterization of biomass functions applicable to oak (Quercus robur, Quer-
cus petraea) trees grown in the conditions of Central-European forestry. It is based on destructive measurements of
51 grown trees sampled from 6 sites in different regions of the Czech Republic important for oak forest management.
e samples covered trees of breast height diameter (D) ranging from 6 to 59 cm, tree height (H) from 6 to 32 m and
age between 12 and 152 years. e parameterization was performed for total aboveground biomass and its individual
components. e two basic levels of biomass functions utilized D either as a single independent variable or in combina-
tion with H. e functions of the third level represented the best function for each biomass component with the optimal
combination of available independent variables, which included D, H, crown length (CL), crown width (CW), crown ratio
(CR = CL/H), tree age and site altitude. D was found to be a particularly strong predictor for total tree aboveground
biomass. H was found to always improve the fit, particularly for the individual components of aboveground biomass.
e contribution of CW was minor, but significant for all biomass components, whereas CL and CR were found useful
for the components of stem and living branches, respectively. Finally, the remaining variables tree age and altitude were
each justified only for one component function, namely living branch biomass and stem bark, respectively. e study
also compares the fitted functions with other available references applicable to oak trees.
Keywords: Quercus robur; Quercus petraea; biomass components; carbon; forest; temperate region
110 J. FOR. SCI., 54, 2008 (3): 109–120
e most important tree species in the Czech Re-
public are European beech, English and sessile oak,
Scots pine and Norway spruce. Recently, several
studies on allometry of these species of temperate
Europe were conducted, including beech (J
et al. 2004; C et al. 2005), pine (C
et al. 2006) and spruce (W et al. 2004). e spe-
cies that has not been in the focus is oak and suit-
able allometric equations applicable to oak are still
missing. e reported studies on oak species include
H (2002), who provided equations for
bulk aboveground biomass applicable to oak, but this
study did not include individual components. Very
recently, Austrian scientists reported branch biomass
equations for oak grown in admixtures together with
other species (G, S 2006;
L, N 2006). Outside Europe, a
pooled function for aboveground biomass of broad-
leaves including oak species is available (S
et al. 1997). A rigorous quantification of total tree
biomass for a certain region requires locally pa-
rameterized allometric equations, optimally based
on representative and large sampling. In practice,
however, sampling is limited since biomass studies
are generally very laborious and costly.
Here, we parameterize allometric equations based
on destructively measured components of 51 grown
oak trees from 6 selected regions. e aim of this
paper was to determine and parameterize allom-
etric equations for oak trees (Quercus robur L. and
Quercus petraea (Matt.) Liebl.) grown in classically
managed oak-dominated stands in the conditions
of Central-European temperate forestry. These
functions could be used for the quantification of
total aboveground biomass and individual tree
components, i.e. stem (over and under bark), living
branches, dead branches and stem bark.
MATERIAL AND METHODS
Generally, the study is based on tree sampling that
was aimed at covering the most important regions
for oak forest management in the Czech Republic.
At each site, 8–9 trees were measured in standing
position and thereafter measured again after felling
and destructively sampled to estimate biomass and
wood density. e site description and sampling are
given below.
Site description and tree sampling
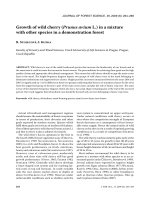
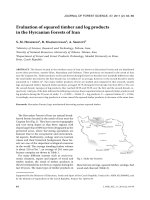
Altogether six locations (Nymburk, Křivoklát,
Lanžhot, Bučovice, Buchlovice and Slapy) were iden-
tified for destructive biomass sampling including
Oak proportion (%)
0.0–10.0
10.1–20.0
20.1–30.0
30.1–39.0
39.1–50.0
50.1–60.0
60.1–66.3
Locality and FST
Fig. 1. e map of six locations selected for destructive sampling and measurement of oak trees. e labels indicate the forest
site type (FST) according to the local typological classification (see Material and Methods)
J. FOR. SCI., 54, 2008 (3): 109–120 111
51 trees. e sites represented the most important
regions for the growing of oak in this country (Fig. 1).
e sites represented typical growth conditions with
site index 1 to 5 (Table 1) of the possible range (1 to
9). e forest site types according to the local forest
typological system represented a range of condi-
tions from fertile (1L, 2H, 3B), medium fertile (1O,
3S) to a poorer site class (2K). e typical altitude
for oak management in this country includes mostly
lowlands, which is reflected in the range of sample
site altitudes between 150 and 430 m a.s.l. At each
site, oak was a dominant species with a proportion
between 40 and 100%. Altogether 8 to 9 trees per
site were selected for destructive sampling so as to
cover the full range of dimensions. e trees were
selected subjectively to represent typical trees of
the main canopy layer for selected sites, site class
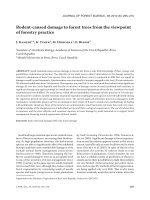
and stands. e diameter height relationship for all
sample trees (n = 51) classified by site locations is
shown in Fig. 2.
Sampling of trees at all sites was conducted in
early spring before bud break. All selected trees were
measured both standing and lying on the ground
after felling. All basic measurable information was
recorded, including tree diameter along the stem axis
in 1-m intervals, tree height, crown base and stem
diameter at the point of the crown base, height of the
green crown and bark thickness.
e biomass components were assessed either
from direct measurements or from in situ weighing
and later oven-drying of biomass samples. Stem and
stem bark volume was assessed using diameter and
bark thickness measurements in 1-m intervals. ese
components in volume units were converted to bio-
mass using the conventional density of 580 kg/m
3
for stem wood and 300 kg/m
3
for bark, respectively
(IPCC 2003). Living branch biomass was assessed
on the basis of fresh to oven-dry weight ratio, which
was estimated from selected branches from three
segments of the tree crown of each sample tree.
Oven-drying of segments was performed at a tem-
perature of 90°C for a period of about 8 days. e
total aboveground biomass was represented by the
sum of stem-wood over bark and living branches.
e component of dead branches was treated sepa-
rately (and biomass equations estimated specifically,
see below) due to the mostly insignificant quantity
(see Results) and it was not included in the above-
ground biomass. As the sampling was conducted in
a leafless stage prior to bud break, no leaf biomass
was considered in this study.
Biomass functions
e pooled dataset of all trees and their compo-
nents was used for the parameterization of biomass
equations. e analyzed biomass components in-
cluded total aboveground biomass, stem over bark,
Table 1. Site description including the Natural Forest Region (NFR), forest site type (FST), site index in relative and
absolute units, oak proportion in sampled stands, site altitude, number of sampled trees and their stem diameter and
height range
NFR
Forest
Enterprise
FST
Altitude
(m)
Site class
(–, m)
Oak
proportion (%)
Tree No.
(n)
Diameter (cm)
Height
(m)
17 Nymburk 1O 210 3–5 (24–22) 80–100 8 9.5–52.5 10.7–23.0
35 Lanžhot 1L 150 1–2 (32–28) 80–100 9 8.3–59.0 6.2–22.3
36 Bučovice 2H 300 3–5 (24–22) 50–80 8 12.3–46.6 14.7–29.2
9 Křivoklát 2K 300 4–5 (24–22) 80–100 9 6.4–36.5 6.2–22.3
36 Buchlovice 3B 430 2–3 (28–26) 50–90 8 12.1–42.4 15.5–28.6
10 Slapy 3S 360 4–5 (26–24) 40–70 9 9.6–39.7 8.1–26.9
0 10 20 30 40 50 60
D (cm)
0
5
10
15
20
25
30
35
T
r
e
e
h
e
i
g
h
t
(
m
)
Slapy
Nymburk
Lanzhot
Krivoklat
Bucovice
Buchlovice
35
30
25
20
15
10
5
0
Tree height (m)
0 10 20 30 40 50 60
D (cm)
Buchlovice
Bučovice
Křivoklát
Lanžhot
Nymburk
Slapy
Fig. 2. Tree diameter at breast height (D) and tree height for
all sample trees (n = 51) classified by site locations
112 J. FOR. SCI., 54, 2008 (3): 109–120
stem under bark, living and dead branches and stem
bark.
e most common form of biomass functions (e.g.
Z, M 2004) used to estimate tree
aboveground tree biomass (Y) and its components
is the power form
Y = p
0
× D
p1
(1)
where: D – diameter at breast height, representing the
independent variable,
p
0
, p
1
– parameters to be fitted.
Other fundamental information on trees is tree
height (H), which is often used to differentiate
growth conditions at different sites and commonly
serves as a basis for expressing the site index for the
purpose of forest management planning. Hence, the
inclusion of tree height is crucial for merging data
sets from different sites. e most commonly used
functional dependence of the biomass components
on the two basic measurable independent variables,
i.e. D and H, has the form as follows:
Y = p
0
× D
p1
× H
p2
(2)
where: p
0
, p
1
, p
2
– three parameters of the equation.
However, it is to note that in allometric studies the
nonlinear regression analysis is often avoided using
the logarithmic linearization of the power functions,
which can be exemplified as below:
lnY = p
0
+
p
1
× lnX
1
+ p
2
× lnX
2
+ p
3
× lnX
3
+ p
n
× lnX
n
+ ε (3)
Eq. (3) contains the independent variables X
1
to X
n
and a corresponding set of parameters p
0
to p
n
, while
ε represents an additive error term. While the lin-
earization permits a common linear regression pro-
cedure to be applied and stabilizes variance across
the observed tree dimensions, this transformation
produces a bias and must be statistically treated (e.g.
S 1983; Z 1996). is is commonly done by
setting a correction component estimated as a half
of the standard error of the estimate of parameter-
ized Eq. (3) (e.g. Z et al. 2005), which is added
to the linearized equation for the exponential back-
transformation, although no standard correction
has been proposed yet. Instead, M (1987)
calculated a model specific correction factor λ from
the data as
n
Σ
Y
i
λ =
i=1
(4)
n
Σ
e
lnŶ
i
i=1
where: n – number of sample trees,
Y
i
, Ŷ
i
– represent the observed and fitted values.
is method ensures that the mean predicted value
is equal to the mean observed value. Hence, an un-
biased estimate of Y is given as
Ŷ = λ × exp( p
0
+
p
1
× lnX
1
+ p
2
× lnX
2
+ p
3
× lnX
3
+ p
n
× lnX
n
) (5)
e approach of linearization and general linear
model were used for the parameterization of biomass
functions for aboveground biomass and all other
components besides dead branches. For each of
these components three functions were determined
using the linearized model (Eq. 3), namely (
i) that
utilizing solely D, (ii) that combining D and H, and
(iii) the best function detected by a step-wise re-
gression procedure that tested the combination of
the available independent predictors, namely D, H,
altitude (Z), tree age (A), crown length (CL), crown
width (CW) and crown ratio (CR) defined as CL/H.
As for the component of dead branches with
several zero values involved, the non-linear regres-
sion procedure with Eqs. (1) and (2) was applied
to determine a suitable biomass function and its
parameters.
e mean relative prediction error (MPE; %) was
calculated as follows (see e.g. N et al. 1999):
100
n
MPE = –––
Σ |
Y
i
– Ŷ
i
|/
Y
i
(6)
n
i=1
When calculating MPE for dead branches, only
the trees with non-zero observed values were taken
into account.
e test of equality of regression equations ob-
tained from different sample sites was performed for
the optimal equations for aboveground biomass and
living branch biomass using the Chow criterion as it
was described in our earlier study (C et al.
2006). e criterion calculated for each pair of sites is
compared with table values of F-distribution taking
into account the amount of parameters and standard
deviations of residuals of the tested sites.
Reference stand
For a quantitative analysis of the parameterized
allometric equations of this study and available
equations published elsewhere, a fictitious oak stand
of young (25 years), medium (50 years) and old
(100 years) age was generated. is was done on the
basis of Czech growth and yield tables (Č et al.
1996) and its software derivative, growth and yield
J. FOR. SCI., 54, 2008 (3): 109–120 113
model SILVISIM (e.g. Č 2005). e prescribed
stand characteristics corresponded to a typically
managed oak stand of site index 3 (slightly above-
average conditions) with a management regime set
to full stocking. Stand characteristics for the exem-
plified stand age phases (young, medium and old)
are given in Table 2 and the frequency distribution
of trees in this example stand at 25, 50 and 100 years
of age is shown in Fig. 3.
RESULTS
Biomass equations and contribution
of independent variables
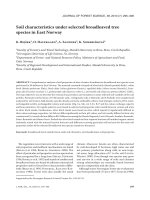
e dependence of the observed values of above-
ground biomass (AB) on the independent variables
breast height diameter (D), tree height (H), crown
length (CL), crown width (CW) and age is shown in
Fig. 4. is relation was typically exponential for all
independent variables. As expected, D produces the
clearly strongest relationship, while the dependence
of AB on other variables produces larger scatter.
e regression analysis performed for all biomass
components reflected the above observations. e
estimated biomass equations for all biomass com-
ponents except dead branches are listed in Table 3,
while Table 4 shows the results for the component
of dead branches. It can be observed that the gen-
erally best fit was obtained for the component of
aboveground biomass and stem biomass over and
under bark, explaining most of the total variation in
the observed data on a logarithmic scale (Table 3).
Only the slightly weaker match was found for the
component of bark (about 97%). Somewhat weaker
was the fit for the component of living branches,
which ranged between 90 and 93% for the set of ap-
plied equations. ese observations for logarithmi-
cally transformed variables were magnified in terms
of the mean prediction error (MPE) using the real
values. For the optimal models, MPE reached about
5–6% for the components of aboveground biomass
and stem, while it increased to 15.5 and 29% for bark
biomass and living branches, respectively (Table 3).
Generally, the inclusion of tree height (H) and
other independent variables in equations always
improved the fit for biomass components relative
to the equation including only a single independent
variable D. H usually helped to explain the variation
of logarithmically transformed variable by additional
0.5 to 1% (Table 3). In terms of the mean prediction
error (MPE), however, the inclusion of tree height
always meant a notable MPE reduction (Table 3).
As for information on the tree crown, it helped
to improve the regression estimates for all tested
biomass components. e optimal combination of
independent variables for each component always
included crown width (CW), whereas other variables
worked differently for individual biomass compo-
nents. e optimal equation for stem biomass (under
or over bark) included, besides D and H, both CW
and crown length (CL). However, the effect of these
additional variables was rather small relative to the
function combining just D and H: the improvement
in the explained variability on a logarithmic scale
was barely significant, although MPE was further
Table 2. Stand characteristics of a generated test stand exemplifying the typical management of oak; mean stand height,
basal area and stocking density (N) are shown for each stand age
Stand Age (years) Mean stand height (m) Basal area (m
2
/ha) N (trees/ha)
Young 25 11.1 20.7 3,626
Medium 50 19.3 26.5 1,004
Old 100 26.0 32.9 323
0 10 20 30 40 50 60
D
(cm)
400
800
1200
N
(
t
r
e
e
s
/
h
a
)
100
50
25
Age (years)
1,200
800
400
N (trees/ha)
0 10 20 30 40 50 60
D (cm)
50
100
Age (years)
Fig. 3. Frequency histogram of tree diameters (D) for a ficti-
tious managed stand of oak at 25, 50 and 100 years of age, site
class 3. e corresponding stand characteristics are shown in
Table 1. Note that for clarity the y-axis is shown on a power-
transformed (0.5) scale
25
114 J. FOR. SCI., 54, 2008 (3): 109–120
reduced by about one half percent (Table 3). e
component of living branch biomass was best ap-
proximated with the function combining D, crown
ratio (CR) and altitude (Z). Finally, bark biomass
was best approximated using the combination of D,
H, CW and age (A). Including CW and A helped to
reduce MPE to 15.5%, which was an improvement by
over 2% relative to the Level 2 equation combining
D and H only (Table 3).
e results of nonlinear fitting performed for the
biomass of dead branches (Table 4) revealed that H
was important for estimation of this component. It
improved the fit by about 33% relative to the basic
estimation using only D. Note, however, that MPE
did not correspondingly improve for the equation
combining D and H, which is due to the fact that
zero-values were omitted in the MPE calculation.
e contribution of other variables to dead biomass
0 10 20 30 40 50 60
D (cm)
0
500
1000
1500
2000
2500
3000
A
B
(
k
g
/
t
r
e
e
)
Slapy
Nymburk
Lanzhot
Krivoklat
Bucovice
Buchlovice
LOCATION
0 10 20 30 40
Tree height (m)
0
500
1000
1500
2000
2500
3000
A
B
(
k
g
/
t
r
e
e
)
Slapy
Nymburk
Lanzhot
Krivoklat
Bucovice
Buchlovice
LOCATION
0 5 10 15 20
Crown length (m)
0
500
1000
1500
2000
2500
3000
A
B
(
k
g
/
t
r
e
e
)
Slapy
Nymburk
Lanzhot
Krivoklat
Bucovice
Buchlovice
LOCATION
0 2 4 6 8 10 12
Crown width (m)
0
500
1000
1500
2000
2500
3000
A
B
(
k
g
/
t
r
e
e
)
Slapy
Nymburk
Lanzhot
Krivoklat
Bucovice
Buchlovice
LOCATION
0 40 80 120 160
Age (years)
0
500
1000
1500
2000
2500
3000
A
B
(
k
g
/
t
r
e
e
)
Slapy
Nymburk
Lanzhot
Krivoklat
Bucovice
Buchlovice
LOCATION
LOCatIOn
● Buchlovice
× Bučovice
+ Křivoklát
▲ Lanžhot
□ Nymburk
Slapy
0 40 80 120 160
Age (years)
3,000
2,500
2,000
1,500
1,000
500
0
AB (kg/tree)
AB (kg/tree) AB (kg/tree)
AB (kg/tree) AB (kg/tree)
3,000
2,500
2,000
1,500
1,000
500
0
3,000
2,500
2,000
1,500
1,000
500
0
3,000
2,500
2,000
1,500
1,000
500
0
3,000
2,500
2,000
1,500
1,000
500
0
0 10 20 30 40 50 60
D (cm)
0 5 10 15 20
Crown length (m)
0 2 4 6 8 10 12
Crown width (m)
0 10 20 30 40
Tree height (m)
Fig. 4. e observed values of aboveground biomass (AB)
plotted against tree diameter (D), tree height, crown length,
crown width and age, classified by site locations
J. FOR. SCI., 54, 2008 (3): 109–120 115
Table 3. Estimated parameters (p
0
to p
7
) of biomass equations for individual tree components using the form of Eq. (3) with one independent variable (D; Level 1), two independent
variables (D, H; Level 2) and the best combination detected from the available set of independent variables, namely D, H, CL, CW, CR, A and Z (Level 3). e adjusted coefficient
of determination (R
2
adj
), mean square error (SE; in log units), correction factor (λ) and mean prediction error (MPE; %) are also listed for the fit of each equation
Component Level p
0
p
1
p
2
p
3
p
4
p
5
p
6
p
7
R
2
adj
SE λ MPE
Aboveground biomass
1 –2.380 2.549 0.991 0.122 0.974 9.7
2 –3.069 2.137 0.661 0.996 0.084 0.999 6.9
3 –2.944 1.935 0.738 0.193 0.997 0.076 0.994 6.0
Stem biomass over bark
1 –2.652 2.578 0.987 0.154 0.962 12.5
2 –3.731 1.933 1.036 0.998 0.063 0.999 5.3
3 –3.629 1.861 1.097 –0.098 0.101 0.998 0.059 0.996 4.9
Stem biomass under bark
1 –2.828 2.599 0.985 0.166 0.962 13.4
2 –3.964 1.920 1.089 0.997 0.077 1.000 6.3
3 –3.827 1.794 1.172 –0.100 0.153 0.997 0.071 0.997 5.6
Branch biomass
1 –3.687 2.363 0.898 0.407 1.149 40.4
2 –2.707 2.949 –0.940 0.906 0.391 1.097 36.7
3 –4.131 2.014 0.625 0.957 0.260 0.928 0.343 1.072 29.5
Bark biomass
1 –4.426 2.419 0.967 0.230 0.987 18.2
2 –5.027 2.059 0.577 0.970 0.218 1.007 17.7
3 –5.206 1.961 0.403 –0.252 0.340 0.975 0.200 1.019 15.5
Biomass component = λ × exp(p
0
+ p
1
× lnD + p
2
× lnH + p
3
× lnCL + p
4
× lnCW + p
5
× lnCR + p
6
× lnA + p
7
× lnZ)
116 J. FOR. SCI., 54, 2008 (3): 109–120
(75%), while the biomass of living branches, stem-
bark, and dead branches constituted on average
16.2, 8.1 and 0.7%, respectively. Using the fictitious,
typically managed oak stand at different age (Table 2,
Fig. 3), the parameterized biomass equations showed
that stem biomass already dominates (71% propor-
tion of AB) once the stand is 25 years old, but its
relative proportion remains about constant between
50 and 100 years reaching about 76% of AB (Fig. 5).
Similarly, the proportion of living branch biomass
decreased from 20% in the young stand to about
15–16% for 50 and 100 years old managed stand of
oak. e proportion of stem bark remained relatively
constant for different stands stages, declining slightly
from about 9 to 8%. Note, however, that for the above
fictitious stand-level comparison, the selection of an
applicable biomass equation was limited to Level 2
models, i.e. using independent variables limited to
tree diameter, height and age. is was determined
by model-generated stand data. e match of the
absolute values for stand AB estimated either from
the single function or as the sum of component
prediction was also tested, but it did not further
improve the results obtained for the fit of Eq. (2)
combining solely D and H.
Since the data on tree biomass used in this study
were collected from different locations (Fig. 1), it
was important to analyze the effect of different loca-
tions on the parameterized regression functions. e
Chow test showed no significant differences between
the regression equations obtained for different plots
at 5% confidence level. Although insignificant, a
somewhat higher test criterion relative to other pairs
of sites was observed for AB between the site Nym-
burk and other sites. Similarly, a somewhat higher
criterion was observed for branch biomass between
the site Slapy and other sites.
Components of aboveground biomass
e mean observed aboveground biomass (AB)
of the tree sample set analyzed here (n = 51) was
536.0 kg, with the corresponding mean
D of 26.3 cm
and H of 21.3 m. It was dominated by stem biomass
Table 4. e component of dead branches – the results of non-linear regression analysis applied to Eqs. (1) and (2),
showing parameter values, asymptotic standard error (A.S.E.), Wald confidence intervals, adjusted coefficient of
determination (R
2
adj
) of the fit and prediction error (MPE; %; calculated with non-zero values only)
Equation Parameter Value A.S.E.
95% confidence interval
R
2
adj
MPE
lower upper
Y = p
0
× D
p1
p
0
0.4E–5 0.9E–5 –1.4E–5 2.2E–5
0.61 48.6
p
1
3.932 0.570 2.787 5.077
Y = p
0
× D
p1
× H
p2
p
0
0.004 0.005 –0.006 0.014
0.94 54.9p
1
5.712 0.305 5.100 6.324
p
2
–4.186 0.270 –4.728 –3.644
25 50 100
Age (years)
0
10
20
30
40
50
60
70
80
90
100
S
h
a
r
e
(
%
)
Dead branches
Living branches
Bark
Stem under bark
Share (%)
Stem under bark
Bark
Living branches
Dead branches
100
90
80
70
60
50
40
30
20
10
0
25 50 100
Age (years)
Fig. 5. The relative proportions of
biomass components for examples of
young (25 yrs), medium (50 yrs) and
old (100 yrs) stand of oak that is man-
aged according to common forestry
practice
J. FOR. SCI., 54, 2008 (3): 109–120 117
functions for stem biomass under bark, bark, living
branches and dead branches was also explored on
the above fictitious oak stand managed in a classical
way at 25, 50 and 100 years of age (Table 2, Fig. 3).
e estimated aboveground biomass from a single
equation reached 83.2, 168.2 and 275.4 Mg/ha, while
the estimation from the summed biomass compo-
nents was 83.8, 168.8 and 274.9 Mg/ha for the young,
medium and old stand, respectively. is means that
for the young and medium stand the additive estima-
tion of AB from biomass component equations was
higher by 0.7 and 0.4%, respectively, as related to the
single-equation estimate, whereas the above differ-
ence in the single and composed biomass estimation
was –0.2% for the old stand.
DISCUSSION
Optimal equations
e selection of appropriate biomass functions is
driven by the intention to find the best prediction
using the available set of independent variables.
Although the biomass functions may use many inde-
pendent variables to reduce the prediction bias, it is
always desirable to keep the set of predictors as small
as possible to reduce the variability of predictions
(W et al. 2004). Generally, the most easily meas-
urable and also the absolutely fundamental variable
is D, while the measured H and other tree variables
such as crown length and width are less frequent.
To save costs, forest inventories commonly use a
subset of H measurements and estimate H for the
remaining trees by regression approaches or other
statistical methods, such as the method of k-nearest
neighbours (e.g. S et al. 2001). Crown pa-
rameters are mostly measured in specific ecosystem
studies, while they are often omitted when biomass
or tree volume is to be inventoried on larger scales.
Hence, it was important to note that single variable
Eq. (1) utilizing solely D was able to explain as much
as 99% of the variability in the observed aboveground
biomass of oak: this applies to both logarithmically
transformed values (results reported in Table 3) and
direct observations once estimated by non-linear
regression with Eq. (1) (results not shown here). is
was more than reported for pine (C et al.
2006), which was sampled in a similar manner to oak
in this study. On the other hand, D explained just
over 70% of the variability in the observed branch
biomass (untransformed values, not shown here) or
90% of log-transformed values. is is basically iden-
tical as the values reported for oak branch biomass
by L and N (2006).
e importance of additional independent vari-
ables increased for the estimation of individual tree
components. eir contribution can be best seen on
improving the error of prediction (MPE, Table 3).
For example, stem biomass predicted with both D
and H as independent variables decreased MPE by
more than 50% relative to the prediction using D
only. As for additional information on the tree crown
(CL, CW or CR), it proved to be useful mainly for
the component of living branches and aboveground
biomass that include living branches. is is in line
with the other independent studies, which proved
the importance of crown variables for the predic-
tion of branch biomass either for oak or other tree
species (e.g. W et al. 2004; L, N-
2006; G, S 2006).
e use of the independent variable crown ratio
(CR) combining the information on tree height and
crown length was found optimal for the prediction
of branch biomass, but not for other components.
is also applies to altitude (Z), which did not have
any pronounced effect except branch biomass. Ob-
viously, Z as a good proxy of climatic conditions is
pronounced in tree allometry mainly for those spe-
cies that are grown in a substantially larger elevation
range. Hence, Z was found to be an important pre-
dictor for aboveground biomass of beech (J
et al. 2004), stem and aboveground biomass of pine
(C et al. 2006). e small importance of Z
reflects the fact that oak forestry in this country is
located at the lower elevations with a rather small
range to be pronounced in the sample set analyzed
here. A similar reasoning could be given for the
independent variable of tree age (A). e managed
forests of oak sampled in our study suppressed the
effect of age in tree allometry, and a significant
contribution of A was detected only in the equation
applicable to bark biomass (Table 3). On the other
hand, accurate estimation of bark biomass for oak is
needed, as this species is known to have the largest
proportion of bark in aboveground biomass among
the forest tree species grown in Central Europe.
erefore, the optimal equation (Level 3 in Table 3)
should be prioritized over the other alternatives for
the assessment of bark biomass once the required
independent variables are available. Interestingly,
the relative proportion of bark biomass was shown
not to be increasing with age (Fig. 5). e estimation
performed on the fictitious oak stand suggested a
relatively constant proportion of 8–9% on the total
aboveground biomass. It should be noted that this
proportion is not identical to the volume proportion
because different densities (see the methods) were
applied to stem bark and stem wood. It implies that
118 J. FOR. SCI., 54, 2008 (3): 109–120
on a volume basis, the proportion of oak bark would
reach about 15% of the aboveground biomass.
e obtained mean prediction errors (MPE) for the
optimal equations applicable to individual biomass
components (Level 3 in Table 3) were compared with
the errors estimated in the same way for Scots pine
based on the results of our earlier study (C
et al. 2006). e comparison showed a marginally
better prediction for oak compared to pine for all
components except bark biomass. us, the errors
for pine, calculated according to Eq. (6), would reach
7.4, 7.3, 11.0, 32.3 and 56.5% for aboveground bio-
mass, stem under bark, bark, living branches and
dead branches, respectively. is is to be compared
with the current estimates for oak, which reached
6.0, 5.6, 15.5, 31.0, 54.9 and 6.0% for the respective
biomass components of oak (Tables 3 and 4). ese
results are promising and suggest that the biomass
estimation of broadleaved species grown in managed
stands may not be associated with larger prediction
errors as compared to coniferous species. Note,
however, that in our study, variability in wood den-
sity was basically neglected by assuming single den-
sity values for stem and bark components. Hence,
natural variation in stem-wood and bark density
was not considered and this would have resulted in
additional uncertainty that was not included in our
estimates.
In this study, we showed that composed biomass
functions matched the single equation for above-
ground biomass well in terms of the absolute values.
However, as follows also from the assessed MPE for
individual biomass components, in order to reduce
the prediction error, it is always advisable to develop
and/or apply a single biomass equation instead of
combining the component functions for the estima-
tion of aboveground biomass.
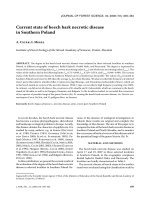
e literature presenting biomass equations for
oak grown in the conditions of temperate European
forestry is very scarce. We may compare a published
equation applicable to aboveground biomass for
oak in the coppice-with-standards type of forest
grown in Austria (H 2002) and another
widely used reference for aboveground biomass for
broadleaves suggested by IPCC (2003), namely that
of S et al. (1997). e latter study gives a
robust function parameterized on several hundreds
of broadleaved trees (including oak species) from NE
of USA. Both equations include only one independ-
ent variable, namely D. It is surprising to note that
these equations matched the observed oak biomass
used in this study fairly well (Fig. 6). Although the
function of H (2002) systematically
overestimates AB for the diameter range up to 40 cm,
which contributes to a relatively large MPE (33.5%)
estimated for this function relative to the observed
data. However, it fits the large-diameter trees fairly
well considering the fact that the function was esti-
mated on limited material from a specifically man-
10 20 30 40 50 60 70
D
(cm)
600
1200
1800
2400
3000
A
B
(
k
g
/
t
r
e
e
)
This study
Schroeder
et al.
Hochbichler
Observations
10 20 30 40 50 60 70
D (cm)
AB (kg/tree)
3,000
2,400
1,800
1,200
600
Observations
H
S et al.
is study
10 20 30 40 50 60 70
D
(cm)
150
300
450
600
B
B
(
k
g
/
t
r
e
e
)
This study
Austria 3
Austria 1
Observations
600
450
300
150
BB (kg/tree)
Observations
Austria 1
Austria 3
is study
10 20 30 40 50 60 70
D (cm)
Fig. 6. Aboveground biomass (AB) of sample oak trees (ob-
servations) and their corresponding functional values by
H (2002), S et al. (1997) and Level 3
function (this study, Table 3) plotted against tree diameter at
breast height (D). Note that for clarity both axes were power-
transformed by the value 0.5
Fig. 7. Branch biomass (AB) of sample oak trees (observations)
and their corresponding functional values by the functions of
L and N (2006; Austria 1 and Austria 3
for a simple relationship to D and a more complex function,
respectively) and Level 3 function (this study, Table 3) plotted
against tree diameter at breast height (D). Note that for clarity
both axes were power-transformed by the value 0.5
J. FOR. SCI., 54, 2008 (3): 109–120 119
aged oak stands in Austria. Even better match was
found with the general function for broadleaves of
S et al. (1997). It corresponds well to
our observations across the whole diameter range
(Fig. 6) and hence the estimated MPE was as low
as 10.6%. Although the Level 3 function estimated
by us is still considerably better in terms of MPE,
S et al. (1997) should rather be compared
with our Level 1 function deploying solely D, which
gave only a marginally better MPE (Table 3). When
comparing these functions on the absolute values
to detect systematic errors, the function of H-
(2002) indicated overestimation by 10.5%,
whereas that of S et al. (1997) gave smaller
values by 9.6% relative to the mean tree aboveground
biomass of our oak sample set.
A similar comparison of component functions ap-
plicable to oak remains limited to the functions ap-
plicable to branch biomass (BB) from by the recently
published studies of L and N
(2006) and G and S (2006).
Of these, the latter study considers branches with a
minimum diameter threshold of 5 cm, which makes
it not directly comparable with our material. e
comparison of the oak branch biomass functions
determined by L and N (2006)
with the observed data and functions from this study
is shown in Fig. 7. It can be seen that the function
using solely D (Austria 1) matches data fairly well up
to D of 35–40 cm, while the more complex function
deploying both D and CR (Austria 3) works gener-
ally better for larger trees. To evaluate these differ-
ent functions, one may apply relative or absolute
measures. For example, MPE estimated for the two
selected functions of L and N
(2006) relative to our observed data reached 37 and
61%, respectively. At the same time, the quantitative
comparison on our oak sample set indicated that the
simple equation (Austria 1 in Fig. 7) would system-
atically underestimate the observed values by 30%,
whereas the more complex function (Austria 3 in
Fig. 7) reached 95.9% of the mean observed branch
biomass. is is practically as much as observed with
our optimal equation (Level 3; Table 3), although
MPE (indicating random error) was naturally much
higher as compared to our function. is good cor-
respondence of two independently estimated equa-
tions gives confidence in branch biomass estimation
for oak grown in temperate Europe.
CONCLUSIONS
is study provides a set of parameterized equa-
tions applicable to total aboveground biomass
and individual components for oak (Q. robur and
Q. petraea)
species as grown in Central-European
forestry. Tree diameter at breast height was shown to
be a very strong predictor of aboveground biomass,
although considering other independent variables
such as tree height and information in the equation
on crown naturally improved the fit. e contribu-
tion of additional variables was more significant
for individual biomass components, always notably
reducing the estimation uncertainty. e variables
describing crown were specifically crucial for the es-
timation of living branches. Altitude was not shown
to be a useful predictor for any biomass component
except bark. Similarly, tree age was found to facilitate
only the prediction of branch biomass. Although the
study demonstrated a very good match between the
single estimate of aboveground biomass and its com-
position by individual parameterized component
functions, it is always recommended to prioritize
the single equation for total aboveground biomass
in order to minimize the assessment error.
R e fe r en c es
CIENCIALA E., APLTAUER J., ČERNÝ M., EXNEROVÁ Z.,
2005. Biomass functions applicable for European beech.
Journal of Forest Science, 51: 147–154.
CIENCIALA E., ČERNÝ M., TATARINOV F., APLTAUER J.,
EXNEROVÁ Z., 2006. Biomass functions applicable to Scots
pine. Trees – Structure and Function, 20: 483–495.
ČERNÝ M., PAŘEZ J., MALÍK Z., 1996. Růstové a taxační
tabulky hlavních dřevin České republiky (smrk, boro-
vice, buk, dub). Příloha č. 3 vyhlášky MZe č. 84/1996
Sb. o lesním hospodářském plánování. Jílové u Prahy,
IFER: 245.
ČERNÝ M., 2005. Růstové modely hlavních dřevin České
republiky a způsoby jejich využití v kombinaci s daty
Národní inventarizace lesů v České republice. In: NEU
HÖFEROVÁ P. (ed.), Růstové funkce v lesnictví, 31. 5. 2005,
Kostelec nad Černými lesy. Praha, ČZU, FLE: 47–56.
GSCHWANTNER T., SCHADAUER K., 2006. Branch
biomass functions for broadleaved tree species in Austria.
Austrian Journal of Forest Science, 123: 17–34.
HOCHBICHLER E., 2002. Vorläufige Ergebnisse von Bio-
masseninventuren in Buchen- und Mittelwaldbeständen.
In: DIETRICH H.P., RASPE S., PREUSHSLER T. (eds),
Inventur von Biomasse- und Nährstoffvorräten in Wald-
beständen. Forstliche Forschungsberichte, Heft 186,
München, LWF: 37–46.
IPCC, Good Practice Guidance for Land Use, Land-Use
Change and Forestry, 2003. Hayama, Institute for Global
Environmental Strategies (IGES).
JOOSTEN R., SCHUMACHER J., WIRTH C., SCHULTE A.,
2004. Evaluating tree carbon predictions for beech (Fagus
120 J. FOR. SCI., 54, 2008 (3): 109–120
sylvatica L.) in western Germany. Forest Ecology and Man-
agement, 189: 87–96.
LEDERMANN T., NEUMANN M., 2006. Biomass equations
from data of old long-term experimental plots. Austrian
Journal of Forest Science, 123: 47–64.
LEHTONEN A., MAKIPAA R., HEIKKINEN J., SIEVANEN
R., LISKI J., 2004. Biomass expansion factors (BEFs) for
Scots pine, Norway spruce and birch according to stand
age for boreal forests. Forest Ecology and Management,
188: 211–224.
MARKLUND L.G., 1987. Biomass functions for Norway
spruce (Picea abies (L.) Karst.) in Sweden. [Report.] Umea,
Department of Forest Survey, Swedish University of Agri-
cultural Sciences: 43.
NELSON B.W., MESQUITA R., PEREIRA J.L.G., DE SOUZA
S.G.A., BATISTA G.T., COUTO L.B., 1999. Allometric re-
gressions for improved estimate of secondary forest biomass
in the central Amazon. Forest Ecology and Management,
117: 149–167.
SCHROEDER P., BROWN S., MO J., BIRDSEY R., CIESZEW-
SKI C., 1997. Biomass estimation for temperate broadleaf
forests of the United States using inventory data. Forest
Science, 43: 424–434.
SIRONEN S., KANGAS A., MALTAMO M., KANGAS J.,
2001. Estimating individual tree growth with the k-nearest
neighbour and k-most similar neighbour methods. Silva
Fennica, 34: 453–467.
SOMOGYI Z., CIENCIALA E., MÄKIPÄÄ R., MUUKKO-
NEN P., LEHTONEN A., WEISS P., 2007. Indirect methods
of large scale forest biomass estimation. European Journal
of Forest Research, 126: 197–207.
SPRUGEL D.G., 1983. Correcting for bias in log-transformed
allometric equations. Ecology, 64: 209–210.
WIRTH C., SCHUMACHER J., SCHULZE E.D., 2004. Generic
biomass functions for Norway spruce in Central Europe –
a-meta-analysis approach toward prediction and uncer-
tainty estimation. Tree Physiology, 24: 121–139.
ZAR J.H., 1996. Biostatistical Analysis. Prentice-Hall, Eng-
lewood Cliffs, NJ.
ZIANIS D., MECUCCINI M., 2004. On simplifying allometric
analyses of forest biomass. Forest Ecology and Management,
187: 311–332.
ZIANIS D., MUUKKONEN P., MAKIPAA R., MENCUCCINI
M., 2005. Biomass and stem volume equations for tree spe-
cies in Europe. Silva Fennica, Monographs, 4: 63.
Received for publication November 27, 2007
Accepted after corrections January 7, 2008
Stanovení alometrických rovnic pro biomasu stromů dubu pěstovaného
v podmínkách středoevropského lesnictví
ABSTRAKT: Studie předkládá parametrizaci alometrických vztahů použitelných pro dub (Quercus robur, Quer-
cus petraea) rostoucí v podmínkách středoevropského lesnictví. Je založena na destruktivním měření 51 vzorníků
rostoucích na šesti lokalitách významných pro dubové hospodářství v České republice. Měřené stromy zahrnovaly
rozpětí výčetní tloušťky (D) 6 až 59 cm, výšky (H) od 6 do 32 m a věku od 12 do 152 let. Byly parametrizovány vzta-
hy pro celkovou nadzemní biomasu a její jednotlivé složky. Dvě základní úrovně alometrických funkcí využívají D
jako jedinou nezávislou proměnnou, nebo v kombinaci s
H. Funkce třetí úrovně reprezentovaly nejúspěšnější funkci
a optimální kombinaci dostupných nezávislých proměnných, které zahrnovaly
D, H, délku koruny (CL), šířku koru-
ny (CW), poměr dimenzí koruny (CR = CL/H), věk vzorníků a nadmořskou výšku stanoviště. K predikci celkové
nadzemní biomasy byla zvlášť významná proměnná D. Zahrnutí H vždy zpřesnilo fit funkcí, a to především pro jed-
notlivé položky nadzemní biomasy. Příspěvek CW byl slabý, ale signifikantní pro všechny položky biomasy. CL byla
významná pro biomasu kmene a CR pro biomasu živých větví. Ostatní proměnné byly významné pouze pro jednu
z funkcí, konkrétně věk stromu pro predikci biomasy živých větví a nadmořská výška stanoviště pro kůru kmene.
Práce rovněž porovnává parametrizované funkce pro dub z této studie s funkcemi jiných publikovaných prací.
Klíčová slova: Quercus robur; Quercus petraea; složky biomasy; uhlík; les; mírné pásmo
Corresponding author:
Dr. Ing. E C, IFER – Ústav pro výzkum lesních ekosystémů, Areál 1. Jílovské a. s.,
254 01 Jílové u Prahy, Česká republika
tel.: + 420 241 950 607, fax: + 420 241 961 205, e-mail: