Báo cáo lâm nghiệp: "Quantity and distribution of fine root biomass in the intermediate stage of beech virgin forest Badínsky prales" potx
Bạn đang xem bản rút gọn của tài liệu. Xem và tải ngay bản đầy đủ của tài liệu tại đây (284.49 KB, 9 trang )
502 J. FOR. SCI., 55, 2009 (11): 502–510
JOURNAL OF FOREST SCIENCE, 55, 2009 (11): 502–510
Rapid changes in the stand structures caused by
abiotic factors belong to the natural components of
the ecosystem development in a virgin forest. e
comeback of the climax community to the given
site follows the stage of pioneer and intermediate
forest within the secondary succession. e stand
structure of the intermediate forest is characterized
particularly by the common occurrence of pioneer
and climax tree species during this stage. Together
with changes in the tree species composition in the
stand, successive accumulation of aboveground and
underground biomass takes place as well.
Production and relationships within the above-
ground part of the intermediate forest ecosystem in
the National Nature Reserve (NNR) Badínsky prales
(Badín virgin forest) were analyzed in detail thanks
to the long-term research of K (1958, 1989),
S (1998) and R and S (2006).
Root biomass production, its changes and competi-
tion between the tree species within the root space
of the intermediate forest have not been analyzed
yet. Due to the extensity and destructive character
of reliable rhizological methods, we cannot consider
the investigation of whole root systems in a virgin
forest as it represents an area with the highest
level of nature protection. erefore rhizological
research has to concentrate only on the analysis of
the fine root fraction that does not represent any
serious ecosystem disturbance.
e fine roots (roots up to 2 mm in diameter)
fulfil mainly nutritional, metabolic and symbiotic
functions. Considering that it is understandable that
the vast majority of fine root biomass is allocated
in the upper soil layers and horizons (H,
P 1996). According to Š (1988) the
depth of the main rhizosphere in forest stands of
the temperate zone reaches approximately 40 cm.
B and R (1994) confirm that more than
Quantity and distribution of fine root biomass
in the intermediate stage of beech virgin forest
Badínsky prales
P. J, L. B, S. K, J. V
Faculty of Forestry, Technical University in Zvolen, Zvolen, Slovakia
ABSTRACT: e fine root biomass represents 3,372 kg/ha in the intermediate stage of the beech virgin forest with
different admixture of goat willow, where the vast majority of this biomass is located in the uppermost mineral soil
layer 0–10 cm. e variability of the fine root biomass calculated from 35 sample points represents approximately
90% of the mean value and reaches the highest value within the humus layer. e total fine root length investigated
in 10 cm thick soil layers decreases with increasing soil depth. A significant linear relationship between the fine root
length (calculated per 1 cm thick soil layer and 1 m
2
of stand area) and the soil depth was confirmed, although the cor-
relation is rather weak. e number of root tips decreases with increasing soil depth faster than the root length. As the
number of tips per 1 cm of root length remains in the finest diameter class without significant changes, the reason is
above all a decreased proportion of the finest root class (diameter up to 0.5 mm) from the total fine root length within
the particular soil layer.
Keywords: fine roots; European beech; goat willow; Badín virgin forest; root tips
Supported by the Slovak Research and Development Agency, Project No. APVV-0082-06.
J. FOR. SCI., 55, 2009 (11): 502–510 503
50% of total root biomass is located right up to the
depth of 40 cm.
According to B et al. (2001), in floodplain
forests the depth of the root system is limited by
soil porosity. Almost all parameters that character-
ize the biomass and the production of fine roots are
declining with decreasing soil porosity. e authors
also reported that 74% of fine roots (up to 3 mm in
diameter) were located in the upper 15 cm of soil in
oak mixed forests.
e anthropogenic modification of the soil envi-
ronment, particularly sulphur and nitrogen depo-
sition that is connected with the influence on the
molar ratio of Al
3+
/Ca
2+
, causes considerable changes
in fine root allocation. According to M (1984)
and P (1994), the fine roots of Norway spruce
occur almost exclusively in A-horizon under these
conditions. M and P (2002) presented
similar results for young and also older individuals
of rowan (Sorbus aucuparia L.), while they proved a
considerable influence of the soil type.
However, the fine roots can reach a considerable
soil depth. K et al. (1968) reported the depth
of approximately 5 m for the vertical roots of oak
on the limestone soil, but they did not specify the
diameter of the roots.
e fine root biomass is an important component
of the stand total biomass. Its quantification is very
time-consuming and therefore the effort to find a re
-
lationship between the fine root biomass and some
of the stand characteristics that are easier to measure
(e.g. stand basal area) is understandable (K et al.
1996). However, C et al. (2004) found no corre-
lation between these two parameters (r
2
= 0.1) after
the analysis of extensive literary databases made by
V et al. (1996). Regarding the strict separation of
the functions of the different root diameter catego-
ries, it is not possible to derive the fine root biomass
from the total root biomass either.
Similarly, the efforts to derive the biomass or the
other fine root features from some abiotic and biotic
characteristics (e.g. soil grain, content of macroele-
ments in litterfall, temperature, precipitation etc.)
collide with the high variability of fine root biomass
and thereby a weak relationship between given vari-
ables (O et al. 2007).
European beech is considered to be an exception-
ally competitively strong tree species, which is par-
ticularly represented by its ability to eliminate most
of our main tree species from the stand canopy under
optimal conditions as well as by its adaptation to the
wide range of environmental conditions. E
(1996) stated that dominance in the crown canopy
was the primary factor for the existence of large
homogeneous beech forests in Central Europe. e
ability to occupy various sites is conditioned mainly
by the specific attributes of the fine root system ac-
cording to K et al. (1968) and H (1999).
H (1999) reported similar expansivity like that
observed for the crowns also during the development
of the fine root system. is conclusion was based
on the results from the study of root competition
between beech and sessile oak. e study confirms
that the beech occupies the areas with thicker humus
layer or soil space with increased nutrient supply
more intensively than oak.
T (1987) presented a hypothesis that strong
competition in the root space reduces competition in
the crown canopy. He assumed that the competitors
invested too much of the organic matter into root
competition, which was then missing during the
growth of the aboveground parts. at may be one
of the reasons why the root competition on the soils
with good nutrient supply is weaker than on the poor
sites. According to E (1996) the competi-
tive power of the beech root system, as the dominant
tree species on the vast areas, is likely the same on
the very different sites.
e goal of this study is to quantify the fine root
biomass in an intermediate forest, to describe its ba-
sic morphological features and to derive the relevant
relationships between them.
MATERIAL AND METHODS
e Badín virgin forest belongs to the oldest virgin
forest reserves in Slovakia. It was declared in 1913
according to the list of natural heritage with the
character of virgin forest. e forests of the enlarged
protection zone were managed by common methods
and therefore the requirement for their consecutive
modification (forest stand reconstruction) towards
an increase in the stability, i.e. towards the natural
tree species composition and structure, emerged
(R 2001).
From the total area of the reserve (30.7 ha), the
calamity area that is currently in the stage of inter-
mediate forest comprises 6.1 ha. e virgin forest
is situated in the south-eastern part of the Krem-
nické vrchy Mts. and belongs to the forest manage-
ment unit Badín (forest district Staré Hory, forest
enterprise Slovenská Ľupča). e average annual
temperature is 5.5–6.0°C and the average annual
precipitation amounts to 850–900 mm. e geologic
bedrock is built of tuffs, andesitic agglomerates and
compact andesite. Deep, eutric Cambisols are a
dominant soil type. e humus is represented by
the mull and favourable moder forms. e physi-
504 J. FOR. SCI., 55, 2009 (11): 502–510
ological soil depth is limited (40–45 cm) and the
root system of trees (beech and fir) does not occupy
heavy tuff layers, which can be a reason for uproot
-
ing the part of the virgin forest in 1947 according to
Š (1980).
e vast majority of the plant communities in
Badín virgin forest (60–70% of the area) belong to
the 4
th
forest vegetation zone, mesotrophic group
B and the forest typology unit Fagetum typicum
(K 2000).
At the end of May 1947 almost the whole inner part
of the NNR Badín virgin forest (6.1 ha), was uproot
-
ed and left to the natural succession (K 1995).
Before the windthrow 80% of the uprooted area had
a strongly homogeneous vertical structure that is
typical of the optimum stage. e stand consisted of
75% beech and 25% fir and the average growing stock
amounted to 800–850 m
3
/ha.
In 1957, i.e. 10 years after the windthrow, the
area was continuously covered by a thicket that
consisted of 89% goat willow, 6% beech, 3% fir and
2% other pioneer tree species (birch, aspen, black
elder). K (1989) considered the natural suc-
cession on the windthrow area quite fast. In spring
1957 the mean density of goat willow in the pioneer
forest reached 6,300 individuals per 1 hectare, with
the average height of 2–3 m.
In 1967 the stand already had the character of the
intermediate forest with the irregular mixture of
climax tree species (beech, fir, maple) in understorey.
K (1995) reported the goat willow proportion
decreased down to 77% and its stems were almost
absolutely concentrated in the overstorey. e pro-
portion of beech increased to 18%, while the other
pioneer tree species made up less than 1%. During
the measurements in 1987 an average density of
natural regeneration of 301 individuals per hectare
was recorded. e natural regeneration consisted of
beech (36.5%), fir (28.6%), maple (22.3%), goat wil-
low (8.5%) and other tree species (4.1%) and thus the
continuous presence of the seedlings of all main tree
species was ensured K 1995.
S (1998) recorded a significant mortality
of goat willow stems, which was expressed by a de-
crease in its growing stock and an increase in its dead
wood ratio. In 1996 goat willow made up 28.9% of the
total stem number and the proportion of beech was
68.2%. According to R and S (2006)
the proportion of goat willow decreased to 26.3%
and that of beech increased to 70.2% in 2005, which
confirmed a successive decline of goat willow from
the stand. Presently the stand is in the final phase
of the intermediate forest stage. An important role
for the relatively fast emergence of the intermediate
stage forest was played by the presence of the natural
regeneration of climax tree species already under the
canopy of the mature stand as reported from other
virgin or managed forests (S, K 2004;
K, S 2004; B 2008).
In the windthrow area we established 5 circular
sample plots 22.6 m in diameter and 400 m
2
in size.
On these plots all living trees according to the tree
species were registered. We measured dbh (cm) for
each stem and subsequently the stand basal area was
calculated. e basic characteristics of the sample
plots are presented in Table 1 (
J et al. 2008).
e results confirm the high spatial heterogeneity
of stem density that is caused mainly by beech. e
higher beech proportion also leads to an increase in
the total stand basal area, whereby the increase in
its basal area is overproportionally higher than the
decrease in the goat willow basal area, i.e. the beech
increases its basal area not only as a result of the re
-
placement of goat willow from the growing space.
e samples of fine roots were taken from 7 points
that were set up in the centre of each sample plot.
For the sampling we used a regular hexagon scheme
with the side length of 1.5 m. e sample points
Table 1. e basic dendrometric characteristics of sample plots
Plot
Number of trees per 1 ha Basal area
Basal
area
total
(m
2
/ha)
Mean dbh
beech goat willow beech goat willow beech
goat
willow
n (%) n (%) (m
2
/ha) (%) (m
2
) (%) (cm) (cm)
Plot 1 775 68.9 350 31.1 10.2 29.4 24.7 70.6 34.9 11.1 27.1
Plot 2 775 66.0 400 34.0 11.8 31.6 25.4 68.4 37.2 11.4 27.3
Plot 3 1,050 76.4 325 23.6 27.4 63.2 15.9 36.6 43.3 15.3 23.5
Plot 4 475 65.5 250 34.5 14.1 40.5 20.7 59.5 34.8 15.5 31.5
Plot 5 1,550 78.5 425 21.5 18.6 41.6 26.1 58.4 44.7 10.3 26.3
J. FOR. SCI., 55, 2009 (11): 502–510 505
were located at the vertices of the hexagon and at
its centre, which was identical with the centre of the
sample plot.
For the determination of the fine root quantita-
tive morphological characteristics we used a direct
destructive method. e root samples were taken
with a hollow drill of the inner diameter 80 mm and
the length of the hollow part 200 mm in two steps,
0–20 cm and 20–40 cm. e depth of the samples
depended on the skeleton fraction and ranged from
minimum 20 to maximum 40 cm. e cylindrical
soil cores with the parameters 80 × 200 mm were
divided into the sections that corresponded to the
layers 0–5 cm, 5–10 cm, 10–20 cm, 20–30 cm and
30–40 cm. e humus horizon was analyzed as a
whole and separately.
In the laboratory the fine roots were separated
from the soil cores and the humus layer, respectively,
and categorized as vital or dead. e dead roots
were not the subject of subsequent analysis and all
presented results relate to vital fine roots. Despite
the harvesting of comparative root samples for both
species (beech, goat willow) many morphologically
similar roots were observed during the analysis and
it was not possible to exactly distinguish between
the tree species merely according to the macroscopic
features. erefore we have to give up the analysis
regarding the quantification of the fine root biomass
according to the particular tree species. e image
of vital fine roots was digitized using a high-resolu-
tion scanner (1,200 dpi) and subsequently the roots
were dried for 72 hours at the temperature of 60°C
and weighed to the nearest 0.1 mg.
The values of root length and number of root
tips were determined using the software Win-
Rhizo 2004a
™
. e biomass of vital fine roots was
calculated by the program Fewubiom working under
MS Excel. e output of the program is the fine root
weight calculated per 1 ha, weights per hectare for
each sample point and also the data on the fine root
concentration in 100 ml of fine-grained soil (includ
-
ing the basic measures of variability).
RESULTS AND DISCUSSION
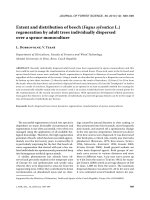
e values of total biomass of vital fine roots show
a high variability in the investigated soil profile. e
average value of the fine root biomass calculated as
an arithmetic mean of all plots reaches 3,229 kg/ha.
As expected, the majority of fine roots is concen-
trated in the layer from 0 to 10 cm (1,348.1 kg/ha),
which represents 41.7% of all vital roots with the
diameter less than 2 mm. e absolute values of fine
root biomass (up) and their proportion from the total
biomass in the investigated profile (down) according
to separate soil layers are shown in Fig. 1. e high
variability of individual values around the mean on
each of the 35 sample plots is evident from the lines
that represent standard deviations. e variability
within the particular plots is lower; nevertheless, it
remains on a high level with the coefficient of varia-
tion 89.9% (35.5–264.5%). e highest variability of
Fine root biomass per 1 ha
1348,1
970,3
450,9
401,4
58,3
0 500 1000 1500 2000 2500 3000
1
2
3
4
5
depth
weight [kg.ha-1]
humus layer
0-10 cm
10-20 cm
20-30 cm
30-40 cm
Fine root biomass ratio per 1 ha in soil layers
41,7
30,1
14,0
12,4
1,8
0,0 10,0 20,0 30,0 40,0 50,0 60,0 70,0
1
2
3
4
5
depth
ratio [%]
humusl layer
0-10 cm
10-20 cm
20-30 cm
30-40 cm
Fine root biomass ratio per 1 ha in soil layers (%)
Fine root biomass per 1 ha (kg/ha)
0 500 1,000 1,500 2,000 2,500 3,000
0 10 20 30 40 50 60 70
Humus layer
0–10
10–20
20–30
30–40
Depth (cm)
Humus layer
0–10
10–20
20–30
30–40
Depth (cm)
1,348.1
Fig. 1. Means and standard deviations of
fine root dry matter weight in kg per 1 ha
(up) and the proportions of root weights
in particular soil layers (down) from fine
root biomass in the whole soil profile (up
to 40 cm depth)
41.7
506 J. FOR. SCI., 55, 2009 (11): 502–510
the fine root biomass was found in the humus layer.
C et al. (1997) presented the values of root bio-
mass and its allocation in different world regions. For
the temperate zone they reported the values of total
root biomass from 35 to 99 tonnes per 1 hectare,
whereas the proportion of roots 5 mm in diameter
accounted for 1–23%. According to K and
B (2002) the ratio of the roots with diameter up
to 5 mm represents 7–10% of the total root biomass
of selected beech samples. H (1999) presented
the average fine root biomass around 100–600 g
of dry matter per 1 m
2
(i.e. 1,000–6,000 kg/ha) for
forest stands of the temperate zone. e fine root
dry matter reaches 270 g per 1 m
2
in broadleaved
stands and 300 g per 1 m
2
in coniferous stands. If we
assume that the results refer to entire rhizosphere
and to similar stratification of the biomass like in
our research, then the total fine root biomass for
the whole 40 cm profile (3,229 kg/ha, i.e. 322.9 g/m
2
)
determined in our study is by 20% higher. Neverthe
-
less, it still remains close to the mean value of the
above-mentioned range.
e total length of fine roots was analyzed accord-
ing to individual sample plots and soil layers. All
values of the length were calculated per 1 cm thick
soil or humus layer respectively, and per 1 m
2
area.
e highest variability of the fine root length was
recorded in the humus layer. e fine root length
distribution also corresponds to the average fine
root biomass distribution (Fig. 1, Table 2). On each
Table 2. Fine root length in meters and weight of fine root dry matter in grams calculated per 1 m
2
area and 1 cm thick
soil layer
Layer
Plot 1 Plot 2 Plot 3 Plot 4 Plot 5 Average
mean SD mean SD mean SD mean SD mean SD mean SD
Length in m per 1 m
2
and 1 cm thick soil layer
Humus 282.1 509.4 160.9 169.5 38.7 33.0 140.8 156.7 115.6 43.5 156.1 254.0
0–5 cm 204.3 136.6 228.3 153.2 461.9 283.7 697.7 700.9 165.0 83.2 361.6 397.8
5–10 cm 202.1 153.3 313.9 118.9 377.8 159.2 692.8 658.7 258.5 105.3 373.9 349.6
10–20 cm 195.3 82.3 129.3 85.7 205.1 113.8 174.6 153.1 173.8 128.9 175.6 112.0
20–30 cm 70.6 46.9 51.3 31.7 56.1 26.3 21.9 9.4 51.1 33.7 50.3 33.6
30–40 cm 98.8 73.4 28.9 25.6 80.6 24.9 16.4 18.6 61.5 43.5 58.8 51.3
Weight in g per 1 m
2
and 1 cm thick layer
Humus 10.08 9.36 9.30 1.78 – – 9.34 7.52 5.09 2.24 8.01 6.08
0–5 cm 12.94 12.40 16.30 21.52 26.50 11.56 23.70 28.96 8.18 2.91 17.73 17.53
5–10 cm 7.92 5.52 19.37 15.73 23.96 9.95 34.84 15.05 19.71 8.12 20.14 13.21
10–20 cm 7.15 3.95 5.60 4.36 16.13 7.37 12.92 6.13 9.93 5.66 10.11 6.55
20–30 cm 4.85 5.05 3.31 3.63 4.75 3.26 3.23 1.82 5.16 4.67 4.43 3.75
30–40 cm 3.45 2.94 1.06 0.60 9.71 8.65 1.24 1.72 8.37 5.04 5.05 5.62
Table 3. Parameters of linear and exponential regression between total fine root length and soil depth
Plot
y = a + bx y = a + e
b+cx
a b r
2
a b c r
2
Plot 1 233.3 –4.55 0.241 –109.2 5.87 –0.018 0.244
Plot 2 290.1 –8.69 0.532 –6.1 5.99 0.073 0.587
Plot 3 437.4 –12.80 0.531 20.3 6.44 –0.088 0.610
Plot 4 677.6 –22.90 0.350 –7.0 7.24 –0.138 0.447
Plot 5 237.9 –5.74 0.375 –144.8 5.99 –0.021 0.380
J. FOR. SCI., 55, 2009 (11): 502–510 507
plot the highest values of the fine root length were
recorded in the first mineral soil layer (0–10 cm).
e maximum lengths were found in the soil layer
0–5 cm on sample plots 1, 3 and 4, and in the soil
layer 5–10 cm on sample plots 2 and 5. e value of
the total root length decreased with the increasing
soil depth. ere is a weak but significant relation
-
ship between the fine root length and the soil depth
and it has almost a linear character in the mineral
soil. e comparison of the amounts of explained
variance (r
2
) and the parameters of the linear and
nonlinear (exponential) regression shows that the
replacement of linear equation with exponential
function will not significantly increase the accuracy
of the estimate for the given weak relationship. e
r
2
-values (Table 3) confirm the explained variance
increased at most on sample plot 4, anyway this
increase was less than 10%.
e distribution of total fine root length accord-
ing to diameter classes was evaluated only for the
layers 0–5 cm, 5–10 cm and 30–40 cm. According
to previous results, the highest proportions of fine
root biomass from the whole investigated profile
are located in the first two soil layers. e soil layer
30–40 cm is the deepest investigated one. e dif
-
ferences in the absolute values of the length between
the sample plots are the largest in the first diameter
class (Table 4). e proportions of this diameter class
are decreasing slightly with the soil depth, whereas
the proportion of the subsequent diameter classes is
increasing. From the diameter of 1.5 mm a signifi
-
cant decrease in the proportion of the total length
can be observed again.
e total fine root length recorded by H
and B (1995) in beech stands reached
184.10
6
m/ha and for Douglas fir they reported the
value of 67.10
6
m/ha. In the mixed stand of both tree
species even higher total values were recorded. e
authors consider this as a sign for the competition
between beech and Douglas fir, whereas the tree
species occupy different soil layers.
e number of root tips is an important indicator
of the fine root physiological activity. e root tip
is followed by a zone of root hairs, i.e. of prolonged
Table 4. Total fine root length distribution according to diameter classes in meters calculated per 1 m
2
area and 1 cm
thick soil layer
Plot
Diameter class (mm)
0.01–0.50 0.51–1.00 1.01–1.50 1.51–2.00 2.01–2.50
(m) (%) (m) (%) (m) (%) (m) (%) (m) (%)
Soil layer 0–5 cm
Plot 1 186.8 91.5 15.0 7.3 1.0 0.5 1.30 0.6 0.04 0.03
Plot 2 215.0 94.2 11.6 5.1 0.7 0.3 0.20 0.1 0.67 0.03
Plot 3 413.9 89.7 35.4 7.7 9.4 2.0 2.70 0.6 0.16 0.03
Plot 4 675.5 96.9 14.6 2.1 3.6 0.5 3.00 0.4 0.42 0.06
Plot 5 148.3 89.9 14.7 8.9 1.5 0.9 0.30 0.2 0.01 0.01
Soil layer 5–10 cm
Plot 1 182.7 90.5 15.7 7.8 3.1 1.5 0.30 0.1 0.07 0.03
Plot 2 288.9 92.1 18.9 6.0 5.2 1.6 0.70 0.2 0.01 0.01
Plot 3 332.2 88.1 34.1 9.1 5.9 1.5 3.30 0.9 1.57 0.40
Plot 4 631.7 91.3 40.1 5.8 14.2 2.1 4.10 0.6 1.73 0.25
Plot 5 226.9 87.9 21.5 8.3 6.2 2.4 2.70 1.0 0.85 0.30
Soil layer 30–40 cm
Plot 1 89.1 90.2 7.3 7.4 1.8 1.8 0.52 0.5 0.00 0.00
Plot 2 22.8 78.9 5.7 19.7 0.4 1.4 0.00 0.0 0.00 0.00
Plot 3 65.5 81.3 11.6 14.4 2.6 3.2 0.84 1.0 0.00 0.00
Plot 4 13.5 81.8 2.6 15.7 0.4 2.4 0.01 0.1 0.00 0.00
Plot 5 48.9 80.4 8.9 14.6 1.8 2.9 0.16 0.3 1.00 1.70
508 J. FOR. SCI., 55, 2009 (11): 502–510
epidermal cells with the dominant function of water
and minerals supply. e ratio between the fine root
length and the number of root tips is an indicator of
the intensity of the fine root forking.
A direct comparison of root tip number between
the soil layers and sample plots is possible, but the
number by itself depends on the other quantita-
tive characteristics of fine roots, particularly on
their length. With the increasing value of the fine
root length the number of root tips increases as
well. Therefore the highest frequency of root tips
was recorded in the uppermost mineral soil layer,
as expected. The proportion of the first two fine
root diameter classes in the root length decreases
slightly with the soil depth (Table 4). These fi-
nest roots bear a dominant amount of root tips
and therefore the decrease in the root tip number
with increasing soil depth is faster than in the
case of root length. H (1999) recorded a fast
decrease in the root tip number with soil depth,
whereas according to his results the decrease in
the root tip number is faster than the decrease in
the fine root biomass. His finding supports an as-
sumption that the production and lifetime period
of fine roots are affected by the availability of
nutrients, especially of nitrogen. As soil nitrogen
is almost exclusively the product of the organic
matter decomposition, the fast decrease in the
root tips with soil depth is an expected natural
phenomenon. Despite this fast decrease a more or
less linear relationship between the soil depth and
the root tip number is maintained. The application
of exponential function does not increase the accu-
racy of the estimation. Therefore the relationship
between the root tip number (calculated per 1 cm
thick soil layer and 1 m
2
area) and the soil depth
was fitted by a regression line with the parameters
reported in Table 5.
A more suitable comparative variable is the spe-
cific density of root tips, i.e. the number of root
tips per 1 cm of root length. e occurrence of root
tips is concentrated in the finest diameter class of
fine roots. On the roots over 0.5 mm in diameter
the root tips are very scarce and limited only to the
endings originated on the dead parts of fine roots.
e analysis confirmed that there is no correlation,
or only a very weak one, between the specific den
-
sity of root tips in the finest diameter class of fine
roots and the soil depth. e decrease in the root
tip number is caused rather by the increasing root
Table 5. Parameters of linear regression between the number of fine root tips and the soil depth
Plot a b r r
2
p (for a) p (for b)
Plot 1 85,573 –1,544.9 0.406 0.165 0.001 0.002
Plot 2 126,695 –3,636.3 0.611 0.374 0.001 0.001
Plot 3 185,155 –5,776.3 0.651 0.424 0.001 0.001
Plot 4 331,888 –11,357.3 0.531 0.282 0.001 0.001
Plot 5 126,176 –3,013.3 0.473 0.223 0.001 0.001
Table 6. Mean and variability of the root tip number per 1 cm of root length in the first three diameter classes
Soil layer
Diameter class
0.0–0.25 mm 0.26–0.50 mm 0.51–0.75 mm
mean* SD mean* SD mean* SD
Humus 5.74 1.67 1.41 0.68 1.23 2.71
0–5 cm 5.86 0.92 1.49 0.49 0.69 0.41
5–10 cm 5.99 1.08 1.51 0.40 0.73 0.41
10–20 cm 5.84 1.04 1.42 0.68 0.69 0.75
20–30 cm 6.23 1.15 1.58 0.74 0.84 0.97
30–40 cm 6.37 1.33 1.30 0.41 0.45 0.28
*Tips per cm
J. FOR. SCI., 55, 2009 (11): 502–510 509
diameter and by the proportion of the given diameter
class in the total length (or weight) than by the soil
depth (Table 6).
F (1999) considered the number
of root tips per 1 cm as one of the basic indicators
of the soil environment changes. According to our
results the trees respond to the low nutrient supply
in the lower soil horizons rather by the reduction of
the finest root length than by the reduction of root
tips density.
CONCLUSIONS
The research of fine roots in the intermediate
stage of a beech virgin forest confirmed that the
major portion of root biomass was concentrated in
the uppermost mineral soil layer. e humus layer,
which usually shows the highest root density in
coniferous virgin forests, plays no significant role in
the conditions of the 4
th
forest vegetation altitudinal
zone. e values of the total fine root biomass in the
intermediate forest correspond to the data presented
by other authors.
e distribution of the total fine root length in the
soil profile corresponds to the distribution of their
biomass. e proportion of the finest roots (diameter
class 0–0.5 mm) decreases slightly with the increas
-
ing soil depth.
e number of root tips is the highest in the up-
permost mineral soil layer. Anyway, the decline of the
root tip number is faster than the root length decline.
We found no relationship between the number of
root tips in the finest diameter class and the soil
depth. erefore it can be assumed that the reason
for the fast decrease in the root tip number is the
higher proportion of roots from the larger diameter
classes together with the decline of the root length
in the finest diameter class.
R e f e r e n c e s
BAKER T.T., CONNER W.H., BLOCKABY B.G., STANTURF
J.A., BURKE M.K., 2001.
Fine root productivity and dynam-
ics on a forested floodplain in South Carolina. Soil Science
Society of America Journal, 65: 545–556.
BARNA M.,
2008. e effect of cutting regimes on natural re-
generation in submountain beech forests: species diversity
and abundance. Journal of Forest Science, 54: 533–544.
BURKE M.K., RAYNAL
D.J., 1994. Fine root growth phenol-
ogy, production and turnover in a northern hardwood forest
ecosystems. Plant and Soil, 162: 135–146.
CAIRNS M.A., BROWN S., HELMER E.H., BAUMGARD
NER G.A.,
1997. Root biomass allocation in the world’s
upland forests. Oecologia, 111: 1–11.
CHEN W., ZHANG Q., CIHLAR J., BAUHUS J., PRICE D.T.,
2004. Estimating fine-root biomass and production of boreal
and cool temperate forests using aboveground measure-
ments: A new approach. Plant and Soil, 265: 31–46.
ELLENBERG
H., 1996. Vegetation Mitteleuropas mit den
Alpen. Stuttgart, Ulmer: 1095.
FRITZ H.W.,
1999. Feinwurzelverteilung, -Vitalität, -Produk-
tion und -Umsatz von Fichten (
Picea abies [L.], Karst.) auf
unterschiedlich versauerten Standorten. Berichte des For-
schungszentrums Waldökosysteme. Reihe A, 165: 1–138.
HENDRICK L.R., PRETZIGER K.S.,
1996. Temporal and
depth-related patterns of fine root dynamics in northern
hardwood forests. Journal of Ecology, 84: 167–176.
HENDRICKS C.M.A., BIANCHI F.J.J.A., 1995.
Root den-
sity and root biomass in pure and mixed forest stands of
Douglas-fir and Beech. Netherlands Journal of Agricultural
Science, 43: 321–331.
HERTEL
D., 1999. Das Feinwurzelsystem von Rein- und
Mischbeständen der Rotbuche: Struktur, Dynamik und
interspezifische Konkurenz. Dissertationes Botanicae, Bd.
317: 187.
JALOVIAR P., KUCBEL S., VENCURIK J., BAKOŠOVÁ L.,
2008. Kvantita a distribúcia jemných koreňov v prechod
-
nom lese NPR Badínsky prales. Acta Facultatis Forestalis
Zvolen, 50: 23–31.
KODRÍK M., BARNA M., 2002. Tree biomass of a beech
stand treated by regeneration cutting. Ekológia (Bratislava),
21: 117–123.
KLIMAŠ V., SMOLEK
M., 2004. Regeneračné procesy
a využitie disponibilného priestoru bukového spoločenstva
v NPR Vtáčnik. In: Hlavní úkoly pěstování lesů na počátku
21. století. Brno, MZLU, LDF, ÚPZL: 235–242.
KORPEĽ
Š., 1958. Príspevok k štúdiu pralesov na Sloven-
sku na príklade Badínskeho pralesa. Lesnícky časopis, 4:
349–385.
KORPEĽ
Š., 1989. Pralesy Slovenska. Bratislava, Veda: 329.
KORPEĽ Š., 1995. Sekundárna sukcesia v prírodnom lese na
príklade NPR Badínsky prales. In: Seminár Sekundárna
sukcesia. Zvolen, TU: 23–32.
KÖSTLER J.N., BRÜCKNER E., BIBELRIETHER H., 1968.
Die Wurzeln der Waldbäume. Berlin, Hamburg, Paul Parey
Verlag: 282.
KRIŽOVÁ
E., 2000. Lesné spoločenstvá NPR Badínsky prales.
Chránené územia Slovenska, 46: 36–37.
KURZ W.A., BEUKEMA S.J.,
APPS M.J., 1996. Estimation of
root biomass and dynamics for the carbon budget model
of the Canadian forest sector. Canadian Journal of Forest
Research, 26: 1973–1979.
MAUER O., PALÁTOVÁ
E., 2002. Mountain ash (Sorbus
aucuparia L.) root system morphogenesis. Journal of Forest
Science, 48: 342–350.
MURACH
D., 1984. Die Reaktion der Feinwurzeln von Fichte
(Picea abies Karst. L.) auf zunehmende Bodenversauerung.
Göttinger Bodenkundliche Berichte, 77: 1–126.
510 J. FOR. SCI., 55, 2009 (11): 502–510
OSTONEN I., PÜTTSEPP Ü., BIEL C., ALBERTON O.,
LŐHMUS K., MAJDI H., METCALFE D., OLSTHOORN
A.F.M., PRONK A., VANGUELOVA E., WEIH M., BRUN
NER I., 2007.
Specific root length as an indicator of environ-
mental change. Plant Biosystems, 141: 426–442.
PUHE
J., 1994. Die Wurzelentwicklung der Fichte (Picea
abies Karst. L.) bei unterschiedlichen bodenchemischen
Bedingungen. Berichte des Forschungszentrums Waldöko-
systeme, Reihe A, Bd. 108: 163.
RICHTER F., SANIGA M
., 2006. Štruktúra prechodného lesa
v jeho záverečnej fáze v Badínskom pralese In: JURÁSEK
A., SLODIČÁK M., NOVÁK J. (eds), Stabilization of
Forest
Functions in Biotopes Disturbed by Anthropogenic Acti-
vity, Opočno 5.–6. 9.: 239–247.
RYBÁR I.,
2001. Projekt NPR Badínsky prales (Rezervač-
ná kniha): 30.
SANIGA
M., 1998. Stav, štruktúra a regeneračné procesy
prírodného lesa v závere ontogenezického vývoja. In.: Se-
kundárna sukcesia II. Zvolen, TU: 163–172.
SANIGA M., KLIMAŠ
V., 2004. Štruktúra, produkčné pro-
cesy a regenerácia prelesa Stužica v 4. lesnom vegetačnom
stupni. Acta Facultatis Forestalis, 46: 93–104.
ŠÁLY R.,
1980. Výskum pôdneho prostredia vybraných
štátnych prírodných rezervácií na Slovensku. [Záverečná
správa výskumnej úlohy č. VI-3-6/1a.] Zvolen, VŠLD:
118.
ŠÁLY
R., 1988. Pedológia a mikrobiológia. Zvolen, VŠLD:
39–103.
TILMAN
D., 1987. On the meaning of competition and the
mechanisms of competitive superiority. Functional Ecol-
ogy, 1: 304–315.
VOGT K.A., VOGT D.J., PALMIOTTO P.A., BOON P.,
O’HARA J., ASBJORNSEN H., 19
96. Review of root dy-
namics grouped by climate, climatic forest type and species.
Plant and Soil, 187: 159–219.
Received for publication March 12, 2009
Accepted after corrections July 6, 2009
Corresponding author:
Ing. P J, Technická univerzita vo Zvolene, Lesnícka fakulta, Katedra pestovania lesa, T. G. Masaryka 24,
960 53 Zvolen, Slovensko
tel.: + 421 455 206 239, fax: + 421 455 332 654,
e-mail:
Kvantitatívne charakteristiky a distribúcia biomasy jemných koreňov
v prechodnom lese v NPR Badínsky prales
ABSTRAKT: Biomasa jemných koreňov v prechodnej etape prírodného bukového lesa s rôznou prímesou rakyty
predstavuje 3 372 kg/ha, pričom najväčší podiel tejto biomasy je sústredený v najvyššie položenej vrstve minerál
-
nej pôdy 0–10 cm. Variabilita biomasy jemných koreňov vypočítaná z 35 odberných miest predstavuje približne
90 % priemernej hodnoty a najväčšia je v prostredí nadložného humusu. Celková dĺžka jemných koreňov v skúma
-
ných 10 cm hrubých vrstvách pôdy klesá smerom do hĺbky pôdy. Závislosť dĺžky jemných koreňov (prepočítaná na
1 cm hrubú vrstvu a 1 m
2
porastovej plochy) a hĺbky v pôde má lineárny charakter, ale len nízku tesnosť korelácie.
Početnosť koreňových špičiek klesá v smere do hĺbky v pôde rýchlejšie ako dĺžka koreňov. Dôvodom je predovšetkým
klesajúci podiel najtenšej triedy jemných koreňov s hrúbkou do 0,5 mm na celkovej dĺžke jemných koreňov v danej
vrstve, keďže početnosť špičiek pripadajúca na 1 cm dĺžky koreňov zostáva v tejto hrúbkovej triede bez významných
rozdielov v rôznych hrúbkových triedach.
Kľúčové slová: jemné korene; buk lesný; vŕba rakyta; Badínsky prales; koreňové špičky