kĩ năng viết trong các bài test 7 pps
Bạn đang xem bản rút gọn của tài liệu. Xem và tải ngay bản đầy đủ của tài liệu tại đây (194.1 KB, 6 trang )
Exercise 16: Photographs, page 167
c. This is the only choice supported by the caption and
photo. The photo contradicts choice a—clearly, laws did
not protect children from working as late as midnight.
The photo does not support choice b—the image does
not express a positive opinion about child labor. Choice
d is true—the progressives did seek to heighten aware-
ness about working children—but the photo does not
supply evidence of their involvement. Choice e repre-
sents an opinion.
– TIPS AND STRATEGIES FOR THE GED SOCIAL STUDIES EXAM–
170
Directions
Read each question carefully. The questions are multiple choice and may be based on a passage, table, or illus-
tration. Select the best answer for each question. Record your answers on the answer sheet provided on the next
page.
Note: On the GED, you are not permitted to write in the test booklet. Make any notes on a separate piece of
paper.
CHAPTER
GED Social
Studies Practice
Questions
NOW IT’S time to put all that you have learned about social stud-
ies facts and methods into practice. In the following section, you will
find 65 multiple-choice questions like those you will see on the GED
Social Studies Exam.
19
171
– GED SOCIAL STUDIES PRACTICE QUESTIONS–
172
Answer Sheet
1. abcde
2. abcde
3. abcde
4. abcde
5. abcde
6. abcde
7. abcde
8. abcde
9. abcde
10. abcde
11. abcde
12. abcde
13. abcde
14. abcde
15. abcde
16. abcde
17. abcde
18. abcde
19. abcde
20. abcde
21. abcde
22. abcde
23. abcde
24. abcde
25. abcde
26. abcde
27. abcde
28. abcde
29. abcde
30. abcde
31. abcde
32. abcde
33. abcde
34. abcde
35. abcde
36. abcde
37. abcde
38. abcde
39. abcde
40. abcde
41. abcde
42. abcde
43. abcde
44. abcde
45. abcde
46. abcde
47. abcde
48. abcde
49. abcde
50. abcde
51. abcde
52. abcde
53. abcde
54. abcde
55. abcde
56. abcde
57. abcde
58. abcde
59. abcde
60. abcde
61. abcde
62. abcde
63. abcde
64. abcde
65. abcde
Geography
Question 1 refers to the map below.
1. According to the information given in the map, which of the following conclusions can be drawn?
a. The British colonies were the main destination of African slaves.
b. South America did not allow the importation of slaves.
c. Most slaves were sent to work on sugar plantations in Brazil and in the Caribbean.
d. South America has a large population of African origin today.
e. The main slave trading region in Africa stretched 550 miles long.
– GED SOCIAL STUDIES PRACTICE QUESTIONS–
173
EUROPE
AFRICA
Atlantic
Ocean
SOUTH
AMERICA
NORTH
AMERICA
550
British North America—4%
Caribbean—36%
Spanish Empire—22% Europe—3%
Brazil—35%
km
mi
Source: Data derived from Hugh Thomas, The Slave Trade. Simon and Schuster, 1997.
Questions 2 through 5 are based on the map below.
2. According to the map, what time is it in Dallas
when it is noon in Sacramento?
a. 2:00
P.M.
b. 3:00
P.M.
c. 2:00
A.
M.
d. 1:00
A.
M.
e. 11:00
P.
M.
3. What time is it in Sacramento, CA, when it is
midnight in Tampa, FL?
a. 1:00
A.
M.
b. 12:00
P
.M
.
c. 9:00
A.M.
d. 9:00
P.M.
e. 10:00
P.M.
4. As a traveler moves west, she can expect to
a. change time zones.
b. move into an earlier time zone for every 15
degrees of latitude she travels.
c. experience jet lag.
d. move into an earlier time zone for every 15
degrees of longitude she travels.
e. move into a later time zone for every 15
degrees of latitude she travels.
5. In past presidential elections, television networks
have made predictions about which candidate is
likely to win before the polls closed throughout
all of the nation’s time zones. Which of the fol-
lowing statements explains why this would anger
some voters?
a. The polls close later in New York than in
Chicago.
b. Voters in the Central time zone want to know
who won in the eastern states.
c. Polls in the Pacific time zone open earlier if
voters want their votes to be counted.
d. Polls close one hour later in the Mountain
time zone than in the Central time zone.
e. Predictions based on voting in eastern time
zones influence those who have not yet voted
in the more western time zones.
– GED SOCIAL STUDIES PRACTICE QUESTIONS–
174
Seattle
Sacramento
Los
Angeles
Pacific
2
P.M.
Mountain
3 P.M.
Denver
Helena
Chicago
Minneapolis
Detroit
Washington, D.C.
New York
Tampa
Dallas
Albuquerque
Central
4
P.M.
Eastern
5
P.M.
Time Zones across the Continental United States
The Earth is divided into 24 time zones. The Earth rotates 15 degrees in one hour, so each time zone equals 15 degrees of
latitude. The map illustrates the four time zones across the continental United States.
Questions 6 through 8 refer to the following graphs.
Rate of population growth = birth rate – death rate
Source: U.S. Census Bureau, International Data Base 10-2002.
Source: U.S. Census Bureau, International Data Base 10-2002.
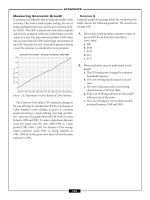
6. The greatest increase in population growth rate
between 1950 and 2000 occurred in
a. 1956–1957.
b. 1962–1963.
c. 1990–2000.
d. 2000–2001.
e. 2001–2002.
7. The world population growth rate dropped one
percentage point between the mid-1950s and
1960. Which of the following best explains this
occurrence?
a. There were more births and fewer deaths in
the mid-1950s than there were in 1960.
b. A baby boom in the decade after World War II
caused a spike in the birth rate.
c. The introduction of the birth control pill in
1960 in the United States helped slow the
birth rate.
d. There were more births in 1960 than there
were in the mid-1950s.
e. There were more deaths in 1960 than there
were in the mid-1950s.
8. Which of the following statements is proved by
the information in the two graphs?
a. The population will reach its limit by 2050.
b. When the rate of population growth
decreases, so does the population.
c. When the rate of population growth increases,
so does the population.
d. The rate of population growth will reach an
all-time low in 2050.
e. Even though the rate of population growth is
decreasing, the population is increasing.
World Population: 1950–2050
Population (billions)
1950 1960 1970 1980 1990 2000 2010 2020 2030 2040 2050
Year
10
9
8
7
6
5
4
3
2
1
World Population Growth Rate: 1950–2050
2.5
2.0
1.5
1.0
0.5
0.0
1950 1960 1970 1980 1990 2000
Year
Growth rate (percent)
2010 2020 2030 2040 2050
– GED SOCIAL STUDIES PRACTICE QUESTIONS–
175