Compressor Instability with Integral Methods Episode 2 Part 4 docx
Bạn đang xem bản rút gọn của tài liệu. Xem và tải ngay bản đầy đủ của tài liệu tại đây (7.42 MB, 116 trang )
Chapter 8
Surface Quality Aspects
8.1 Surface Quality Features
Quality features of substrate surfaces determine the performance and properties of
applied coating systems. Related to the performance of corrosion protective coat-
ing systems, ISO series 8502 states the following: “The performance of protective
coatings of paint and related products applied to steel is significantly affected by
the state of the steel surface immediately prior to painting. The principal factors to
influence this performance are:
(1) the presence of rust and mill scale;
(2) the presence of surface contaminants, including salts, dust, oil and greases;
(3) the surface profile.”
Numerous regulative standards are issued to define these factors, and testing
methods are available to quantify them. Blast cleaned surfaces show some distinct
features, and extensive experimental studies were performed to address this special
point, often in direct comparison to other surface preparation methods.
Figure 8.1 shows a scanning electron microscope image of a steel substrate after
blast cleaning. A general distinction can be made between primary and secondary
substrate surface features. Primary surface features may include those properties
which are part of coating specifications. They include the following features:
r
visual cleanliness;
r
chemical cleanliness;
r
physical cleanliness;
r
profile properties;
r
surface integrity.
Secondary surface features may include properties which are determined by, and
depend on, primary features. They may include the following features:
r
surface energy;
r
wettability;
r
adhesion of coating to substrate.
A. Momber, Blast Cleaning Technology 337
C
Springer 2008
338 8 Surface Quality Aspects
Fig. 8.1 Morphology of a blast cleaned low-carbon steel substrate. Parameters: p = 0.475 MPa;
d
N
= 8 mm; ϕ = 90 ; abrasive: aluminium oxide; ˙m
p
= 19 g/s; d
P
= 165 μm (Photograph: author)
8.2 Visual Cleanliness
8.2.1 Visual Standards
A number of regulatory standards have been developed in order to define and to
characterise steel surfaces prepared by blast cleaning. These standards are more or
less based on the standard preparation grades given in ISO 8501-1 (uncoated parts
of the surface) and ISO 8501-2 (partial surface preparation). Visual blast cleaning
standards cover the following two issues:
r
initial condition (rusty steel or shop primer);
r
visual surface preparation definition (visible contaminants and cleaning degrees).
Table 8.1 provides a general review on current visual surface preparation stan-
dards. Visual standards should always be used in conjunction with the written text,
and they should not be used as a substitute of a written standard. The standards listed
in Table 8.1 are limited to hot-rolled steel surfaces prepared for painting. They are
applicable also to steel substrates that show residues of firmly adhering paint or
other foreign matter in addition to residual mill scale. Therefore, care must be taken
in applying these standards to other substrate materials.
8.2 Visual Cleanliness 339
Table 8.1 Contents of visual blast cleaning standards
Standard Surface reference for
Rusty
steel
Coating/primer Flash
rust
Cleaning
degree
ISO 8501-1 xx
ISO 8501-2 xx x
International Slurry
blasting Standard
a
xxx
SSPC – NACE xxx
a
Issued by International Paint, Newcastle
8.2.2 Initial Conditions
Initial conditions have a notable effect on the performance of coatings applied to
blast cleaned steel substrates. The effects of rust grades and preparation grades on
coating lifetime are illustrated in Fig. 8.2. It can be seen that lifetime decreased if
rust grade increased and if preparation grade decreased. A high rust grade (“C” or
“D”) required a higher degree of surface preparation in order to guarantee equal
coating lifetimes. The low surface preparation standard Sa 1 was extremely sen-
sitive to changes in the initial conditions. Rust grade “A” (adhering mill scale but
little, if any, rust) was least sensitive to changes in surface preparation degree, but
20
rust grade
A
B
C
D
15
10
5
0
1
23
preparation grade
coating lifetime in years
4
Fig. 8.2 Effects of rust grade and preparation grade on coating lifetime (Bahlmann, 1982). Prepa-
ration grades: 1 – brushed; 2 – Sa 1; 3 – Sa 2; 4 – Sa 3 (see Table 8.2 for preparation grades)
340 8 Surface Quality Aspects
if rust grade “C” was present, an increase in the surface preparation grade could
substantially extend coating lifetime.
Initial conditions are designated in several visual standards (see Table 8.1). These
conditions can be subdivided into two groups:
(1) rusty steel;
(2) primers or coatings.
The initial steel grades apply to uncoated steel surfaces that are deteriorated due
to corrosion (either thermal or atmospheric oxidation). Rust grades are illustrated in
Fig 8.3. These rust grades are defined as follows:
r
Steel grade A: Steel surface largely covered with adhering mill scale but little, if
any, rust;
r
Steel grade B: Steel surface which has begun to rust and from which the mill
scale has begun to flake;
r
Steel grade C: Steel surface on which the mill scale has rusted away from which
it can be scraped, but with slight pitting visible under normal vision;
r
Steel grade D: Steel surface on which the mill scale has rusted away and on
which general pitting is visible under normal vision.
Previously coated steel surfaces are designated in ISO 8501-2. There are a large
number of possible systems and coating conditions. The cleaning results do not
depend only on the intensity of cleaning in these cases, but also essentially on type,
thickness and adhesion of the coating systems, and on earlier surface preparation
steps. For these reasons, only analogous applications to real cases can usually be
derived. The coated steel surfaces considered in visual blast cleaning standards in-
clude the following coating/primer systems and conditions:
r
coatings:
– iron oxide shop primer;
– corrosion protection system;
rust grade A
(a)
(b)
(c)
(d)
rust grade C
rust grade D
rust grade B
mill scale
steel
rust
Fig. 8.3 Initial surface conditions according to ISO 8501-1 (adapted from Kjernsmo et al., 2003).
(a) Rust grade “A”; (b) Rust grade “B”; (c) Rust grade “C”; (d) Rust grade “D”
8.2 Visual Cleanliness 341
– a sound coating;
– an unsuitable coating;
r
conditions:
– upper side of a hatch cover;
– upper side of a steel girder;
– new construction work: tubes in a power station.
Other designations for coated substrate surfaces apply to coating failure schemes,
mainly according to the degree of rusting as defined in ISO 4648-3. These particular
cases will be discussed in Sect. 9.1.
8.2.3 Preparation Grades
Effects of blast cleaning preparation grades on the performance of a metal-sprayed
coating are shown in Fig. 8.4. It can be seen from the graphs that pull-off strength
increased if the preparation grade increased. The curves for iron grit and silica
sand showed almost equal linear trends, whereas the trend was different if copper
slag was used as a blast cleaning medium. One reason for the different trend of
copper slag could be the high friability of copper slag. Because the very thorough
Fig. 8.4 Effects of blast cleaning preparation grades on pull-off strength of arc-sprayed aluminium
(Bardal et al., 1973)
342 8 Surface Quality Aspects
preparation grade Sa 3 required a very intense material treatment, slag particles were
fractured. The fracture debris did not effectively contribute to the material removal
process. The surface texture was changed, leading to a deteriorated bond between
substrate and coating, and the initially sharply rising curve started to drop.
Preparation grades as defined in ISO 8501-1 indicate the following two designa-
tions:
r
method of surface preparation;
r
degree of cleaning.
The preparation method dry blast cleaning is designated by the letters “Sa”
throughout the standard. Degrees of cleaning range from “1” to “3”. These degrees
are defined in Table 8.2. The preparation grades are defined by written descriptions
of the surface appearance after the blast cleaning operation, which are also provided
in Table 8.2, together with representative photographic examples.
Cleaning degrees are defined according to the presence of visible contaminants.
These visible contaminants include the following substances:
r
rust;
r
previously existing coatings;
r
mill scale;
r
foreign matter.
Table 8.2 Blast cleaning preparation grades and cleaning degrees (ISO 8501-1)
Preparation grade
Designation Description of surface (when viewed
without magnification)
Preparation
method
Cleaning degree
Sa 1 Light blast cleaning The surface shall be free from visible oil,
grease, dirt, dust, and from poorly
adhering
a
mill scale, rust, paint
coatings and foreign matter.
Sa 2 Thorough blast
cleaning
The surface shall be free from visible oil,
grease and dirt, and from most of the
mill scale, rust paint coatings and
foreign matter. Any residual
contamination shall be firmly adhering.
Sa 2
1
/
2
Very thorough blast
cleaning
The surface shall be free from visible oil,
grease and dirt, and from mill scale,
rust, paint coatings and foreign matter.
Any remaining traces of contamination
shall show only as slight stains in the
form of spots or stripes.
Sa 3 Blast cleaning to
visually clean
steel
The surface shall be free from mill scale,
rust, paint coatings and foreign matter.
It shall have a uniform metallic colour.
a
Mill scale, rust or paint coating is considered to be poorly adhering if it can be removed by lifting
with a blunt putty knife
8.2 Visual Cleanliness 343
Table 8.3 Cleaning degrees for different blast cleaning designations; see also Table 8.2
Standard Preparation
method
Cleaning
degree
ISO 8501-1 (Sa) Sa 1 2 2
1
/
2
3
ISO 8501-2 (Sa) P Sa – 2 2
1
/
2
3
SSPC – SP 7 SP 6 SP 10 SP 5
NACE – 4 3 2 1
NACE wet blasting WAB – 6 10 –
International Slurry Blasting Standard
a
SB – 2 2
1
/
2
–
a
Issued by International Paint, Newcastle
The highest cleaning degree always requires that the surface shall be free of all
these matters, and it shall have a metal finish. The term “foreign matter” may include
larger amount of water-soluble salts and welding residue. Comparative degrees of
cleaning as defined for other surface preparation methods than dry blast cleaning are
listed in Table 8.3. The achievable preparation grade depends on a number of param-
eters, namely air pressure, abrasive type and abrasive particle size. Effects of abra-
sive types were already investigated in an early study conducted by Nieth (1955).
This author related the cleanliness to the capability of impinging abrasive particles
to deform the substrate. Heavily deformed substrates, which are characterised by
folded and bended surface sections, often contained traces of rust and mill scale
after blast cleaning. With respect to the abrasive particle size, a comparative in-
vestigation of Snyder and Beuthin (1989) has shown that coarse as well as very
fine silica sand generated high surface preparation grades (90–95% cleaned to Sa 3;
5–10% cleaned to Sa 2
1
/
2
), whereas medium and fine silica sand generated lower
preparation grades (75% cleaned to Sa 3; 25% cleaned to Sa 2
1
/
2
). If copper slag
and coal slag were used, the highest preparation grade (Sa 3) could not be achieved.
Copper slag delivered 10% cleaned to Sa 2
1
/
2
and 90% cleaned to Sa 2, whereas
coal slag delivered 75% cleaned to Sa 2
1
/
2
and 25% cleaned to Sa 2.
An early approach to replace the rather imprecise and subjective visual assess-
ment through a physically founded parameter was due to Bullett and Dasgupta
(1969). The parameter “reflectivity” of a steel surface, measured with an optical
method, was applied for the assessment of the surface cleanliness. Results of re-
flectivity measurements are shown in Fig. 8.5. Reflectivity increased if treatment
time increased, and the progress of the function was very pronounced in the range
of short treatment times. A reflectivity value of 360 corresponded to a visually
estimated preparation grade Sa 2
1
/
2
. If this preparation grade was achieved, fur-
ther blast cleaning action delivered a marginal increase in reflectivity only. The
value of maximum reflectivity may vary from steel to steel, or with different
abrasive materials, but for each combination there is a rapid initial increase with
time of blast cleaning towards the asymptotic value. Bullett and Dasgupta (1969)
could also show that reflectivity values dropped if a blast cleaned steel was ex-
posed to an open environment. A reflectivity value of 60%, measured immediately
after blast cleaning, dropped down to a value of 10% after 24h of exposure.
Apps (1969) applied a reflectance meter for substrate cleanliness assessment, and
344 8 Surface Quality Aspects
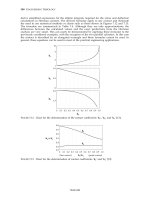
Fig. 8.5 Reflectivity of a blast cleaned steel surface as a function of treatment time (Plaster, 1973)
he investigated the effects of different process parameters on reflectivity. He found
that reflectivity dropped with an increase in blasting angle. This author could
also show that reflectivity depended on abrasive type and condition. Reflectiv-
ity values were high for new and for well-worn chilled iron grit, and they were
low for worn, dusty grit. Blasting pressure and stand-off distance did not have
any significant effect on reflectivity. Bardal (1973) also made an approach to ex-
press visual cleanliness in terms of reflectivity. Reflectivity was defined in his
study as the percentage of reflectivity of a base sample, which was a light grey
tile. Thus, the unit of reflectivity was percent (%). Some results are displayed in
Table 8.4. One striking result is that reflectivity was not a feature of cleanliness
standard alone, but also depended on abrasive type. For a cleaning standard of
Sa 3, for example, reflectivity was only about 60% for copper slag, but it was
about 80% for silica sand. The explanation for this result was the dark colour
of the almost black copper slag. Slag debris embedded into the substrate surface
Table 8.4 Effects of surface preparation grade and abrasive type on reflectivity (Bardal, 1973)
Preparation grade Reflectivity in %
Copper slag Silica sand
Sa 2 40 60
Sa 2
1
/
2
50 75
Sa 3 60 80
8.2 Visual Cleanliness 345
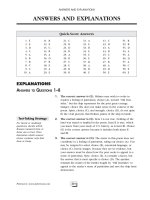
Fig. 8.6 Relationship between reflectivity, abrasive type and pull-off strength for metal-sprayed
coatings (Bardal, 1973). Left: Copper slag (d
P
= 300−2, 500 μm); right: Silica sand (d
P
= 600−
1, 500 μm)
reduced reflectivity (see Fig. 8.7 and Sect. 8.5) for more information on this is-
sue). It could, however, be shown that reflectivity had a unique relationship to
the pull-off strength values for sprayed metal coatings. Results of these investi-
gations are exhibited in Fig. 8.6. The graphs in the figure verify that reflectiv-
ity alone is not a sufficient measure of the coating carrying capability of a blast
cleaned substrate; abrasive type is another considerable parameter. For equal val-
ues of reflectivity of 60%, the substrate prepared with copper slag (left graph)
delivered a pull-off strength of about σ
A
= 13 MPa, whereas the substrate pre-
pared with silica sand (right graph) delivered a pull-off strength of about σ
A
=
9 MPa only.
Hochweber (1971) introduced a method for the assessment of surface preparation
grades which deployed the differences in the electric resistances between metal sub-
strate and a measurement zone. This parameter, denoted transition resistance, was
very low if the substrate featured a high degree of cleanliness. The author found the
following relationships between surface preparation grade and transition resistance:
Sa 1 = 1.0 ⍀;Sa1toSa2= 0.5 ⍀;Sa2= 0.1 ⍀;Sa2
1
/
2
and Sa 3 = 0.05 ⍀.
More recently, Terrat and Boissel (1995) developed a method for the assessment
of the cleanliness of metal substrates based on the measurements of the electrical
346 8 Surface Quality Aspects
surface potential decay. This method proved to be capable to distinguish between
clean metal, oxidation products and oil layers.
8.2.4 Special Remarks
The following factors can influence the result of the visual assessment (ISO 8501-1):
r
initial state of the steel surface other than any of the standard rust grades A to D;
r
colour of the steel itself;
r
regions of different roughness;
r
surface irregularities, such as dents;
r
marks from tools;
r
uneven lighting;
r
shadowing of the surface profile caused by angled projection of abrasive;
r
embedded abrasives.
The latter aspect is considered through a supplement to ISO 8501-1, which il-
lustrates the differences in surface appearance, including colour, which are obtained
when the same surface is prepared by blast cleaning with different abrasive mate-
rials to the same preparation grade. The situation is shown in Fig. 8.7. This situa-
tion is further illustrated by the results of reflectivity measurements as provided in
Table 8.4.
For previously coated surfaces, which have been prepared for re-painting, only
photographs with rust grades “C” and “D” should be used for visual assessment.
The surfaces should be examined either in good diffuse daylight or in equivalent
artificial illumination. For rust grades, the worst grade is evident.
Some recent developments revealed the use of vision sensing systems (Carew
et al., 2001; Chen and Chang, 2006) and image analysing methods (Gupta et al., 2003;
Trujillo and Sadki, 2004; Greverath et al., 2005) for the assessment of blast cleaned
steel substrates. Two examples are shown in Figs. 8.8. and 8.9. The graph in Fig. 8.8
shows a pixel histogram for a steel substrate, which was prepared according to
a surface preparation grade Sa 3 (bare metal). The dimension for the x-axis was
the hue-value of the colour. The rather continuous signal characteristics without
a dominating peak, characterised a clean substrate without discolouration. The re-
sults shown in Fig. 8.9, where differences in peak location and peak height for two
close surface preparation grades in a green-colour histogram could be recognised,
showed that colour measurements have promise for detecting subtle differences in
blast cleaned surfaces. Software solutions are under development for the automatic
detection and quality assessment of blast cleaned substrates (Gupta et al., 2003). An
example is provided in Fig. 8.10.
8.2 Visual Cleanliness 347
1
2
3
4
5
6
7
Fig. 8.7 Effects of abrasive materials on visual appearance of blast cleaned steel substrates (ISO
8501-1/1). Substrate condition: 1-Original mild steel plate (rust grade C); 2-blast cleaned to Sa
3 with high-carbon cast steel shot (S 100, Vickers hardness: 390–530 HV); 3-blast cleaned to Sa
3 with steel grit (G 070, Vickers hardness: 390–530 HV); 4-blast cleaned to Sa 3 with steel grit
(G 070, Vickers hardness: 700–950 HV); 5-blast cleaned to Sa 3 with chilled iron grit (G 070);
6-blast cleaned to Sa 3 with copper refinery slag; 7-blast cleaned to Sa 3 with coal furnace slag
348 8 Surface Quality Aspects
Fig. 8.8 Hue histogram of a blast cleaned stainless steel substrate (Momber, 2005b). Surface
preparation grade: Sa 3 (bare metal)
Fig. 8.9 Histogram of the green element in a colour spectrum for two blast cleaning preparation
grades (NWU, 1995)
8.3 Dissolved Substances 349
Fig. 8.10 User interface depicting two defects on simulated substrate surfaces (Gupta et al., 2003)
8.3 Dissolved Substances
8.3.1 Definitions and Measurement
Chemical cleanliness mainly considers the presence of dissolved substances on the
prepared substrate surface. These substances include dissolved iron and certain
salts. Soluble salts, namely chlorides, phosphates, nitrates and sulphates, are very
widespread on steel substrates. A major source is sea salt, which affects especially
ships, offshore structures and waterfront constructions. However, soluble salts can
also arise from chemical processes, cooling towers, agricultural processes and burn-
ing of sulphur-containingcoal. The detrimental effect of water-soluble contaminants
at the steel/paint interface is well known. The amount of salts, especially chlo-
rides, on blasted surfaces is essential for the performance of the applied coating
systems. It is often thought that salt contamination is an issue for repair and mainte-
nance of existing structures only. However, new construction work can be affected
by salt contamination as well. An example is displayed in Fig. 8.11 showing the
contamination of mechanically cleaned steel panels, which were stored on seashore
locations, through atmospheric salts. After 12 months of storage, most of the panels
displayed high salt contents. Before such panels can go into production, they must be
thoroughly cleaned in order to remove salts. Permissible salt levels are specified in
accordance to the field of application of the coating system, for example according
to atmosphere (air and water) or operation temperature.
350 8 Surface Quality Aspects
Fig. 8.11 Effects of storage conditions on salt contamination of power tool cleaned steel panels
(Flores and Morcillo, 1999). Designations 1–20: locations in Europe and Latin America
Surface contamination by soluble salts has always been an issue for the corrosion
protection industry.It was, however,the replacement of lead-based paints (Pb
3
O
4
)by
other paint types due to environmental concerns that caused a different look at salts
with respect to coating performance. Salt occupancy applies to non-visible surface
contaminantsaccording toSSPC-TU4.Table8.5 providesadescriptionofnon-visible
surfacecleanliness definitions. Thelevelof non-visible contaminantsthatmay remain
on the surface is usually expressed as mass per unit area, much often in μg/cm
2
.The
prime salts most commonly encountered are chlorides, sulphates and nitrates. Ferric
chlorides, however, tend to be more soluble than other salts of lower formula weight.
They, therefore,usuallyproduceratherhighosmoticpressures(see Appleman,2002).
There are several methods used to estimate the salt level on blast cleaned steel
substrates, namely:
r
Direct salt measurement (swab method or adhesive cell method): salt concen-
tration (ppm or mg/l), cross-section (cm
2
) and volume (ml) must be known to
estimate salt contamination (μg/cm
2
);
8.3 Dissolved Substances 351
Table 8.5 Description of non-visible surface cleanliness definitions (SSPC-SP 12/NACE No. 5)
Term Description of surface
NV-1 Free of detectable levels of soluble contaminants, as verified by field
or laboratory analysis using reliable, reproducible methods.
NV-2 Less than 7 μg/cm
2
of chloride contaminants, less than 10 μg/cm
2
of
soluble ferrous ion levels, or less than 17 μg/cm
2
of sulphate
contaminants as verified by field or laboratory analysis using
reliable, reproducible test methods.
NV-3 Less than 50 μg/cm
2
of chloride or sulphate contaminants as verified
by field or laboratory analysis using reliable, reproducible test
methods.
r
Measurement of electric conductivity (total soluble substances): usually ex-
pressed in μS/cm for liquid solutions;
r
Spectrometry: cannot deliver results in terms of salt content per cross-section
(μg/cm
2
).
The latter method cannot only detect a certain salt type, but also its components:
in the case of chlorides, its components, such as sodium hypochloride, chlorine
oxide, chlorine dioxide or hydrochloric acid, can be detected (Trotter, 2001). In-
formation about the testing of steel substrates for soluble salts and soluble iron
corrosion products as well as analysis methods is provided in several parts of
ISO 8502.
8.3.2 Effects of Dissolved Substances on Coating Performance
Chloride content on the substrate significantly influences the performance of coating
systems. Rust development under the paint film and osmotic blistering are com-
monly observed at an early stage in organic coatings applied over contaminated
steel substrates. This was verified through laboratory and site experiments per-
formed by Mitschke (2001), Morcillo et al. (1989a), Kaiser and Sch¨utz (2001) and
Soltz (1991). The investigations of the authors have shown the following:
r
chlorides significantly reduced the capability of paint to penetrate and enclose
rust (Fig. 8.12);
r
time to osmotic blistering decreased if chloride concentration increased (see
Table 8.6);
r
maximum service temperature of linings decreased if chloride concentration in-
creased (an increase by 1.0 μg/cm
2
lowers the maximum service temperature by
about 6
◦
C);
r
number of blisters increased if chloride concentration increased (see Fig. 8.13);
r
much higher levels of sulphate contamination (>100–250μg/cm
2
) were required
to cause coating blistering compared to chloride. Therefore, blistering from sea-
water sulphate contamination does not appear to be a primary problem.
352 8 Surface Quality Aspects
(a)
(b)
Fig. 8.12 Effects of rust contamination on paint penetration capability. (a) Clean rust;
(b) Sulphate-contaminated rust; (c) Chloride-contaminated rust. Magnification: 200 × (Pho-
tographs: Institut f¨ur Korrosionsschutz GmbH, Dresden)
The very extensive study performed by Soltz (1991) also contains an investiga-
tion about the effect of chloride-contaminatedabrasives on the coating performance.
However, the major criterion for salt content is the safe or, respectively, per-
missible salt level that prevents under-rusting or blistering of the applied paint
system. There are different values available in the literature; some are summarised
8.3 Dissolved Substances 353
(c)
Fig. 8.12 Continued
in Tables 8.7 and 8.8. It must be considered that these global values may be modified
for certain applications and coating systems; in such cases, paint manufacturers shall
be consulted. Zinc-based systems are far less vulnerable to salt concentration than
barrier systems, for example. Thresholds for chlorides and sulphates also depend on
DFT of the applied paints; this statement is verified by the values listed in Table 8.8.
Further information is provided by Alblas and van London (1997). It is important to
realise that each different coating/substrate system is likely to have various parame-
ters, including the chloride levels it can tolerate, that are unique to itself.
It is known that the capability of a primer to penetrate existing rust layers depends
on the contamination level (CL) of the rust. The penetration capability is weak if the
rust contains salts. This was verified through comparative metallographic studies by
Kaiser and Sch¨utz (2001) on clean and contaminated, respectively, steel samples
(see Fig. 8.12). The authors defined three levels of salt contamination:
(1) NaCl: <0.5μg/cm
2
;Na
2
SO
4
: <5 μg/cm
2
;
(2) NaCl: 0.81 μg/cm
2
;Na
2
SO
4
: 112.6μg/cm
2
;
(3) NaCl: 87.6 μg/cm
2
;Na
2
SO
4
: 18.8μg/cm
2
.
If the samples were almost clean [case (1)], the coating material enclosed and
integrated the rust completely. The liquefied coating material penetrated up to the
substrate surface, and it was able to wetthe substrate. Thiscase is shown inFig. 8.12a.
Penetration capability of the liquefied paint material decreased if the rust contained
sulphate[case (2)]; rust particles were not enclosedcompletely in that case, and flaws
occurred between substrate and coating. These flaws are clearly visible in Fig. 8.12b.
The worst results, as illustrated in Fig. 8.12c, were obtained with highly chloride-
contaminated rust [case (3)]. Large gaps with widths of 30–40 μm appeared between
354 8 Surface Quality Aspects
Table 8.6 Time to failure by blistering for linings (Mitschke, 2001)
Chloride level in μg/cm
2
Time to blistering in weeks
at various temperatures
88
◦
C77
◦
C66
◦
C54
◦
C43
◦
C
Epoxy novolac, DFT 320 μm
0.6 >56 >56 >56 >56 >56
1.4 >56 >56 >56 >56 >56
3.9 >56 >56 >56 >56 >56
5.3 >56 >56 >56 >56 >56
7.6 >56 36 >56 >56 >56
Epoxy, DFT 193 μm
0.6 3 26–36 >56 >56 >56
1.4 6 26–36 >56 >56 >56
3.9 6 26–36 >56 >56 >56
5.3 5 26 >56 >56 >56
7.6 2 2 4 10 >56
Epoxy, DFT 239 μm
0.6 36 11 12 >56 >56
1.4 3 7 12 >56
>56
3.9 1.5 3 7 >56 >56
5.3 1.5 3 7 >56 >56
7.6 1.5 1.5 3 5 3
Epoxy novolac, DFT 262 μm
0.6 >56 >56 >56 >56 >56
1.4 >56 >56 >56 >56 >56
3.9 >56 >56 >56 >56 >56
5.3 >56 >56 >56 >56 >56
7.6 >56 >56 >56 >56 >56
Epoxy, DFT 252 μm
0.6 1.5 >56 >56 >56 >56
1.4 1.5 1.5 4 >56 >56
3.9 1.5 1.5 3 >56 >56
5.3 1.5 1.5 10 >56 >56
7.6 1.5 1.5 3 >56
>56
Epoxy, DFT 252 μm
0.6 36–43 >56 >56 >56 >56
1.4 36–43 43–56 >56 >56 >56
3.9 3 3 >56 >56 >56
5.3 23 23 >56 >56 >56
7.6 3 3 43- 56 >56 >56
coating and substrate. This gaps contained rust particles that were not incorporated
into the paint. This caused deteriorated adhesion between steel and paint system.
Tests on contaminated substrates, performed by Allan et al. (1995), showed that
the level of dissolved salts not only affected the value of adhesion strength, but also
the type of adhesion of coatings to substrates. With zero contaminants, the mode of
failure was cohesive within the primer coat. As the salt level increased, progressively
8.3 Dissolved Substances 355
Fig. 8.13 Effects of chloride contamination on blistering intensity (Soltz, 1991)
less primer remained adhered to the steel surface. At higher CL, there was a change
from mixed to total adhesive failure of the primer.
Table 8.9 lists further quantitative results. They confirm that with chloride-
contaminated steel substrates exhibited the lowest values for adhesion strength, and
the highest values for degree of blistering and rusting for all coating systems. These
results were caused by the reduced rust penetration capability of the applied paint
systems. Thus, rust, in itself, is not a problem; rather it is the contaminants that the
rust contains.
Chandler (1966), in an early study on the effects of salts in rust, could show that
the presence of sulphates and chlorides in rust increased the corrosion of steel, and
this increased with the amount of salts in the rust. Some results of this study are
Table 8.7 Permissible chloride levels on steel substrates
Institution Permissible chloride content in μg/cm
2
NASA 5
IMO (DE 48/12) 5
SSPC/NACE 7
US Navy (non-immersion service)
a
5
US Navy (immersion service)
a
3
Norsok (M-501) 2
Hempel (non-immersion service)
b
19.5
Hempel (immersion service)
b
6.9
a
Cited in Appleman (2002)
b
Hempel Paints A/S, Longby, Denmark
356 8 Surface Quality Aspects
Table 8.8 Critical salt thresholds that result in early paint deterioration (Morcillo and Simancas,
1997; Appleman, 2002)
Coating system DFT in μm Salt thresholds in μg/cm
2
Chloride (Cl) Sulphate (SO
4
)
Unknown 125–225 7–30 70–300
25–35 >1–
7–11 6–25 9–35
Thin films 7 16
100–150 – 58.8
60–190 6–30 100–250
130–180 5–10 50–100
Epoxy phenolic One coat 1 –
Epoxy polyamide Three coats 5 –
Coal tar epoxy 254 50 –
Fusion-bonded epoxy – <3–
Tank lining epoxy – 10–20 –
Epoxy mastic Two coats 7 –
displayed in Fig. 8.14. The figure also illustrates that contaminated rust layers were
much more sensitive to changes in relative humidity than clean rust or blast cleaned
substrates were. Calabrese and Allen (1978) compared the corrosion behaviour of
steel plates originally covered with atmospheric (industrial) corrosion products and
mill scale. They found that industrially corroded and blast cleaned steel quickly
formed new corrosion products, and they attributed this effect to chloride and sul-
phate trapped in folded substrate regions, which then became active corrosion sites
Table 8.9 Evaluation of coatings for rusted substrates; after one year environmental weathering
(Kaiser and Sch¨utz, 2001)
Coating DFT in μmRust
contamination
Blistering
a
Rust
b
degree
Adhesion
c
strength MPa
Failure type
Noverox + 204 ± 22 None 0 Ri 0 1.3 ± 0.6 A/B10, B/C90
HS epoxy 213 ± 17 NaCl 5/2 Ri 0 1.1 ± 0.6 A/B100
199 ± 20 Na
2
SO
4
3/2 Ri 0 1.4 ± 0.2 A/B40, B/C60
Noverox + 213 ± 24 None 0 Ri 0 3.7 ± 1.4 A/B50, C50
DS-mica 221 ± 16 NaCl 5/2 Ri 1 3.2 ± 1.0 A/B70, C30
208 ± 21 Na
2
SO
4
0Ri14.0± 0.8 A/B20, C80
Antitrust + 173 ± 15 None 0 Ri 0 1.0 ± 0.6 B/C100
HS epoxy 192 ± 18 NaCl 5/2 Ri 0 1.9 ± 0.6 A/B100
182 ± 21 Na
2
SO
4
4/2 Ri 0 1.9 ± 0.6 A/B40, B/C60
Antitrust + 181 ± 17 None 0 Ri 0 4.2 ± 1.0 A/B20, C80
DS-mica 178 ± 9NaCl 5/2 Ri1 3.6± 1.2 A/B80, C20
169 ± 11 Na
2
SO
4
0Ri04.3± 1.5 A/B20, C80
Noxyde 148 ± 15 None 2/2 Ri 0 2.1 ± 0.4 A/B80, B20
136 ± 11 NaCl 5/2 Ri 2-3 2.0 ± 0.9 A/B80, B20
151 ± 10 Na
2
SO
4
3/2 Ri 0 2.9 ± 0.4 A/B90, B10
a
ISO 4628-2
b
ISO 4628-3
c
ISO 4624
8.3 Dissolved Substances 357
Fig. 8.14 Effects of salt contamination and relative humidity on relative corrosion rate in mild
steel (Chandler, 1966)
(see Fig. 8.15). The authors developed a schematic, and suggested an oxidation
cycle, which depicted the formation of new surface corrosion products of an indus-
trially corroded, blast cleaned and environmentally tested steel substrate.
8.3.3 Substrate Cleanliness After Blast Cleaning
A number of investigations were performed in order to evaluate the chloride con-
tent of steel substrates prepared by different surface preparation methods; this in-
cludes the studies of Allen (1997), Brevoort (1988), Dupuy (2001), Forsgren and
Applegren (2000), Kuljian and Melhuish (1999), Momber (2003), Momber and
Koller (2005), Morris (2000), Trotter (2001), NSRP (1998a) and Van der Kaaden
(1994). Some results of these studies are summarised in the Tables 8.10 and 8.11.
A notable reduction in chloride level could be noted if wet blast cleaning and hy-
droblasting were applied. In both these applications, the water flow involved in the
preparation process entered pores, pits, pockets, etc., and it swept the salt away.
This mechanism was verified by results of SEM inspections of hydroblasted steel
substrates (Trotter, 2001). Mechanical methods, such as needle gunning or wire
brushing, did not remove soluble salts with the same reliability. Striking features
were the high values for soluble iron, potassium and chloride after dry blast cleaning
as listed in Table 8.12. Obviously, rust and sea salt could not be removed efficiently
by this method. A study that included other salts (sulphates, phosphates and nitrates)
358 8 Surface Quality Aspects
Fig. 8.15 EPA mapping of a dry blast cleaned steel substrate (Calabrese and Allen, 1978). Upper:
chloride; centre: iron; lower: oxygen
8.3 Dissolved Substances 359
Table 8.10 Chloride levels measured after different pretreatment methods (Forsgren and
Applegren, 2000)
Method Chloride level in μg/cm
2
Bresle (10 min) SSM (10 s)
a
SSM (10 min)
a
No pretreatment 44.8 47.5 61.3
54.8 72.8 96.3
15.2 * *
24.8 * *
Wet blast cleaning 1.6 1.4 2.7
1.6 0.7 2.0
01.73.1
3.2 1.5 4.1
Hydroblasting 1.6 15.2 –
0.8 1.8 4.2
02.44.6
1.2 0.1 2.1
2.4 4.8 10.3
1.2 0 1.0
000.8
Wire brush 28.8 63.5 –
16.0 32.6 58.9
23.2 15.2 25.0
17.6 18.1 30.3
Needle gun 27.6 19.9 42.6
21.2 20.9 35.0
26.8 41.3 96.1
29.6 20.6 31.5
Dry blast cleaning 4.4 8.3 14.8
6.8 10.8 16.5
∗
No measurements
a
Surface saltmeter
was performed by Howlett and Dupuy, (1993). This study showed the same trends
for these types of salts as for the chlorides. It was further found that blast cleaning
did not remove chlorides to safe levels 50% of the time.
Calabrese and Allen (1978) showed through SEM images that dry blast cleaned
steel surfaces exhibited layered and cusp surfaces. Folds were formed during the
blast cleaning process, and impurities were trapped in these folds. EPA mapping
indicated numerous elements present in the traps immediately under the blasted
surface, among them are chlorine and oxygen. Examples of these measurements are
provided in Fig. 8.15. Calabrese and Allen (1978) showed also that surfaces that had
traces of chlorine and sulphur after the blast cleaning process, quickly underwent
new corrosion. Neal (1999), also based on SEM imaging, could detect micro-pits,
which contained chlorides, directly underneath the surface of dry blast cleaned
steel substrates. An example for this situation is provided in Fig. 8.16. Fairfull
and Weldon (2001) investigated the influence of different abrasive materials on the
360 8 Surface Quality Aspects
Table 8.11 Surface contaminant results from different preparation methods (Howlett and
Dupuy, 1993)
Substrate Contaminant Salt level in μg/cm
2
Surface preparation method
Uncleaned Dry blast
cleaned
Hydroblasted Hydro-abrasive
blast cleaned
A-36 steel with Sulphates 40 3 0 4
mill scale Phosphates 0 0 0 3
Chlorides 2 2 1 0
Nitrates 0 6 0 6
A-285 Grade 3 Sulphates 5 5 0 1
steel with mill Phosphates 0 1 0 6
scale Chlorides 4 3 1 1
Nitrates 0 11 1 3
Rusted water Sulphates 5 2 1 2
service pipe Phosphates 1 2 0 6
Chlorides 28 32 1 0
Nitrates 6 1 1 8
Intact coating on Sulphates 8 4 0 0
water service Phosphates 0 2 0 3
pipe Chlorides 6 1 1 0
Nitrates 4 2 1 5
H
2
S scrubber Sulphates 39 7 0 3
plate Phosphates 0 0 0 2
Chlorides 12 8 0 1
Nitrates 0 1 0 3
Heat exchanger Sulphates 7 4 0 0
shell Phosphates 0 0 0 7
Chlorides 17 31 0 0
Nitrates 0 3 0 6
Table 8.12 Soluble substances on prepared surfaces (Navy Sea System Comm)
Element Soluble substance in μg/cm
2
Hydroblasted Dry blast cleaned
Nickel 0.006 0.057
Zinc 0.063 1.512
Manganese 0.003 0.031
Magnesium 0.021 0.672
Calcium 0.121 1.989
Copper 0.033 0.250
Aluminium 0.003 0.352
Lead 0.015 0.045
Iron 0.018 9.450
Potassium 0.414 0.513
Sodium 0.855 42.03
Chloride 0.846 62.55
Sulphate 0.211 1.260
Total 2.611 (100%) 120.71 (4623%)
8.3 Dissolved Substances 361
Fig. 8.16 Chloride-filled pits
underneath a dry blast
cleaned steel surface
(Neal, 1999)
contamination of blast cleaned steel substrates. They found that the use of a certain
type of coal slag led to a notable contamination of the substrate with sulphates. The
sulphate level reached values as high as 9 μg/cm
2
, whereas the sulphate level was
as low as 1 μg/cm
2
for other abrasive materials (iron oxide, nickel slag, steel grit,
olivine, garnet, etc.).
Appleman (2002, 2003) ranked surface preparation methods according to their
relative salt removal capability as follows:
r
hydroblasting with abrasives: 1.00;
r
hydroblasting: 0.95;
r
wet blast cleaning: 0.90;
r
dry blast cleaning: 0.83–0.90;
r
high-pressure water washing: 0.85;
r
hand and power tool cleaning: 0.25.
The salt removal capacity of blast cleaning depended on the designated surface
preparation degree as follows (Appleman, 2003):
r
commercial blast cleaning (Sa 2): 0.83;
r
near white blast cleaning (Sa 2
1
/
2
): 0.84;
r
white metal blast cleaning (Sa 3): 0.90.
Johnson (1997) introduced an alternative method for the extraction of chlorides
from bridge steels. After being dry blast cleaned, the steel may be allowed to set
overnight, so chlorides and oxides rise to the surface and dry outside the contam-
inated pits which could not be cleaned by blast cleaning, and removing the dry,
visible blotches by a subsequent blast cleaning step.
Recommended methods for the removal of water-soluble contaminants from steel
substrates are listed in Table 8.13.