Báo cáo vật lý: "The Hidden Property of Arrhenius-type Relationship: Viscosity as a Function of Temperature" doc
Bạn đang xem bản rút gọn của tài liệu. Xem và tải ngay bản đầy đủ của tài liệu tại đây (352.88 KB, 10 trang )
Journal of Physical Science, Vol. 21(1), 29–39, 2010 29
The Hidden Property of Arrhenius-type Relationship:
Viscosity as a Function of Temperature
Sunny Goh Eng Giap
Department of Engineering Science, Faculty of Science and Technology,
Universiti Malaysia Terengganu, Mengabang Telipot,
21030 Kuala Terengganu, Terengganu, Malaysia
Corresponding author:
Abstract: In this paper, an equation to replace the well-known Arrhenius-type
relationship was derived. This is because the activation energy constant is not yet in its
fundamental form. The model maintains the traditional properties of activation energy
and infinite-temperature viscosity constants, and it contains a new constant that is the
zero-temperature viscosity. The ration of zero- and infinite-temperature represents the
value of fundamental activation energy. This model was tested using six vegetable oils
and has proven its accuracy (R-squared, 0.999). Viscosity – temperature stability refers
to the difference between the zero- and infinite-temperature viscosities, rather than the
activation energy.
Keywords: viscosity, Arrhenius-type relationship, temperature, rheology
Abstrak: Dalam penulisan ini, satu persamaan untuk menggantikan hubungan jenis
Arrhenius telah diterbitkan. Ini adalah kerana pemalar tenaga keaktifan daripada
persamaan itu bukan dalam bentuk asas. Persamaan baru ini mengekalkan sifat asal
tenaga keaktifan dan kelikatan pada suhu tidak terhingga, dan ia merangkumi pemalar
baru, iaitu kelikatan pada suhu sifar. Nisbah kelikatan pada suhu sifar dan kelikatan
pada suhu tidak terhingga merupakan nilai asas untuk pemalar tenaga keaktifan. Model
ini telah diuji dengan enam minyak sayur-sayuran dan kejituannya terbukti (R kuasa dua,
0.999). Kestabilan kelikatan – suhu merujuk pada perbezaan kelikatan pada suhu sifar
dan kelikatan pada suhu tidak terhingga, bukan nilai tenaga teraktifan itu sendiri.
Kata kunci: kelikatan, hubungan jenis Arrhenius, suhu, reologi
1. INTRODUCTION
Viscosity is one of the most important physical properties of a fluid
system. Studies on viscosity have been performed on polystyrene, protein,
pineapple juice, vegetable oil, dark beer, etc.
1–5
Viscosity changes with shear rate,
temperature, pressure, moisture, and concentration; all these changes can be
modelled by equations.
Viscosity as a Function of Absolute Temperature 30
The effect of temperature is normally fitted with the Arrhenius-type
relationship that is shown below:
6–8
a
E
RT
Ae
(1)
Where
is dynamic viscosity (Pa.s); A is the pre-exponential factor (Pa.s); E
a
is
the exponential constant that is known as activation energy (J/mol); R is the gas
constant (J/mol/K) and T is the absolute temperature (K).
The value of A can be approximated as the infinite-temperature viscosity
(
), which is exact in the limit of infinite temperature. Hence, equation (1) can
be rewritten in the following form:
9
a
E
RT
e
(2)
Equations (1) and (2) are basically equivalent. Although equation (1)
normally appears in the literature, equation (2) gives a more accurate
representation of the fluid since the pre-exponential value is better defined there.
However, equation (2) is not yet in its simplest form. In addition to this,
,
a
E
which is used to represent the stability of the liquid system, is reported as
unreliable in discriminating oil viscosity
– temperature stability.
10
The aim of this work is to model the changes in viscosity as a function of
temperature. The objectives are to: (1) derive the simplest form of an equation
that incorporates zero- and infinite-temperature viscosity parameters and has a
relation to the activation energy constant; and (2) to determine a reliable indicator
of the viscosity
– temperature stability of oil from the comparison of the
activation energy constant and the experimental data.
2. EXPERIMENTAL
2.1 Liquids Used in the Experiments
Several types of vegetable oils were used in the experiment. They were:
coconut oil, crude palm kernel (CPK) oil, olive oil, sesame oil, soy oil, and
sunflower oil. These oils were purchased from the respective manufacturers of
Felda Kernel Products Sdn. Bhd., Basso Fedele e figli s.r.l., Lee Kum Kee
(Xinhui) Food Co., Ltd., Celestial Ventures Sdn. Bhd., and Lam Soon Edible Oils
Sdn. Bhd. Coconut oil was manually produced in the laboratory.
Journal of Physical Science, Vol. 21(1), 29–39, 2010 31
2.2 Instrumentation Set-up and Viscosity Measurements
A Brookfield (Viscometer model DV-I+, Brookfield Engineering
Laboratories Inc., Massachusetts, USA) rotational-type viscometer was used to
measure the viscosity of the oil samples. Before use, the viscometer (accuracy:
± 1% full-scale range; repeatability: 0.2% full-scale range) was calibrated with a
4.7 cP Brookfield silicone viscosity standard. The viscosity of the oils was
measured in triplicate at 100 rpm (revolutions per min). The highest speed was
selected in order to increase the accuracy of the measurement because a lower
speed would have increased the fluctuation of the viscosity readings. A
temperature controller (temperature accuracy of ±1
°C) was used to increase the
temperature of the oil samples from 50
°C to 100°C with an increment of 10°C.
For each 10
°C increment, the oil samples were left for 15 min until steady-state
heat transfer was achieved.
2.3 Derivation of the Viscosity – Temperature Model
It is widely accepted that natural logarithmic viscosity is directly
proportional to the reciprocal value of the temperature. To increase the flexibility
of this equation, constants
a
and
b
are introduced into equation (3) as shown
below:
ln
b
a
T
(3)
By knowing that viscosity decreases with increasing temperature and has
a curve concave upward when a viscosity versus temperature graph is plotted,
T
when temperature is approximating infinity. Similarly, a decreasing
temperature would increase the viscosity of a fluid body and thus, temperature at
T
o
would give
o
T
in which .
o
TT
Based on the above-mentioned
conditions, equation (3) can be rearranged into the following form:
o
o
T
T
T
T
T
(4)
The E
a
can be obtained as the following after comparing equations (2)
and (4):
ln
o
T
ao
T
ETR
(5)
Viscosity as a Function of Absolute Temperature 32
Equation (5) has a similar value and unit to that of equation (1). R is the
gas constant, and is equal to 8.314 J/mol/K.
T
o
is the viscosity at temperature T
o
which, in this study, has been taken as the zero-temperature viscosity.
2.4 Model Regression of the Newly Derived Viscosity – Temperature
Model
Equation (4) can be linearised by taking the natural logarithm on both
sides of the equation:
ln ln ln
o
T
o
T
T
T
T
(6)
Equation (6) can be solved by plotting ln(
) versus 1/T and thus, ln(
T
)
is the intercept at the ln(
)-axis and ln
o
T
o
T
T
is the slope of the linear graph.
Viscosity data for the six points from 50
°C to 100°C at 100 rpm for each
vegetable oil was fitted with equation (6) using Microsoft Office Excel and zero-,
infinite-temperature viscosity, and the E
a
, and the R-squared value was estimated.
2.5 Shifting Experimental Data of Viscosity and Temperature to
Investigate the Reliability of E
a
in Indicating the Stability of
Viscosity –
Temperature Relation
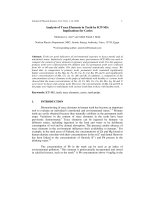
The reliability of the E
a
in indicating a reliable observation for the
viscosity
– temperature relation was carried out using the viscosity of coconut oil,
which was randomly selected from the collection of oils used in this study. The
viscosity
– temperature curve line (M-type) was plotted as shown in Figure 1.
This line was then shifted to the left, right, top and bottom from its original
position (M-type) by taking T – 10 K, T + 10 K,
+ 0.003 (Pa.s) and
– 0.003
(Pa.s), respectively, which resulted in the respective L-, R-, T- and B-shifted
lines. These lines were curve-fitted by equation (6), and its determined model
constants were compared to graphical observations in order to justify any reliable
trend.
Journal of Physical Science, Vol. 21(1), 29–39, 2010 33
Figure 1: Dynamic viscosity versus temperature for coconut oil at 100 rpm.
Notes: M-type is the original viscosity data from experiment; L-shifted is the left-shifted curve after the
temperature was reduced by 10 K; R-shifted is the right-shifted curve after the temperature was
increased by 10 K; T-shifted is the top-shifted curve after the viscosity was increased by 0.003 Pa.s;
and B-shifted is the bottom-shifted curve after the viscosity was reduced by 0.003 Pa.s.
3. RESULTS AND DISCUSSION
3.1 Viscosity –
Temperature Relationship
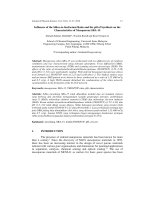
The viscosity of all of the vegetable oils decreased as the temperature
increased. This could be due to the energy obtained to overcome the resistance to
flow, which may be due to the attractive forces among the oil molecules. A
similar behaviour is also observed for various fluids, such as lemon juices, wine,
honey, sweet sorghum and vegetable oil fuel.
11–15
From Figure 2, one can see that
the reduction of the viscosity is greater at the initial stage of the temperature
increment, and subsequent increases in the temperature during the latter part had
less influence on reducing the viscosity, as was observed for all of the vegetable
oils.
Olive and sunflower oil is the most and least viscous, respectively, from
all six vegetable oils measured. The other vegetable oils are ranged between these
two viscous limits in descending order as follows: sesame > soy > CPK >
coconut. The high oil viscosity could be attributed to the stronger attraction force
between oil molecules. Hence, sunflower oil is the liquid with the weakest in
terms of its resistance to flow in relative comparison to the other five oils.
Tem
p
erature
(
K
)
300 320 340 360 380 400
0.000
0.004
0.008
0.012
0.016
0.020
0.024
D
y
namic viscosit
y
(
Pa.s
)
hifted L-s
R-shifted
T-shifted
B-shifted
M-t
yp
e
Viscosity as a Function of Absolute Temperature 34
Coconut
0.025
CPK
O
live
0.020
Dynamic viscosity (Pa.s)
Sesame
So
y
0.015
Sunflowe
r
0.010
0.005
0.000
320 330
340 350 360 370 380
Temperature (K)
Fi
gure 2: Dynamic viscosity of vegetable oils versus temperature at 100 rpm.
Olive and sunflower oil is the most and least viscous, respectively, from
all six vegetable oils measured. The other vegetable oils are ranged between these
two viscous limits in descending order as follows: sesame > soy > CPK >
coconut. The high oil viscosity could be attributed to the stronger attraction force
between oil molecules. Hence, sunflower oil is the liquid with the weakest in
terms of its resistance to flow in relative comparison to the other five oils.
3.2 Zero-, Infinite-temperature Viscosity and E
a
Figure 3 shows that the experimental viscosity data is in close
approximation to the viscosity value estimated from equation (6). This
observation is supported with an overall R-squared value of 0.999 and a mean
squared error (MSE) of 3.47
10
–8
. A high R-squared value of around 0.999 is
also observed for individual vegetable oil (Table 1). This suggests that the
experimental data is well-fitted by the current proposed model.
Zero-temperature viscosity indicates the value of the viscosity right
before the temperature influences it, whereas infinite-temperature viscosity
indicates its internal resistance to flow that is free from the influence of
temperature. The ratio of zero- and infinite-temperature viscosity has an influence
on the E
a
, as indicated by equation (5). This suggests that a greater difference, in
terms of value, between
T
o
and
T
would give a high
T
o
/
T
ratio, which
would result in high E
a
values. Thus, a smaller E
a
indicates an oil viscosity that is
less sensitive to temperature.
Journal of Physical Science, Vol. 21(1), 29–39, 2010 35
0.025
0.020
Estimated value
(
Pa.s
)
O
live
0.05
CPK
Sunflow
e
r
0.010
Coconut
Sesame
0.005
So
y
Linear
(
E
q
uivalent
)
0.000
0.000 0.005
0.010 0.015 0.020 0.025
Expe
r
imental value (Pa.s)
Figure 3: The comparison between the experimentally derived value and the estimated
value from equation (6). R-squared and MSE was calculated as 0.999 and
3.47 10
–8
, respectively.
Table 1: Zero-, infinite-temperature viscosity, E
a
and R
2
value of
vegetable oils.
Vegetable oils
T
O
(PA.S)
T
(PA.S)
a
E (J/MOL)
R
2
Coconut 8.75E–02 1.63E–06 2.47E+04 0.999
CPK 9.83E–02 1.62E–06 2.50E+04 0.999
Olive 1.16E–01 3.28E–06 2.38E+04 0.997
Sesame 1.09E–01 3.21E–06 2.37E+04 0.999
Soy 9.07E–02 4.87E–06 2.23E+04 0.999
Sunflower 8.22E–02 1.27E–06 2.52E+04 1.000
The
E
a
is ranked in a descending order as follows: sunflower > CPK >
coconut > olive > sesame > soy (Table 1). This trend indicates that the viscosity
of soy and sunflower is respectively the least and the most sensitive to the
influence of temperature. This observation is not in consistent to the trend of
o
TT
value on each vegetable oil. The oil with the greatest sensitivity to
temperature effect should possess the highest value of
o
TT
and this belongs
to olive oil which has the largest value. The rests of
o
TT
value are in the
following sequence in descending order: sesame > CPK > soy > coconut >
sunflower. The disagreement between E
a
and the difference between zero- and
infinite-temperature viscosities is indicating the failure of the E
a
to capture
Viscosity as a Function of Absolute Temperature 36
viscosity – temperature stability observation and this problem is explained in the
following section.
3.3 Justification on the E
a
Suitability in Indicating Viscosity –
Temperature Stability
The viscosity – temperature stability was investigated by comparing its
original and shifted curve-lines such as the M-type, L-, R-, T- and B-shifted types
for coconut oil, as shown in Figure 1. Each of the shifted curve-types was carried
out with a constant value of viscosity added or removed from all of the
experimental viscosity data in shifting the curve-line to the top (T-shifted) or to
the bottom (B-shifted) from its original graph (M-type). A similar step was
carried out by shifting the experimental temperature data either to the left
(L-shifted) or to the right (R-shifted) from its original graph. Overall, the zero-
and infinite-temperature viscosity changes depended on the shifted type, and this
indicates that shifting the experimental data in different locations in the graph
gives different E
a
values (Table 2).
Table 2: Zero-, infinite-temperature viscosity, E
a
and R
2
value of
L-, R-, T- and B-shifted curves of coconut oil.
Type
T
o
(Pa.s)
T
(Pa.s)
E
a
(J/mol) R
2
L 6.03E–02 2.08E–06 2.33E+04 0.999
R 1.29E–01 1.27E-06 2.62E+04 0.998
T 6.60E–02 2.03E–05 1.84E+04 0.993
B 2.16E–01 5.27E–09 3.98E+04 0.995
Note: Constants value for M-type is similar to that of coconut oil in Table 1
As mentioned in the previous section, the
E
a
is composed of the zero-
and infinite-temperature viscosity value, as indicated by equation (5).
Understanding the changes in these two constant values would lead to a better
understanding of the changes in the E
a
. Observation of the trend of the curve-line
from the left (L-shifted) to the right (R-shifted), shows an increasing slope value
and a decreasing intercept value (Fig. 4). Since the slope and intercept values
relate to the E
a
and the infinite-temperature viscosity, observing the L- to R-
shifted curve-lines, shows an increasing value in the E
a
but a decreasing value in
the infinite-temperature viscosity. Similarly, this is observed from T- to B-shifted
curve-lines. The
o
TT
is also increasing from L- to R-shifted, and T- to B-
shifted curve-lines. The effort of shifting the experimental data for viscosity and
temperature does not explain the failure of the E
a
in indicating the viscosity –
temperature stability. Therefore, it can be concluded that the activation energy is
not a good representation of the viscosity – temperature stability in terms of
taking the difference of the viscosity value between two points. Activation energy
Journal of Physical Science, Vol. 21(1), 29–39, 2010 37
can only be used to indicate viscosity – temperature stability when the ratio for a
viscosity value that is over other viscosity values is required.
0.024 0.026 0.028
0.030 0.032 0.034
–
3.5
–
4.0
In (Dynamic viscosity) (Pa.s)
–
4.5
M-t
yp
e
–
5.0
T-shifted
B-shifted
5.5
–
L-shifted
R-shifted
6.0
–
6.5
1/T
–
(
1/K
)
Figure 4: Natural logarithmic on dynamic viscosity versus temperature reciprocal for
M-type, L-, R-, T- and B-type curve-lines of coconut oil at 100 rpm.
4. CONCLUSION
A newly-derived equation from the simple correlation between the
natural logarithm of dynamic viscosity and the temperature reciprocal is validated
using six vegetable oils that give very good curve-fitting results, with an overall
R-squared of 0.999. Viscosity, in nature, from vegetable oils is found to decrease
as the temperature increases. The zero-temperature viscosity constant is
introduced into the newly-derived equation and, together with the infinite-
temperature viscosity constant, represents the fundamental value of the E
a
constant. The stability of the viscosity – temperature observation is best indicated
by the difference between zero- and infinite-temperature viscosities when the
subtraction is more important than the ratio between any two points of viscosity.
5. ACKNOWLEDGEMENTS
The author would like to convey his thanks to those who have indirectly
contributed to this research. They are: Ms. Azira Amran, Mr. Mahmood
Sulaiman, Mrs. Siti Zalaikhar, Mr. Rozimi and Ms. Mazalina.
Viscosity as a Function of Absolute Temperature 38
6. REFERENCES
1. Fasina, O. O. & Colley, Z. (2008). Viscosity and specific heat of vegetable oils as
a function of temperature: 35
°C to 180°C. Inter. J. Food Prop., 11(4), 738–746.
2. Dak, M., Verma, R. C. & Jain, M. K. (2008). Mathematical models for prediction
of rheological parameters of pineapple juice. Inter. J. Food Eng., 4(3), 1–17.
3. Toth, J., Simon, Z., Medveczky, P., Gombos, L., Jelinek, B., Szilagyi, L., Graf, L.
& Malnasi-Csizmadia, A. (2007). Site directed mutagenesis at position 193 of
human trypsin 4 alters the rate of conformational change during activation: Role
of local internal viscosity in protein dynamics. Proteins: Struct. Function Genet.,
67(4), 1119–1127.
4. Balakrishnan, R. K. & Guria, C. (2007). Thermal degradation of polystyrene in
the presence of hydrogen by catalyst in solution. Polym. Degrad. Stab., 92(8),
1583–1591.
5. Severa, L. & Los, L. (2008). On the influence of temperature on dynamic
viscosity of dark beer. Acta Universitatis Agriculturae et Silviculturae
Mendelianae Brunensis, 56(2), 303–307.
6. Choi, H. M. & Yoo, B. (2009). Steady and dynamic shear rheology of sweet
potato starch-xanthan gum mixtures. Food Chem., 116(3), 638–643.
7. Thodesen, C., Xiao, F. & Amirkhanian, S. N. (2009). Modeling viscosity
behaviour of crumb rubber modified binders. Constr. Build. Mater., 23(9), 3053–
3062.
8. Saeed, R., Uddin, F., Masood, S. & Asif, N. (2009). Viscosities of ammonium
salts in water and ethanol + water systems at different temperatures. J. Mol. Liq.,
146(3), 112–115.
9. Wan Nik, W. B., Ani, F. N., Masjuki, H. H. & Eng Giap, S. G. (2005). Rheology
of bio-edible oils according to several rheological models and its potential as
hydraulic fluid. Ind. Crops Prod., 22(3), 249–255.
10. Goh, E. G., Wan Nik, W. M. N., Fadhli Ahmad, M. & Amran, A. (2009). The
assessment of rheological model reliability in lubricating behaviour of vegetable
oils. National Tribology Conference, Universiti of Malaya, NTC, Kuala Lumpur,
4–5 May 2009, 58–65.
11. Magerramov, M. A., Abdulagatov, A. I., Abdulagatov, I. M. & Azizov, N. D.
(2007). Viscosity of tangerine and lemon juice as a function of temperature and
concentration, Inter. J. Food Sci. Technol., 42(7), 804–818.
12. Yanniotis, S., Kotseridis, G., Orfanidou, A. & Petraki, A. (2007). Effect of
ethanol, dry extract and glycerol on the viscosity of wine. J. Food Eng., 81(2),
399–403.
13. Queiroz, A. J. D. M., De Figueiredo, R. M. F., Da Silva, C. L. & Mata, M. E. R.
M. C. (2007). Rheological behaviour of honey from Serjania glabrata flowers,
Revista Brasileira de Engenharia Agricola e Ambiental, 11(2), 190–194.
14. Akbulut, M. & Zcan, M. M. (2008). Some physical, chemical, and rheological
properties of sweet sorghum (Sorghum bicolour (L) Moench) pekmez (molasses).
Inter. J. Food Prop., 11(1), 79–91.
15. Altin, R., Cetinkaya, S. & Yucesu, H. S. (2001). The potential of using vegetable
oils fuels as fuel for diesel engines. Ener. Conv. Manag., 42(5), 529–538.