Báo cáo vật lý: "MORPHOLOGY STUDIES OF POROUS GaP, SYNTHESIZED BY LASER-INDUCED ETCHING" pdf
Bạn đang xem bản rút gọn của tài liệu. Xem và tải ngay bản đầy đủ của tài liệu tại đây (509.76 KB, 14 trang )
Journal of Physical Science, Vol. 18(1), 103–116, 2007 103
MORPHOLOGY STUDIES OF POROUS GaP,
SYNTHESIZED BY LASER-INDUCED ETCHING
Khalid M. Omar
School of Physics, Universiti Sains Malaysia,
11800 USM Pulau Pinang, Malaysia
Corresponding author:
Abstract: The laser-induced etching (LIE) has been proposed as an alternative
technique. This LIE process is used to create GaP nanostructure. The studies of surface
morphology of the reconstructed surface etched by laser-induced etching and the etching
rate parameters have been investigated. The surface structure, pits diameter and
distribution have been illustrated by using a scanning electron microscopy (SEM). Study
of the effect of laser parameters on the surface morphology of the etched area such as
different laser power densities and irradiation times has been made. Different structures
have been produced for porous GaP. It is found that the pore walls become extremely
thin and shorter at 12 W/cm
2
power density and 15 min irradiation time.
Keywords: GaP, morphology, LIE
1. INTRODUCTION
The opto-electronic application of compound semiconductor materials
has attracted extensive research and development activities over the last decade,
particularly in the area of quantum functional devices. Porosity has emerged as an
effective tool for controlling electronic and optical properties of semiconductor
quantum structures.
1,2
Much research on semiconductors is focused on the
characterization of surface effects, which strongly affects the properties of a
semiconductor. The quantum confinement effects are considered to control the
mechanism of luminescence in nanocrystallites. The enhancement of
luminescence efficiency is required because the band-to-band transition in the
indirect band gap semiconductor material is extremely low. The reduction of size
to a few nanometers has been used for the observation of efficient light emission
by a modification in electronic, optical and vibrational properties compared to the
bulk.
3
Moreover, the absorption edge of band-to-band transitions generally shifts
to blue side by the confinement energies of the electrons and holes due to the
quantum confinement.
4
When the dimension in a particular direction is less than
the Bohr radius (a
B
), the motion of the carriers is restricted and the electron and
hole wave functions are confined in that direction.
B
Morphology Studies of Porous GaP 104
The reported, theoretical and experimental studies, on porous silicon
formation span over nearly four decades.
5
The main interest in porous Si resulted
from the proposal, made in 1990, that efficient visible light emission from high
porosity structures arises from quantum confinement effects as a result of the
conversion of the material band gap from indirect to direct and consequently high
photoluminescence (PL) efficiency.
6
Several models have been proposed, some
of which are functionally equivalent even though the underlying phenomenology
is different.
Recently, anodic etching has been effectively used for fabricating porous
layers and freestanding membranes of different III-V compounds. Porous III-V
semiconductors offer important advantages over porous silicon. These include a
possibility of changing the chemical composition and directional etching.
Further, III-V compounds exhibit Fröhlich type surface related vibrations with
porosity tunable frequencies and efficient second harmonic generation.
7–9
The
porous III-V semiconductors, due to their intense luminescence and large non-
linear optical response, are promising candidates for fully integrated light sources
and frequency converter sub systems.
GaP, which is an indirect band gap (2.26 eV), offered an interesting
possibility for obtaining a direct band gap material (2.78 eV) in the form of
nanometer size crystalline GaP. Its band gap falls in the green and UV
wavelength region and, therefore, is a promising material for the light emitting
devices.
Most of studies reported to date concerning the porous GaP layer
formation are blue and UV photoluminescence from porous GaP structures
prepared by electrochemical anodization of crystalline bulk material. The PL of
porous GaP at energies above the band gap of the bulk material has been
attributed to quantum size effects.
10–12
Furthermore, porosity-induced
intensification of the near-band-edge emission was observed in gallium
phosphide. But there is less structural data revealing the dimensionality of the
skeleton.
13–14
Many other workers have demonstrated porous GaP photo anodes
with significantly enhanced quantum yields around its bulk indirect band gap.
15–16
The confinement of electrons and holes in quantum wires of GaP in the
porous layer was proposed as the origin for the blue and UV emission bands in
porous GaP. For the quantum confinement structure in the porous layer, the blue
and UV emission is expected to be much stronger than the orange emission from
bulk GaP.
17
The optical properties of the porous GaP are different from the
properties of the original single crystal. The modification of the properties of GaP
could be due to an intensification of the electron-phonon interaction in the
submicron to nanometer size structures of the porous layer.
18
Journal of Physical Science, Vol. 18(1), 103–116, 2007 105
In n-GaP made porous by anodization etching, the photocurrent response
within the porous layer indicates an increase in the optical path length in the
porous layer. When the absorption length (penetration depth) (1/α) is larger than
the thickness of the porous layer, significantly large electron-hole pairs are
created in that region.
In semiconductor device fabrication, the wet etching (isotropic and
anisotropic) is frequently used. The formation of porous layers is an extreme case
of anisotropic etching. The anodic etching is carried out with external bias and
the sample is immersed in HF solution. The pore density, dimension and structure
of the porous layer depend upon doping density, crystallographic orientation of
the surface, etching time and current density. The formation of pore geometry,
morphology, growth direction, growth rates and nucleation are fairly well
understood for silicon but no clear understanding has emerged for the pore
formation and nucleation in III-V semiconductors. Laser-induced etching (LIE) is
an alternative technique for controlled dissolution of semiconductors and
formation of porous layers with well-defined pore structures. The laser-induced
etching technique does not involve external biasing and provides a unique tool
for controlling pore structure and dimensions.
19–25
Many semiconductor
compounds have been investigated in the porous form. Pore formation has been
reported for GaP in many electrolytes.
26,27
A majority of this work has focused on
the light emission process, blue and UV-luminescence from porous
GaP.
28,29
Though GaP has an indirect band gap structure similar to silicon, the
pore structure and pore formation is significantly different.
2. THE LIE EXPERIMENTAL SET-UP
A simple experimental set-up was used for laser-induced etching (LIE),
which consists of a CW argon-ion laser, reflecting mirror, focusing lens and
plastic container, as shown in Figure 1. The laser beam (514.5 nm) was reflected
by an aluminium coated highly reflecting mirror (99.5%) and focused on to the
sample of 1.5 mm diameter by using a suitable quartz lens with focal length of 10
and 5 cm of diameter. This lens was mounted on a micrometer holder for the
focusing adjustment. The laser beam power density required for LIE process of
GaP was varied up to 12 W/cm
2
and with different irradiation times: 5, 10 and
15 min.
The gallium phosphide wafers (n-type) were rinsed with ethanol for
10 min to clean the surface and then immersed in aqueous 40% wt. HF acid. The
immersed wafer was mounted on two Teflon plates in order to allow the current
that could pass from bottom to top area (irradiation area) through electrolyte, with
suitable power density and irradiation time.
Morphology Studies of Porous GaP 106
The samples were rinsed with ethanol and dried in air. The porous GaP
was formed on the laser-irradiated surface of the samples. The freshly prepared
samples were stored immediately in a vacuum chamber under 10
–3
mbar to avoid
contamination. Porous GaP layers had been prepared by laser-induced etching
from n-GaP, (100) orientation having carrier concentration 3.7×10
17
cm
–3
.
Argon-ion laser ( λ = 514.5 nm)
Power density = 1.5- 12 W/cm
2
Irradiation time = 5 -15 minutes
F 40 %
with Ethanol
Dry in air
Spot size = 1.5 mm
Sample: GaP(n-type)
Etching solution: H
Rinsing
M rirro
F acid
eflon plat
P a fer
Focusing Lens
Plastic container
H
T es
Ga w
X-Y Translation
Focusin
g
lens
Plastic containe
r
HF acid
GaP wafer
Teflon plates
Mirror
Argon-ion laser
Argon-ion laser (
λ
= 514.5 nm)
Power density = 1.5–12 W/cm
2
Irradiation time = 5–15 min
Spot size = 1.5 mm
Sample: GaP (n-type)
Etching solution: HF 40%
Rinsing with ethanol
Dry in air
Figure 1: The laser-induced etching set-up
3. SURFACE MORPHOLOGY
Surface morphology of porous semiconductors, in general, is known to
be very complicated and depends strongly on fabrication conditions. In this work,
we study the surface morphology of porous layers obtained by laser-induced
etching of n-type GaP (100) substrates. The morphology of porous gallium
phosphide layers changes rapidly with laser power densities and irradiation times.
4. RESULTS AND DISCUSSIONS
4.1 The Effect of Laser Irradiation Time
The SEM micrographs of twelve representative porous GaP samples
etched at different irradiation times were investigated. By keeping the laser
power density constant, we studied the effect of varying irradiation time on the
morphology of the GaP porous layer.
Journal of Physical Science, Vol. 18(1), 103–116, 2007 107
Three samples were etched at low power density of 1.5 W/cm
2
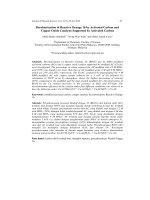
. For small
irradiation time of 5 min, the LIE produced pore structure with thick walls. The
pore dimension was typically <500 nm and the pores were oriented along the
(111) direction. The pore structure was not clearly defined as shown in
Figure 2(a). On increasing the irradiation time to 10 min, the pore structure
became slightly disordered as shown in Figure 2(b).The increased irradiation
time decreased the pore wall dimension to approximately 250 nm, though the
etched area was irregular; the structure was still oriented along (111). On
increasing the irradiation time further up to 15 min, as shown in Figure 2(c), there
was an evidence of deep pores existence with clearly defined broken pore walls
along the (111) direction. The pore walls were approximately 200 nm thick and
some of the pore walls showed extremely thin tips at the top. This indicated that
the pore walls had non-uniform thickness at the higher irradiation time.
(a)
(b)
(c)
Figure 2: SEM images of porous GaP synthesized by LIE at laser power density
1.5 W/cm
2
for (a) 5 min, (b) 10 min, and (c) 15 min irradiation time
Morphology Studies of Porous GaP 108
When the power density increased to 3 W/cm
2
, lateral structures were
clearly visible even with small irradiation time of 5 min, as seen in Figure 3(a).
The pore structures apparently always grow along the (111) direction irrespective
of power density of laser and the irradiation time. The higher power density
reduced the wall thickness to 100 nm though the structure remained fairly
regular.
On increasing the irradiation time to 10 min, there was an increase in the
pore density and decrease in pore wall thickness to 80 to 100 nm as shown in
Figure 3(b). The image of Figure 3(c) showed the structure of the porous layer
when the GaP substrate irradiated for 15 min, which revealed that the longer
irradiation time created porous layer with highly regular lateral structure along
the (111) directions with pore dimension of 50 to 80 nm. It appeared that the high
laser power density along with long irradiation time led to dissolution of already
formed structure in the porous layer due to the availability of high density of
electron hole pairs at the semiconductor-electrolyte interface.
When the power density was increasing up to 6 W/cm
2
at small etching
time of 5 min, the etched surface onset of pore structure with small pits were
irregular in shape and size, shown in Figure 4(a). For the etching time of 10 min,
the structure of porous layer was more regular broken wire-like shape oriented
along the (111) direction with lateral separation of 150 nm, shown in
Figure 4(b). At 15 min etching time, one can see in Figure 4(c) that the disorder
set in. The pore layers consisted of crystalline GaP with pores aligned in distinct
crystallographic directions. The surface shows lateral structures in the (111)
directions. The pore dimension was ~100 nm. The pore wall was probably
insoluble GaF
3
.3H
2
O, while the various gallium and phosphorous oxides, as well
as the relevant phosphorous was soluble in aqueous solutions of low pH 30.
For the laser power density of 12 W/cm
2
, a well-defined wire-like pore
structure was formed even for 5 min irradiation time due to the large density of
hole supplied at the semiconductor-electrolyte interface. The long wires running
parallel to (111) direction had various sizes. Therefore, the regular structures had
been synthesized for 100 nm pore dimension under these parameters as can be
seen in Figure 5(a). At longer irradiation time of 10 min, the pore structure had
grown deeper with thinner pore walls. Some of the pore walls are 20 to 50 nm in
dimension as shown in Figure 5(b). Further increase in the irradiation time to
15 min. led to the pore propagating deep into the substrate and the pore walls
becoming extremely thin, in the range of 10 to 50 nm as can be seen in Figure
5(c), the large portion of the walls was also etched away and pore walls became
shorter. At much higher laser power density the pore structure became disordered
and a hole is created in the substrate.
(a)
(b)
(c)
Figure 3: SEM images of LIE synthesized porous GaP at laser power density of
3 W/cm
2
for (a) 5 min, (b) 10 min, and (c) 15 min irradiation time
(a)
(b)
(c)
Figure 4: SEM images of LIE synthesized porous GaP at laser power density of
6 W/cm
2
for (a) 5 min, (b) 10 min, and (c) 15 min irradiation time
(a)
(b)
(c)
Figure 5: SEM images of porous GaP synthesized by LIE at laser power density
of 12 W/cm
2
for (a) 5 min, (b) 10 min, and (c) 15 min irradiation time
(a)
(b)
(c)
Figure 6: SEM images of porous GaP produced by LIE at 12 W/cm
2
for
(a) 5 min, (b) 10 min, and (c) 15 min with HF + ethanol as electrolyte
Journal of Physical Science, Vol. 18(1), 103–116, 2007 113
4.2 The Effect of Electrolyte Concentration
The GaP substrate was immersed in HF acid 40% diluted by ethanol 50%
under different irradiation times 5, 10 and 15 min and with a fixed power density
of 12 W/cm
2
.
It can be seen from the SEM micrographs that the surface morphology
and pore structure of the etched GaP samples are quite different from sample
etched with concentrated HF electrolyte. Figure 6(a) shows the morphology of
porous GaP sample that was irradiated for 5 min. The pore morphology was
random with no sign of any preferential etching. There were coarse features in
the micrometer range and, on top of them, fine features with size in the range
below 250 nm. It appears that the photochemical etching produces a bimodal
effect in the crystal size distribution with coarse structure supporting the fine
nanometer size structure.
8, 11–12, 15, 28–33
With an increase in the irradiation time, the pores grew selectively along
a preferred crystallographic direction. On increasing the etching time to 10 min,
illustrated by Figure 6(b), the pore structure was more oriented, while for 15 min
irradiation time, shown by Figure 6(c), the orientation probably change from
(100) to (111) direction, under same etching conditions. The structures were more
uniform and the pore dimension was around 150 to 200 nm. The pore diameter
was the same throughout the porous layers and the GaP remaining between the
pores was crystalline. The lighter areas corresponded to the GaP and the dark
parts to the pores. No lateral structures could be seen in these samples but the
SEM had revealed a cylindrical or wire-like geometry and the charge carriers
confined in such wires would result in an increase of the band gap energy due to
the quantum confinement.
5. DISCUSSION
In GaP, the etching was preferentially along the (111) direction. Similar
surface morphologies had also been observed in the photochemical etching of
n-InP (100) where the preferential growth direction was along the (011) axis.
34
The SEM micrographs revealed that the pores grow in the (111) directions from
gallium to phosphorous denoted as the (111) direction, similar to that in GaAs.
30
The chemical reaction of the hole with phosphorous was stronger than with
gallium due to high reactivity of phosphorous. At the onset of etching, there were
disjointed lateral structures. When the irradiation time was further increased, the
pores become randomly oriented and their size reduced with an increase in the
power density. This was due to random etching caused by the very high density
of holes presented at the GaP surface. It could be inferred that the porosity was
initially found to increase with increasing etching time, but there existed an
optimum etching time beyond which the porosity decreased and randomization of
the pores set in.
On further increasing the power density, the pore widened and the
morphology became highly regular. The pores were all aligned along the (111)
preferential direction. It was also observed that as the power density for etching
was increased, the optimum etching time decreased. Furthermore, as the pore size
increased, the wall thickness decreased and the pore walls were well defined. It
could be concluded that the regular oriented nano-size structures could be etched
on GaP substrate by laser-induced etching. Selecting suitable power density and
irradiation time could control both the size and the shape of these structures.
6. CONCLUSION
The processing of laser-induced etching was accomplished by first
absorbing band-gap photons in semiconducting electrode immersed in an
appropriate liquid electrolyte. Electron-hole pairs were created in the
semiconductors, which then separated in the space charge layer of the
semiconductors. The etching proceeded through trapping of valence band holes in
surface bands. The electrons in the conduction band created at the surface can
gain sufficient kinetic energy in a large power density to generate new electron-
hole pairs upon impact with an atom thus breaking lattice bonds. The valence
band electrons at the surface could be tuned to the conduction band if photons
with large energies were present, thus creating free holes in the valence band
also. The crystallographic orientation in anisotropic etching, determined the
density, dimensions and shapes of pores. The technique of laser-induced etching
could be successfully adopted to synthesize GaP nanoparticles. Also, if the laser
energy was tuned, then the etched structure could be created deeper into the
substrate due to variation in the penetration depth.
7. REFERENCES
1. Voos, M., Uzan, P., Delalande, C. & Bastard, G. (1992). Appl. Phys.
Lett., 61, 1213.
2. Prokes, S.M., Freitas, J.A. Jr. & Searson, P.C. (1992). Appl. Phys. Lett.,
60, 3295.
3. Smith, R.L. & Colline, S.D. (1992). J. Appl. Phys., 71, R1.
4. Suemoto, T., Tanaka, K., Nakajima, A. & Itakura, T. (1993). Phys. Rev.
Lett., 70, 3659.
5. John, G.C. & Singh, V.A. (1995). Phys. Rep., 263, 93.
6. Canham, L.T. (1990). Appl. Phys. Lett., 57, 1046.
7. Tjerkstra, R.W., Gomer Rivas, J., Vanmaekelbergh, D. & Kelly, J.J.
(2002). Electrochem. & Solid-state Lett., 5, G32.
8. Tiginyanu, I.M.G., Irmer, G., Monecke, J. & Hartnagel, H.L. (1972).
Phys. Rev., B 55, 6739 (1997).
9. Miao, J., Tiginyanu, I.M., Hartnagel, H.L., Irmer, G., Monecke, J. &
Weiss, B. (1997). Appl. Phys. Lett., 70, 491.
10. Tutuncu, H.M. & Srivastava, G.P. (1996). Phys. Rev., B 53, 15675.
11. Belogrokhov, A.I., Karavanskii, V.A., Obraztsov, A.N. & Timoshenko,
V.Y. JETP Letter, 60, 274.
12. Kuriyama, K., Ushiyama, K., Ohbora, K., Miyamoto, Y. & Takeda, S.
(1998). Phys. Rev., B 58, 1103.
13. Schmuki, P., Lockwood, D.J., Labbe’, H.J. & Fraser, J.W. (1996). Appl.
Phys. Lett., 69, 1620.
14. Tiginyanu, I.M., Ursaki, V.V., Karavanskii, V.A., Sokolov, V.N., Raptis,
Y.S. & Anastassakis, E. (1996). Solid State Commun., 97, 675.
15. Erne’, B.H., Vanmaekelbergh, D. & Kelly, J.J. (1996). J. Electrochem.
Soc., 143, 305.
16. Cui, Y. & Lieber, C.M. (2001). Science, 291, 851.
17. Meijerink, M., Bol, A.A. & Kelly, J.J. (1996). Appl. Phys. Lett., 69,
2801.
18. Zoteev, A.V., Kashkarov, P.K., Obraztov, A.N. & Timoshenko, V.Y.
(1996). Semiconductors, 30, 775.
19. Rasheed, B.G., Mavi, H.S., Shukla, A.K., Abbi, S.C. & Jain, K.P. (2001).
Mat. Sci. & Eng., B 79, 71.
20. Noguchi, N. & Suemune, I. (1993). Appl. Phys. Lett., 62, 1429.
21. Nagan, L., Lee, K.C. & Cheah, K.W. (1998). J. Appl. Phys., 83, 1637.
22. Koker, L. & Kolasinski, K.W. (1999). J. Appl. Phys., 86, 1800.
23. Kolasinski, K.W., Bernard, J.C., Ganguly, S., Koker, L., Weller, A.,
Aindow, M., Palmer, R.E., Field, C.N., Hamely, P.A. & Poliakoff, M.
(2000). J. Appl. Phys., 88, 2472.
24. Aspens, D.E. & Studna, A.A. (1993). Phys. Rev., B 27, 985.
25. Soni, R.K., Bassam, G.R. & Abbi, S.C. (2003). Applied Surface Science,
214, 151.
26. Schmuki, P.L., Erickson, E., Lockwood, D.J., Fraser, J.W., Champion, G.
& Labbe’, H.J. (1998). Appl. Phys. Lett., 72, 1039.
27. Zavaritskaya, T.N., Kvit, A.V., Mel’nik, N.N. & Karavanskii, V.A.
(1998). Semiconductors, 32, 213.
28. Anedda, A., Serpi, A., Karavanskii, V.A., Tiginyanu, I.M. & Ichizli,
V.M. (1995). Appl. Phys. Lett., 67, 3316.
29. Stevens-Kalceff, M.A., Tiginyanu, I.M., Langa, S., Foll, H. & Hartnagel,
H.L. (2001). J. Appl. Phys., 89, 2560.
30. Oskam, G., Natarajan, A., Searson, P.C. & Ross, F.M. (1997). Appl. Surf.
Sci., 119, 160.
31. Lehmann, V. (1995). Thin Solid Films, 255,1.
32. Schuurmans, F.J.P., Vanmaekelbregh, D., Vande Lagenaat, J. &
Lagendijk, A. (1999). Science, 284, 141.
33. Ottow, S., Lehmann, V. & Foll, H. (1996). J. Electrochem. Soc., 143,
385.
34. Fereira, N.G., Soltz, D., Decker, F. & Cescato, L. (1995). J. Electrochem.
Soc., 142, 1348.