Báo cáo lâm nghiệp: "Linking intra-tree-ring wood density variations and tracheid anatomical characteristics in Douglas fir (Pseudotsuga menziesii (Mirb.) Franco)" pot
Bạn đang xem bản rút gọn của tài liệu. Xem và tải ngay bản đầy đủ của tài liệu tại đây (409.8 KB, 8 trang )
Ann. For. Sci. 63 (2006) 699–706 699
c
INRA, EDP Sciences, 2006
DOI: 10.1051/forest:2006050
Original article
Linking intra-tree-ring wood density variations and tracheid
anatomical characteristics in Douglas fir (Pseudotsuga menziesii
(Mirb.) Franco)
Cyrille B. K. R
a
*
, Valérie D
b, c
, Jean-Michel Leban
a
a
Centre INRA de Nancy, UMR INRA-ENGREF 1092, Laboratoire d’Étude de la Ressource Forêt-Bois (LERFoB), Équipe de Recherche
Qualité des Bois, 54280 Champenoux, France
b
Université Libre de Bruxelles, 50 av. F. Roosevelt, SAAS-CP165/55, 1050 Brussels, Belgium
c
Current address: Ministère de la région de Bruxelles capitale, administration de l’équipement et des déplacements, direction des voiries,
cellule plantations, 80 rue du Progrès, 1030 Brussels, Belgium
(Received 19 December 2005; accepted 12 May 2006)
Abstract – In this study, a geometric approach was used in order to model the relationships between intra-tree-ring wood density variations and tracheid
anatomical characteristics. One Douglas fir was studied in detail. Anatomical slides of 256 tree-rings were compared with the corresponding density
profiles. Radial and tangential tracheid diameters decline from earlywood to latewood by 50% and 15%, respectively. At the same time, radial and
tangential cell-wall thicknesses increase by 110% and 132%, respectively. Wood density exhibits an S-shape profile with a slight decrease of 10% at
the beginning of a ring and an increase of 212% thereafter. Model simulations showed that wood density increase is mainly due to cell-wall thickening
in tangential and radial directions as well as cell size reduction in radial direction. Simulations also showed that the knowledge of tracheid anatomical
characteristics is not sufficient to fully explain wood density decrease at the beginning of earlywood.
wood density / wood anatomy / wood quality / image analysis / Douglas fir (Pseudotsuga menziesii (Mirb.) Franco)
Résumé – Relations entre les variations de densité à l’intérieur du cerne et les caractéristiques anatomiques des trachéides pour le sapin de
Douglas (Pseudotsuga menziesii (Mirb.) Franco). Un modèle géométrique a été utilisé dans le but de modéliser les relations entre les variations de
densité à l’intérieur du cerne et les caractéristiques anatomiques des trachéides. Un sapin de Douglas a été étudié en détail. Des images numériques
de coupes anatomiques de 256 cernes ont été comparées aux profils de densité correspondants. Du bois initial au bois final, les diamètres radiaux
et tangentiels des trachéides diminuent de 50 % et 15 % respectivement, pendant que les épaisseurs radiales et tangentielles des parois cellulaires
augmentent de 110 % et 132 % respectivement. La densité du bois présente un profil en forme de S, avec une légère diminution de 10 % au début
du cerne et une augmentation de 212 % ensuite. Le modèle a montré que l’augmentation de la densité est principalement due à l’épaississement des
parois cellulaires dans les directions tangentielles et radiales et à la diminution du diamètre radial des cellules. Ce modèle a également montré que la
connaissance des caractéristiques anatomiques des trachéides n’est pas suffisante pour expliquer complètement la diminution de densité constatée au
début du bois initial.
densité du bois / anatomie du bois / qualité du bois / analyse d’image / sapin de D ouglas (Pseudotsuga menziesii (Mirb.) Franco)
1. INTRODUCTION
Wood density is widely used as an estimator of wood qual-
ity because of its good relationships with various wood proper-
ties. For example, wood density plays a prominent role for e.g.
wood strength, workability, and decay resistance and in carbon
sequestration ability [1, 17, 18, 28, 31, 42]. However, relation-
ships between wood density and other wood properties are of-
ten indirect, making them difficult to interpret. Wood density
is a measure of the amount of matter available, but does not
contain any information about its cellular structure or organ-
isation. Since wood density is a measure of the total amount
of cell-wall material available per volume unit, it is related to
the relative proportions of the different cell types, as well as to
* Corresponding author:
the dimensions of these cells and the thicknesses of the cell-
walls. However, for the same wood density, differences at the
cellular level may occur, causing variations in wood properties
[40]. Consequently, it is important to know to what extent cell
anatomical characteristics affect wood density.
Multiple regressions and similar statistical techniques are
widely applied to estimate wood density from various anatom-
ical characteristics [5, 6, 19,24, 25,36, 41]. The key results of
these studies are that tree-ring density is highly correlated with
earlywood tracheid diameter and latewood percentage. Statis-
tical models, however, are usually restricted to species and
conditions for which they were developed. Moreover, statis-
tical model interpretation is not easy; for example, it is not
really possible to single out the influence of individual vari-
ables.
Article published by EDP Sciences and available at or />700 C.B.K. Rathgeber et al.
Mechanistic models, on the other hand, are rarely applied
because they need specific variables that are not easy to mea-
sure. However, mechanistic models are more flexible and gen-
erally applicable to various conditions and species. Mechanis-
tic models have been developed for softwood to assess how
cell anatomical characteristics relate to wood density [35].
Wimmer [39] designed a geometric model in order to inves-
tigate potential and actual influences of cell anatomical char-
acteristics on tree-ring density. Wimmer’s study [39] showed
that, for conifers, radial diameter and cell-wall thickness of
latewood tracheids have the greatest influence on tree-ring
density, while tracheid length and other cell characteristics, i.e.
parenchyma rays and resin canals, can be neglected. A strong
assumption of Wimmer’s model [39] is that tracheid cross sec-
tions are of rectangular shape. Decoux et al. [8] by testing two
different models of tracheid shapes for three different conifer
species showed that this simplification is acceptable. On the
other hand, Decoux et al. [8] also suggested calibrating the
geometric model with apparent cell-wall density. The appar-
ent cell-wall density, or packing density, which varies within
a tree-ring, is far smaller than the effective cell-wall density
usually reported in the literature [8].
Apart from Decoux et al. [8], all the previous studies
used average earlywood and latewood cell characteristics
[30] in order to explain inter-tree-ring density variations. In
this study, statistical and mechanistic approaches are used to
model, at a cellular level, relationships between intra-tree-ring
wood density variations and tracheid cross-sectional anatom-
ical characteristics. The objectives are (1) assessing to what
extend tracheid cross-sectional anatomical characteristic evo-
lution explains intra-tree-ring wood density change, and (2)
sorting out tracheid anatomical characteristics in order of im-
portance.
The work was carried out with Douglas fir (Pseudotsuga
menziesii (Mirb.) Franco) because the wood density of this
species is characterised by a strong inter- and intra-tree-ring
heterogeneity [37]. Moreover, Douglas fir is of great interest
in forestry as it combines strong productivity and high wood
quality.
2. MATERIALS AND METHODS
2.1. Tree sampling
One 35 year old Douglas fir was felled in April 1998. Height was
24.7 m and the diameter at breast height (DBH) was 33 cm. Thirteen
cross-sectional disks were cut at various heights, with approximately
one disk every two growth units. The studied tree came from an ex-
perimental design located in Amance Forest (48.75
◦
N, 6.35
◦
E) near
Nancy (Lorraine, north-eastern France). It was taken from a stand that
reached a dominant height of 24 m for a mean DBH of 26.6 cm, with
a basal area of 63.3 m
2
/ha. Only very little pruning and thinning were
conducted on this stand.
For each of the 13 disks one radial strip was sawn, oriented south,
and containing the pith. Each radial strip was cut into two parallel
samples. The first sample was submitted to X-ray densitometry anal-
ysis, while the second sample was submitted to anatomical analysis.
In total, 256 tree-rings were sampled.
2.2. X-ray densitometry
Wood strips were X-rayed following standard techniques [26, 31,
32]. Radiographs were digitalised using a scanner. The digital images
were treated using semi-automatic procedures [26,27]. Each tree-ring
was divided in 100 segments of equal width. Density profiles were
produced by averaging the values (XRD, kg/m
3
) obtained from these
segments.
2.3. Anatomical slides analysis
Samples for the anatomical analysis were cut into small blocks be-
fore being sliced with a microtome. A section thickness of 12 µmwas
chosen because it compromise, according to Park [29] and Donaldson
et al. [11], readability vs. conservation of structural identity. Sec-
tions were stained ensuring uniform colours crucial for image analy-
sis [7, 21]. Sections were then placed on slides and fixed with cover
slips. Tree-ring images were acquired at a magnification of 300 using
a digital camera mounted on an optical microscope.
The initial images (comprising 256 grey levels) were converted
into binary images where black pixels correspond to matter (cell-wall
of tracheids, parenchyma rays or resin canals), and white pixels cor-
respond to voids (lumens of tracheids, parenchyma rays, resin canals
and pores). On each tangential row of pixels, the number of black
pixels (nbp) and the number of white pixels (nwp) were counted. The
proportion of matter for an area, i.e. the cell-wall proportion (CWP),
is then obtained as followed:
CWP = nbp
(nwp + nbp). (1)
CWP does take into account cell-walls from tracheids, as well as
those from parenchyma rays and resin canals.
Packing density (PKD, kg/m
3
) is used to describe the ratio be-
tween wood density and cell wall proportion [12, 22,36]:
PKD = XRD/CWP. (2)
Tracheids were automatically recognized on tree-ring images. Means
and standard deviations of tracheid characteristics were continuously
computed for a window of 200 by 200 pixels that was progressively
moved by 10 pixels in radial direction. Only complete tracheids
within the window were considered for measurements. As for the
density analysis, each tree-ring was divided in 100 segments of equal
width. Averaged values obtained from these segments were used to
make continuous profiles for the following variables:
– cell, lumen and wall surfaces as well as cell and lumen perimeters
(called SCell, SLum, SWall, PCell and Plum respectively);
– cell, lumen and wall dimensions, measured in the radial and tan-
gential directions (called RCell, TCell, RLum, TLum, RWall,
TWall respectively).
2.4. Geometric model of wood density
From these primary anatomical variables, morphometric density
(MMD) was obtained by the following equation:
MMD
a
= SWall/SCell. (3)
Decoux et al. [8] showed that for conifers it is reasonable to base
calculations on a rectangular tracheid shape. So, geometric model of
Linking wood density and tracheid characteristics 701
wood density based on tracheid and lumen diameters can be written
as:
MMD
b
= 1 −
RLum × TLum
RCell × TCell
· (4)
Equation (4) possesses the advantage of simplicity, using moreover,
very easy to measure variables. However, in order to test the sensi-
tivity of wood density to the different components of the model, it is
better to use more informative variables:
MMD
c
=
2 · TWall
TCell
+
2 · RWall
RCell
−
4 · RWall × TWall
RCell × TCell
. (5)
Simple linear regressions, computed using SAS
software [33], were
used in the following paragraphs to describe the results.
2.5. Comparison of the two measurement techniques
Differences concerning the field-of-view and the measurement ac-
curacy must be taken into account when comparing data from the
two methods. On the one hand, field-of-view of X-ray densitome-
try (ring width in radial direction × 2 mm in tangential direction ×
2 mm in longitudinal direction) is wider than the one of anatomical
images (ring width in radial direction × 1 mm in tangential direction
× 12 µm in longitudinal direction). On the other hand, X-ray densito-
metry resolution is relatively low (25.40 µm/pixel), while resolution
of anatomical slide images is considerably higher (0.76 µm/pixel).
The 3 firsts and the 3 lasts segments of each tree-ring were removed
from the dataset because it was possible to capture the sharp change
between the end and the start of a tree-ring with image analysis of
anatomical slides but not with X-ray densitometry.
Image analysis of X-ray radiographs and anatomical slides both
provided a measurement for tree-ring widths. This allows comparing
directly the accuracy of the two methods and assesses data quality.
There is a close relationship between tree-ring widths measured by
X-ray densitometry (TRW_XR) and tree-ring widths measured by
image analysis on anatomical slides (TRW_AS). Simple linear re-
gression explain 99% of the variance and shows that there is no sys-
tematic bias between the two types of measurements (TRW_XR =
0.02 + 0.97· TRW_AS). With the exception of height, all measure-
ment pairs were located within the 95% confidence interval. Dubi-
ous values come from tree-rings close to the pith, or exhibiting much
curved limits or accidents. The height outliers were removed from
the dataset. The difference between the two measurement techniques
was greater for rings close to the pith because it was more difficult to
accurately delimit tree-ring boundaries. The innermost tree-ring for
each growth unit was also removed from the dataset because X-ray
densitometry could not accurately distinct the pith and the first ring.
3. RESULTS
3.1. Tracheid characteristics and wood density profiles
Cell diameters generally declined from earlywood to late-
wood. Reduction of radial diameters started right from the be-
ginning of a ring, while it only became sensible after 1/3of
a ring for tangential diameters (Fig. 1A). On average, radial
cell diameters went down to half their size (i.e. from 45 µmto
24 µm), while tangential cell diameters lost only 15% of their
size (i.e. from 38 µmto32µm). Because cell size reduction
was more expressed in the radial direction, the ratio between
tangential and radial diameters increased from 0.85 to 1.43.
These changes led to a decline in cell perimeters by 36% on
average, i.e. from 144 µmto92µm (not shown); as well as a
decline in cell surfaces by 60%, i.e. from 1260 µm
2
to 500 µm
2
(Fig. 1D).
Lumen diameter reduction, from the beginning of a ring to
its end, was even greater than the one seen for cell diameter
(Fig. 1B). Radial lumen diameters went down by 74% on aver-
age, (i.e. from 39 µmto10µm), while tangential lumen diam-
eters went down by 52%, i.e. from 31 µmto15µm. Because
lumen diameter reduction was more expressed in the radial
direction, the ratio between tangential and radial diameters in-
creased from 0.80 to 1.68. These changes led to a decline in
lumen perimeters by 67%, i.e. from 120 µmto40µm (not
shown). Further a huge decrease by 88% was seen for lumen
surfaces, i.e. from 940 µm
2
to 110 µm
2
(Fig. 1D). Because
size reduction affected lumen more than entire cell, the ratio
between lumen and cell surfaces decreased from 0.70 to 0.20.
From the initial tracheids to the terminal ones, cell-wall
thicknesses showed an overall increase (Fig. 1C). In the radial
direction, cell-wall thicknesses increased by 110%, i.e. from
3.2 µmto6.8µm. In the tangential direction, cell-wall thick-
ness increased by 132%, i.e. from 3.8 µmto8.8µm. However,
thinner cell-walls were not found directly at the very beginning
of a tree-ring but around a relative position of 0.08. In tangen-
tial direction maximal cell-wall thicknesses were found at the
very end of a ring, however in radial direction they were found
at a relative position of 0.92. The ratio between tangential and
radial thicknesses decreased gradually within the first 60% of
a ring, but increased rapidly during the final 40%. So, radial
thicknesses increased faster than tangential ones in the first
half of a tree-ring, while tangential thicknesses increased faster
in the second half of the tree-ring. Changes in cell-wall thick-
ness together with changes in cell and lumen diameters led to
an increase of cell-wall surfaces by 33%, i.e. from 330 µm
2
to
440 µm
2
(Fig. 1D). Cell-wall surfaces accentuated what was
observed for cell-wall thicknesses: a dip at the relative posi-
tion 0.2 of the profile, and a top at the relative position 0.85 of
the profile.
From the beginning of a tree-ring to its end, wood density
(XRD) exhibited an S-shape profile with a slight decrease oc-
curring during the first 20% of a ring (Fig. 2A). As a conse-
quence, XRD decreased by 10%, i.e. from 313 to 283 kg/m
3
,
before increasing by 212%, reaching 882 kg/m
3
at the end of a
tree-ring. The cell-wall proportion (CWP) and XRD profiles
were parallel, but the dip at the beginning of the profile is
less accentuated for CWP. On average, CWP decreased by 5%,
i.e. from 0.312 to 0.295, before increasing by 170%, reaching
0.796 at the end of a tree-ring.
3.2. Relationships between wood density and tracheid
characteristics
There was a very good correlation between XRD and CWP.
The simple linear regression model explained 93% of the to-
tal variance (R = 0.96; p < 0.001). The conversion factor of
702 C.B.K. Rathgeber et al.
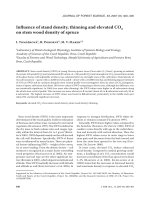
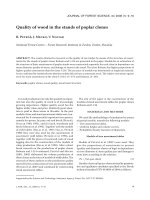
Figure 1. Tracheid characteristic profiles.
A. Radial and tangential cell diameters
(RCell and TCell respectively) as well as
the ratio TCell / RCell (TRCell). B. Ra-
dial and tangential lumen diameters (RLum
and TLum respectively) as well as the ra-
tio TLum / RLum (TRLum). C. Radial
and tangential cell-wall thickness (RWall
and TWall respectively) as well as the ratio
TWall / RWall (TRWall). D. Cell, lumen and
cell-wall surfaces (SCell, SLum and SWall
respectively). Curves were smoothed using
a spline function [33].
CWP to XRD (with the intercept set to 0) was 1060. However,
the relationship between XRD and CWP was not perfectly lin-
ear. For the highest densities, XRD increased faster than CWP,
and for the lowest densities, XRD decreased faster than CWP.
Packing density (PKD) decreased by 4% within the first 20%
of a ring (i.e. from 1010 kg/m
3
to 970 kg/m
3
) and increased
by 13% afterwards, reaching 1100 kg/m
3
at the end of the ring
(Fig. 2B).
Both XRD and CWP correlated significantly with almost
all studied anatomical variables (Tab. I); the best correlations
were obtained with RLum and PLum (R > 0.90), further
RWall, TWall, Slum and TLum (R > 0.80). However, the rela-
tionships between the anatomical variables and XRD or CWP
turned out to be nonlinear, which makes it difficult to predict
wood density with one of these primary variables. By con-
trast, morphometric density exhibited a quasi-linear relation-
ship with CWP and XRD. Very good correlation were found
between CWP and MMD
a
(R = 0.97; p < 0.001); the sim-
ple linear regression model explains 94% of the total variance.
The conversion factor of MMD
a
to CWP (with the intercept
set to 0) was 1. The ratio between CWP and MMD
a
decreased
within the first half of a tree-ring; then it reached a plateau, and
remained constant in the second half of the tree-ring (Fig. 2B).
Correlations were high between the different morphomet-
ric densities (MMD
a
, MMD
b
and MMD
c
). Simple linear re-
gression models explained over 99% of the total variance. The
results confirmed that the rectangular tracheid shape was the
right choice. XRD and MMD
c
were also highly correlated.
Simple linear regression model explained 89% of the total
variance (R = 0.94; p < 0.001); the conversion factor of
MMD
c
in XRD (with intercept set to 0) is 985.94. So, it is
Linking wood density and tracheid characteristics 703
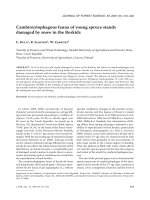
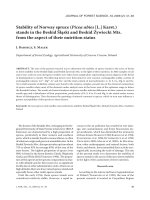
Figure 2. Comparison between wood den-
sity and cell wall proportion. A. Wood den-
sity (XRD), cell-wall proportion (CWP) and
morphometric density (MMD, Eq. (5)) pro-
files along an average tree-ring. B. Pack-
ing density (PKD) and CWP / MMD pro-
files along an average tree-ring. Curves were
smoothed using a spline function [33].
Tabl e I . Correlations between wood density and tracheid characteris-
tics. Pearson correlation coefficients computed between wood density
(XRD) and cell-wall proportion (CWP) on the one hand; and anatom-
ical variables on the other hand. Stars indicate significant correlation
(p < 0.01, n = 96).
Variable Code XRD CWP
Morphometric density (Eq. (5)) MMDc 0.94* 0.97*
Lumen radial diameter RLum –0.89* –0.92*
Lumen perimeter PLum –0.88* –0.91*
Cell-wall radial diameter RWall 0.87* 0.88*
Cell-wall tangential diameter TWall 0.86* 0.88*
Lumen surface SLum –0.83* –0.86*
Cell radial diameter RCell –0.82* –0.84*
Lumen tangential diameter TLum –0.81* –0.84*
Cell perimeter PCell –0.73* –0.76*
Cell surface SCell –0.72* –0.75*
Cell tangential diameter TCell –0.42* –0.46*
Cell-wall perimeter SWall 0.38* 0.36*
feasible to compute intra-ring density variations from tracheid
basic characteristics.
3.3. Exploration of the geometric wood density model
The geometric model allows analysing the contribution of
the various tracheid characteristics independently, in order to
evaluate their relative influences on wood density. For the first
set of simulations, all the variables in the model were fixed
to values they take at the beginning of a ring, with excep-
tion of the variable of interest, which altered along the ring
(Fig. 3A). Under these presumptions, tracheid size reduction
led to a wood density increase by 42%, while cell-wall thick-
ening led to a 102% increase. When anatomical variables were
examined independently, radial and tangential tracheid diame-
ters, radial and tangential thicknesses of cell-wall and packing
density led to an increase in wood density by 34, 12, 43, 74
and 17%, respectively.
For the second set of simulations, all the variables of the
model altered, with exception of the variable of interest, which
was fixed to its initial value at the beginning of a ring (Fig. 3B).
When radial and tangential diameters were kept constant,
wood density loosed 22%; and when radial and tangential
thicknesses were kept constant, wood density loosed 45%.
When anatomical variables were examined independently ra-
dial and tangential diameters, radial and tangential thicknesses
and packing density were responsible for a wood density loss
of 15, 4, 17, 16 and 12%, respectively.
4. DISCUSSION
4.1. Comparison between density data and anatomical
data
In this study, anatomical data acquired from microscopic
thin sections (12 µm thick) were compared with their corre-
sponding density obtained from wood strips (2 mm thick). It
was assumed that anatomical measurements made on thin sec-
tions were representative for thick wood strips. This assump-
tion seems to be realistic considering component characteris-
tics of conifer wood. Tracheids are long tubular cells (between
3.5 and 5.0 mm for Douglas fir) oriented in the longitudinal
direction. In longitudinal direction, tracheid section and cell-
wall thickness are quasi-constant, only tracheid short tips are
slightly thin down [15, 23]. Resin canals are very long tubu-
lar cells oriented in the longitudinal direction as well. Their
morphology is also quasi-constant all along their length [3].
Parenchyma rays, on the contrary, are composed for Douglas
fir by lines of 8 to 15 round cells stretched out in the radial
direction [34]. Cell-wall proportion variability associated to
704 C.B.K. Rathgeber et al.
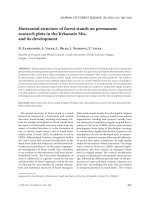
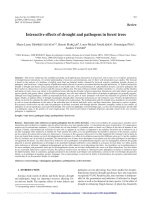
Figure 3. Geometric model simulations.
A. First set of simulations: all the variables
of the model (Eq. (5)) are fixed to their ini-
tial values except the variable of interest by
which the corresponding curve is labelled.
B. Second set of simulations: all the vari-
ables are free except the variable of inter-
est, which is fixed to its initial value and
is used to label the corresponding curve.
Curves were smoothed using a spline func-
tion [33].
parenchyma ray characteristics in a longitudinal direction is
not consistent with the assumption mentioned above. How-
ever, parenchyma rays are rare in Douglas fir [34].
When comparing wood density, cell-wall proportion and
anatomical characteristics, it must be kept in mind that wood
density and cell-wall proportion were measured on the whole
sample, while anatomical characteristics were measured on
tracheids only. Therefore, it was assumed in this study that
wood is solely composed of tracheids. In fact, in conifer
species, tracheids represent 90 to 95% of the total number of
cells, while parenchyma rays only represent around 6% and
resin canals around 1% [2,15, 28].
4.2. Tracheid morphological changes
From the beginning of a tree-ring to its end, cell and lumen
diameters decrease while cell-wall thicknesses increase; these
anatomical modifications lead to an increase of cell wall pro-
portion [4,10,13,37]. Cell and lumen diameter changes along
a tree-ring are greater in the radial direction than in the tan-
gential one [14]. Cell and lumen tangential diameter reduc-
tion mainly occurs in latewood because anticlinal divisions
take place more frequently at the end of the growing season
[14,19]. By contrast, cell-walls are thicker in tangential direc-
tion than in radial one [10], and cell-wall thickening is greater
in the tangential direction than in the radial one. In summary,
cell size diminution principally takes place in the radial di-
rection; while cell-wall thickness augmentation takes place in
the tangential direction but also in the radial one. Variations of
cell-wall thickness are larger than those of cell size [16,20].
It was observed in this study that cell-wall surface and also
cell-wall thickness slightly decrease at the beginning and at the
end of a tree-ring. Cell-wall thickness reduction at the end of
a tree-ring is already mentioned by Wang et al. [38] on black
spruce (Picea mariana Mill.).
4.3. Relationship between tracheid characteristics and
wood density
Lumen perimeter and lumen radial diameter are the
anatomical variables which best correlated with wood density.
From an image analysis point of view, an anatomical image of
a tree-ring can be summarised as a black square of constant
area where lumens are represented by white dots of various
diameters. From this schematic view lumen size can be con-
sidered as a direct estimation of void area and density. So, lu-
men characteristics deserve to be more often reported in future
anatomical studies.
Geometric model simulations show that for Douglas fir
wood density augmentation along a ring is caused by (by or-
der of importance): (1) cell-wall thickening in tangential di-
rection; (2) cell-wall thickening in radial direction; (3) cell size
diminution in the radial direction; (4) packing density augmen-
tation; and (5) cell size diminution in the tangential direction.
Despites the fact that variables, resolution and species were not
the same, our results came close to those presented by Wim-
mer [39]. Application of Wimmer’s model on Scots pines from
Austria shows that potentially the most important factors in-
fluencing wood density are tracheid radial and tangential cell-
wall thicknesses and tracheid radial diameter, while tracheid
tangential diameter and tracheid length have almost no effect.
However, when taking into account natural variability,tracheid
radial diameter becomes the most important factor, while tra-
cheid tangential cell-wall thickness ranks second.
In this study, a decrease of wood density was clearly ob-
served at the beginning of a ring. To a lesser extend, a decrease
of cell-wall proportion was also observed. On the other hand,
no decrease at all was observed for morphometric density (if
packing density is not taken into account) despite the decrease
of cell-wall thickness. In fact, cell-wall thickness diminution
does not explain density decrease because it is compensated by
cell size reduction. So, cell-wall proportion diminution should
Linking wood density and tracheid characteristics 705
also be attributed to factors not taken into account in the ge-
ometric model, like augmentation of inter-cellular spaces for
example. Moreover, cell-wall proportion diminution does not
fully explain wood density diminution. Factors like cell-wall
composition or tracheid length could be responsible for this
difference. Deleuze and Houiller’s process-based model of
xylem growth [9] simulates a diminution of wood density at
the beginning of a ring, and explains it by a temporary short-
age in substrate for cell-wall construction.
5. CONCLUSION
Wood density increase along a ring was mainly due to tra-
cheid anatomical changes: i.e. tracheid cell-wall thickening
and tracheid radial diameter diminution. Packing density aug-
mentation and tracheid tangential diameter diminution only
play minor roles. However, to fully understand density vari-
ations along a ring, it is necessary to explain packing den-
sity variations and in particular reasons why wood density
decreases at the beginning of a ring. To do that, anatomical ob-
servations of tracheid cell-wall need to be coupled with chem-
ical measurements.
This paper focussed on the relationship between wood den-
sity and tracheid characteristics along a tree-ring, i.e. on intra-
tree-ring variations. However, it is also interesting from these
data to investigate how wood density and tracheid character-
istics vary from one tree-ring to another (inter-tree-ring varia-
tions) and how internal and external factors are related to these
variations. A following paper will focus on these points with a
particular emphasis on climate influences.
Acknowledgements: We would like to thank Pierre Gelhaye for
micro-densitometry measurements. We are also grateful to Joëlle
Kivits, Fleur Longueteaud and two anonymous reviewers for improv-
ing the manuscript.
REFERENCES
[1] Barbosa R.I., Fearnside P.M., Wood density of trees in open sa-
vannas of the Brazilian Amazon, Forest. Ecol. Manage. 199 (2004)
115–123.
[2] Brown H.P., Panshin A.J., Forsaith C.C., Textbook of wood tech-
nology, McGraw-Hill, New York, 1949.
[3] Core H.A., Côté W.A., Day A.C., Wood structure and identification,
Syracuse University Press, New York, 1979.
[4] De Kort I., Loeffen V., Baas P., Ring width, density and wood
anatomy of Douglas-fir with different crown vitality, IAWA B. 12
(1991) 453–465.
[5] De Kort I., Relationships between sapwood amount, latewood
percentage, moisture-content and crown vitality of Douglas-fir,
Pseudotsuga-Menziesii, IAWA J. 14 (1993) 413–427.
[6] De Kort I., Wood production and latewood percentage of Douglas-
fir from different stands and vitality classes, Can. J. Forest. Res. 23
(1993) 1480–1486.
[7] Decoux V., Contribution à l’interprétation anatomique des mi-
crovariations de la densité du bois de Douglas, Ph.D. thesis,
Université Libre de Bruxelles, 2003.
[8] Decoux V., Varcin E., Leban J.M., Relationships between the intra-
ring wood density assessed by X-ray densitometry and optical
anatomical measurements in conifers. Consequences for the cell
wall apparent density determination, Ann. For. Sci. 61 (2004) 251–
262.
[9] Deleuze C., Houllier F., A simple process-based xylem growth
model for describing wood microdensitometric profiles, J. Theor.
Biol. 193 (1998) 99–113.
[10] Diaz-Vaz J.E., Echols R., Knigge W., Vergleichende Untersuchung
der Schwankungen von Tracheidendimensionen und röntgenop-
tisch ermittelter Rohdichte innerhalb des Jahrrings, Forst-Wiss.
Centralbl. 94 (1975) 161–175.
[11] Donaldson L.A., Lausberg M.J.F., Comparison of conventional
transmitted light and confocal microscopy for measuring wood cell
dimensions by image analysis, IAWA J. 19 (1998) 321–336.
[12] Elliott G.K., Brook S.E.G., Microphotometric technique for
growth-ring analysis, J. Inst. Wood Sci. 18 (1967) 24–43.
[13] Erickson H.D., Harrison A.T., Douglas-fir wood quality studies,
part I: effects of age and stimulated growth on wood density and
anatomy, Wood Sci. Technol. 8 (1974) 207–226.
[14] Fengel D., Stoll M., On the variation of the cell cross area, the thick-
ness of the cell wall and of the wall layers of sprucewood tracheids
within an annual ring, Holzforschung 27 (1973) 1–7.
[15] Fengel D., Wegener G., Wood: chemistry, ultrastructure, reactions,
Walter de Gruyter, Berlin, 1989.
[16] Ferrand J.C., Réflexion sur la densité du bois, 1
re
partie : définition
de la densité du bois, Holzforschung 36 (1982) 99–105.
[17] Gilmore A.R., Metcalf G.E., Boggess W.R., Specific gravity of
shortleaf pine and loblolly pine in southern Illinois, J. For. 59 (1959)
894–896.
[18] Guilley E., Herve J.C., Nepveu G., The influence of site quality,
silviculture and region on wood density mixed model in Quercus
petraea Liebl., For. Ecol. Manage. 189 (2004) 111–121.
[19] Hannrup B., Danell O., Ekberg I., Moell M., Relationships between
wood density and tracheid dimensions in Pinus sylvestris L., Wood
Fiber Sci. 33 (2001) 173–181.
[20] Heger L., Parker M.L., Kennedy R.W., X-ray densitometry: a tech-
nique and an example of application, Wood Sci. 7 (1974) 140–148.
[21] Ilic J., Hillis W.E., Video image processor for wood anatomical
quantification, Holzforschung 37 (1983) 47–50.
[22] Jayme G., Krause T., Über die Packungsdichte der Zellwände in
Laubhölzern, Holz als Roh- Werkst. 21 (1963) 14–19.
[23] Kibblewhite R.P., Bailey D.G., Measurement of fibre cross-section
dimensions using image analysis, APPITA 41 (1988) 297–303.
[24] Leclerq A., Relationships between beechwood anatomy and its
physico-mechanical properties, IAWA B. 1 (1980) 65–71.
[25] Lindström H., Fiber length, tracheid diameter, and latewood per-
centage in Norway spruce: Development from pith outwards, Wood
Fiber Sci. 29 (1997) 21–34.
[26] Mothe F., Duchanois G., Zannier B., Leban J.M.,
Microdensitometric analysis of wood samples: data computa-
tion method used at Inra-ERQB (CERD program), Ann. Sci. For.
55 (1998) 301–313.
[27] Mothe F., Sciama D., Leban J.M., Nepveu G., Localization of the
earlywood-latewood transition in oak rings using microdensitomet-
ric analysis, Ann. Sci. For. 55 (1998) 437–449.
[28] Panshin A.J., De Zeeuw C., Textbook of wood technology,
McGraw-Hill, New York, 1980.
[29] Park W.K., Development of the microtechniques for the image anal-
ysis of tree rings, J. Agr. Sci. 9 (1991) 16–21.
706 C.B.K. Rathgeber et al.
[30] Park Y. I., Dallaire G., Morin H., A method for multiple intra-ring
demarcation of coniferous trees, Ann. For. Sci. 63 (2006) 9–14.
[31] Polge H., Établissement des courbes de variation de la den-
sité du bois par exploration densitométrique de radiographies
d’échantillons prélevés à la tarière sur des arbres vivants –
Applications dans les domaines technologique et physiologique,
Ann. Sci. For. 23 (1966) 1–215.
[32] Polge H., Fifteen years of wood radiation densitometry, Wood Sci.
Technol. 12 (1978) 187–196.
[33] SAS Institute Inc., SAS OnlineDoc
, Version 8, Cary, NC, 1999.
[34] Schweingruber F.H., Microscopic Wood Anatomy, Swiss Federal
Institute for Forest, Snow and Landscape Research, 1990.
[35] Smith D.M., Rapid measurement of tracheid cross-sectional dimen-
sions of conifers, For. Prod. J. 15 (1965) 325–334.
[36] Tsoumis G., Microscopic measurement of the amount of cell wall
substance in wood and its relationship to specific gravity, TAPPI J.
47 (1964) 675–677.
[37] Vonnet G., Perrin J.R., Ferrand J C., Réflexions sur la Densité
du Bois. 4
e
partie: densité et hétérogénéité du bois de Douglas,
Holzforschung 39 (1985) 273–279.
[38] Wang L., Payette S., Begin Y., Relationships between anatomical
and densitometric characteristics of black spruce and summer tem-
perature at tree line in northern Quebec, Can. J. For. Res. 32 (2002)
477–486.
[39] Wimmer R., Intraannual cellular characteristics and their implica-
tions for modeling softwood density, Wood Fiber Sci. 27 (1995)
413–420.
[40] Zhang S.Y., Zhong Y., Structure-property relationship of wood in
East-Liaoning oak, Wood Sci. Technol. 26 (1992) 139–149.
[41] Zhang S.Y., Eyeno R., Nepveu G., Mothe F., Dhôte J F., Modelling
wood density in European oak (Quercus petraea and Quercus
robur) and simulating the sivicultural influence, Can. J. For. Res.
23 (1993) 2587–2593.
[42] Zobel B.J., Van Buijtenen J.P., Wood variations – Its causes and
control, Springer-Verlag, Berlin, 1989.
To access this journal online:
www.edpsciences.org/forest