Báo cáo lâm nghiệp: "Genetic variability and divergence among Italian populations of common ash (Fraxinus excelsior L.)" ppt
Bạn đang xem bản rút gọn của tài liệu. Xem và tải ngay bản đầy đủ của tài liệu tại đây (473.6 KB, 10 trang )
Ann. For. Sci. 64 (2007) 159–168 159
c
INRA, EDP Sciences, 2007
DOI: 10.1051/forest:2006100
Original article
Genetic variability and divergence among Italian populations
of common ash (Fraxinus excelsior L.)
Diana F, Ignazio M,PieroB
*
University of Turin, DIVAPRA Plant Genetics and Breeding, via Leonardo da Vinci 44, 10095 Grugliasco, Italy
(Received 4 April 2006; accepted 6 July 2006)
Abstract – The level of genetic variation throughout the Italian range of common ash (Fraxinus excelsior L.) was estimated using six microsatellite
markers. High levels of allelic diversity was detected. The levels of expected heterozygosity for each of the populations ranged from 0.726 to 0.871, with
an average of 0.798, and indicated that populations have a high level of genetic variation. A general and significant homozygote excess was found at
most loci in all populations, with an overall mean F
IS
of 0.284. Possible explanations for such situations are discussed. Only 4.9% of the total diversity
was attributable to differentiation among populations. Although divergence among pedo-climatic regions explained only a small part of the variance it
was possible to observe some partial clustering of populations belonging to the same regions. The contribution of the results in relation to the definition
of the most appropriate strategies to collect forest reproductive material is discussed.
genetic variation / microsatellite / population differentiation / seed zone designation / Fraxinus excelsior
Résumé – Variabilité génétique et différenciation entre populations italiennes de frêne commun (F raxinus excelsior L.). Le niveau de variation
génétique dans l’aire de distribution naturelle du frêne commun (F raxinus e xcelsior L.) en Italie a été estimé à l’aide de six marqueurs microsatellite.
Des niveaux élevés de diversité allélique ont été détectés. L’hétérozygotie théorique varie de 0,726 à 0,871, avec une moyenne de 0,798, ce qui indique
que les populations ont un niveau élevé de variation génétique. Un excès général et significatif de l’homozygotie a été trouvé pour la plupart des loci
dans toutes les populations, avec une moyenne globale F
IS
de 0,284. Des explications possibles pour de telles situations sont proposées. Seulement
4,9 % de toute la diversité est attribuable à la différenciation entre populations. Bien que la divergence entre régions pédo-climatiques explique une
petite partie de la variation, il est possible d’observer des regroupements partiels de populations appartenant aux mêmes régions. La contribution de ces
résultats à la définition des stratégies les plus appropriées pour rassembler le matériel forestier de reproduction est discutée.
diversité génétique / microsatellite / différenciation entre populations / région de provenance / Fraxinus excelsior
1. INTRODUCTION
Forest trees are non-mobile and long-lived organisms which
grow under environmental conditions that are heterogeneous
in time and space. Moreover, they are exposed to many stress
factors, most of which are due to human activities: pollu-
tion, climate change, habitat fragmentation. In order to survive
these threats, and to persist over time, a high adaptive potential
is needed: this is mainly determined by the within-species ge-
netic diversity [4, 46]. Programmes aimed at the conservation
of forest genetic resources should address the issue of main-
tenance of this diversity [21, 31, 35, 47]. To this end, knowl-
edge of genetic variation, as well as information on mating
system and pollen and seed dispersal, are of the utmost im-
portance. Molecular markers are now available and can pro-
vide us with the relevant means to acquire information on the
genetic structure of populations and to study the pattern of dis-
tribution of within-species variability. In particular, simple se-
quence repeats (SSRs, also known as microsatellites) are com-
monly used in genetic studies of plant populations. SSRs are
tandem repeats of short DNA sequences (1 to 6 base pairs);
they are highly polymorphic, widely distributed throughout
* Corresponding author:
the genome and codominant. Allelic variation can be detected
quickly by the DNA-polymerase chain reaction (PCR) tech-
nique.
Common ash, Fraxinus excelsior L., is a postpioneer helio-
philous tree species which grows in mixed deciduous forests
all over Europe, from the Atlantic Ocean to the Don river and
the Caucasian mountains, and from the southern part of Scan-
dinavia to the Mediterranean Sea. It is a colonizing species,
often found with a spatially discontinuous distribution in mix-
tures with other trees. However, when ecological conditions
become very favourable it can be encountered in pure stands.
The species has a complex mating system, showing variation
in sex expression from pure male to pure female individuals,
and with all kinds of hermaphroditic intermediates [17,29,37].
Pollen and fruits (samaras) are wind-dispersed. According to
fossil pollen data obtained by Huntley and Birks [26], the
species expanded in the Early Holocene from the northern
Apennine and from the northern and north-western Black Sea
coasts. Heuertz et al. [24] also suggested the eastern Alps and
Iberian Peninsula as further refuge areas.
A number of research groups have recently undertaken
studies on this species all over Europe [1, 5, 6, 10, 22,
23, 25, 27, 29], and several European Union projects have
Article published by EDP Sciences and available at or />160 D. Ferrazzini et al.
been devoted to the ash species native to Europe, among
which FRAXIGEN (Defining European Ash Populations
for Conservation and Regeneration [17]) and RAP (Im-
proving Ash Productivity for European needs by testing,
propagation and promotion of improved genetic resources
[ The
biological features, for instance colonizing behaviour, spatial
distribution and mating system of Fraxinus species make them
models of great interest for population genetics studies.
Forestry management of common ash in Europe has shown
increased interest in the last decades, mainly due to the
recognition of its high economic value as quality timber
producer [38]. The species is usually propagated through natu-
ral regeneration. Sometimes, however, afforestation and refor-
estation programmes are carried out using reproductive mate-
rial produced in nursery. In these cases, the genetic quality of
the used material is of utmost importance, both to guarantee a
good chance of success for afforestation and also to preserve
the natural genetic variability of the species [31]. Forests from
southern Europe constitute highly valuable genetic resources
of noble hardwood, among which are Fraxinus spp. [11]. The
most appropriate strategy to preserve the genetic resources of
these species is the establishment of in situ reservoirs, within
the frame of forestry management.
The Italian Government has recently issued act
No. 386/2003, that implements the European Council
Directive 1999/105/CE, concerning the marketing of forest
reproductive material. One of the most important feature of
the act is the definition of Region of Provenance as “ the
area or group of areas subjected to sufficiently uniform
ecological conditions in which stands or seed sources showing
similar phenotypic or genetic characters are found ”. The
identification of these areas plays a basic role for a rational
management of activities linked with forest trees propagation,
including afforestation and in situ genetic preservation.
In this study we defined the structure of genetic variation
throughout the distribution of common ash in Italy. Genetic
differentiation was estimated for three different geographical
scales (between individuals within populations; between pop-
ulations within pedo-climatic regions, and between regions)
using six nuclear microsatellite loci. Further objectives were
to evaluate whether the distribution of genetic variability is
influenced by pedo-climatic characteristics of the area where
populations grow, and to find out the biological characteristics
useful for conservation management, such as the level of in-
breeding. This information is of basic importance for the def-
inition of Italian Regions of Provenance for common ash, al-
though a deeper knowledge of the ecological characteristics
of the areas of the study, such as vegetational and phytogeo-
graphical data, is also needed.
2. MATERIALS AND METHODS
2.1. Ecological data
Pedo-climatic characteristics of the study area were inferred from
existing cartography, namely the Soil Regions of Europe developed
by the European Commission [12]. This document reports the climate
types that are present in Europe according to the CLIMWAT database,
and joins regions according to their climate, geology and pedology
characteristics.
2.2. Plant material
Thirty-one natural populations of Fraxinus excelsior were chosen
within the natural area of diffusion of the species in Italy (northern
part of the country). All the populations belong to mixed forests, in
which common ash is never the dominant species, although a certain
variation among stands according to ecological conditions could be
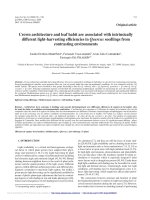
detected (Tab. I and Fig. 1). In some stands (namely the ones located
at the eastern part of the area under study) we also detected the pres-
ence of Fraxinus angustifolia. This is a species closely related with
common ash, and the occurrence of interspecific hybrids has been
documented [17]. To avoid sampling F. angustifolia and/or hybrids,
we collected only terminal buds black in colour and with flattened
nodes forming a “snake-head”. The period of sampling (winter or
early spring) precluded using more valid criteria of species differen-
tiation, such as gender of inflorescence and fructification type [17].
Furthermore, we did not sample common ash individuals in prox-
imity of F. angustifolia plants. For purposes of the analysis the 31
populations were divided into groups that reflect natural structuring:
the most natural way of objectively structuring populations was to
follow the subdivision of the area in pedo-climatic regions, according
to the data from European Commission [12]. Buds or young leaves
were sampled from about 30 non-adjacent trees in each population,
randomly chosen over a 5 to 10 ha area. After collection, buds and
young leaves were frozen at –20
◦
C until DNA extraction.
2.3. Microsatellite analysis
Total DNA was extracted from about 100 mg frozen leaves or
2–3 buds using Lefort-Douglas method [27]. Six primers pairs of
microsatellite loci, which had previously been shown to display
easy to read band patterns and a high degree of polymorphism
in Fraxinus excelsior, were used for the polymerase chain reac-
tions [6,22, 27,29]: FEMSATL4, FEMSATL10, FEMSATL11, FEM-
SATL12, FEMSATL16, FEMSATL19.
The PCR reactions were performed in a mix containing 2.5 mM
MgCl
2
, 1 unit of Taq polymerase (Promega) in 1X Promega buffer,
0.2 µM of each primer, 0.2 mM of dNTP mix and approximately
20 ng of template DNA, adding deionised water to a total reaction
volume of 20 µl. After an initial denaturing step at 95
◦
Cfor4min,
amplification comprised 35 cycles of 1 min at 94
◦
C, 1 min at ei-
ther 52
◦
C (FEMSATL4, FEMSATL11, FEMSATL12, FEMSATL16,
FEMSATL19) or 55
◦
C (FEMSATL10) and 2 min at 72
◦
C. Final
elongation lasted 10 min at 72
◦
C. PCR reactions were performed on
a Perkin Elmer GeneAmp
PCR System 9600 thermocycler. The for-
ward sequence of each primer pair was labelled with a fluorescent dye
(M-Medical S.r.l. and MWG-Biotech AG) at its 5’end: IRD 800 for
FEMSATL4, FEMSATL11 and FEMSATL16 and IRD 700 for FEM-
SATL10, FEMSATL12 and FEMSATL19. Electrophoresis and detec-
tion of PCR products were carried on a denaturing polyacryalmide
gel (6%) using a sequencer (model DNA 4200 Sequencer LI-COR
Biotechnology). Gels were run for 2 h at 2000 V in TBE 1X buffer.
Determination of polymorphism was obtained using a marked stan-
dard of known molecular weight (50–350 bp). Data were collected by
e-Seq software (DNA Sequencing and Analysis Software).
Genetic variability in common ash 161
Table I. Details of site and stand characteristics of common ash populations from Italy which were sampled for the study. Soil Region: 34.3 =
Leptosol (parent material association: calcareous sedimentary rocks), 37.1 = Leptosol – Podzol – Cambisol (igneous and metamorphic rocks),
59.7 = Cambisol – Leptosol (Mesozoic sedimentary rocks), 60.4 = Cambisol – Luvisol (Mesozoic sedimentary rocks), 61.1 = Cambisol –
Regosol (tertiary sedimentary rocks), 70.1 = Luvisol – Cambisol – Gleysol (glacial deposits). Climate: 33 = sub-oceanic temperate, 37 =
sub-continental hot-temperate, 38 = mountain temperate (European Commission, 1999).
Population Region Location Elevation Type of stand Proportion of common Soil region Climate
(m a.s.l.) ash in the canopy
1. Lame del Sesia Piedmont 45˚ 26’ N, 8˚ 23’ E 150 Mixed plan forest 30 70.1 33
2. Partecipanza Piedmont 45˚ 14’ N, 8˚ 20’ E 150 Oak and hornbeam forest 20 70.1 33
3. Spazzacamini Piedmont 45˚ 46’ N, 8˚ 16’ E 300 Oak and hornbeam forest 30 70.1 33
4. Merlino Piedmont 44˚ 47’ N, 7˚ 44’ E 250 Oak and hornbeam forest 15 70.1 33
5. Pian delle Gorre Piedmont 44˚ 19’ N, 7˚ 41’ E 1000 Mixed mountain forest 40 60.4 38
6. Oncino Piedmont 44˚ 41’ N, 7˚ 11’ E 1300 Beech forest 45 37.1 38
7. Valle Divedro Piedmont 46˚ 16’ N, 8˚ 19’ E 800 Mixed mountain forest 40 37.1 38
8. Valle Bormida Liguria 44˚ 24’ N, 8˚ 16’ E 400 Chestnut forest 10 60.4 38
9. Valle Tanaro Liguria 44˚ 05’ N, 7˚ 48’ E 750 Mixed broadleaves mountain forest 30 60.4 38
10. Archesane Lombardy 45˚ 39’ N, 10˚ 37’ E 1000 Beech forest 40 34.3 38
11. Ponteranica Lombardy 45˚ 44’ N, 9˚ 39’ E 450 Mixed broadleaves forest 25 34.3 38
12. S. Pellegrino Lombardy 45˚ 50’ N, 9˚ 40’ E 500 Maple and ash forest 50 34.3 38
13. Val Masino Lombardy 46˚ 13’ N, 9˚ 38’ E 950 Mixed mountain forest 20 37.1 38
14. Corni di Canzo Lombardy 45˚ 51’ N, 9˚ 16’ E 750 Beech forest 25 34.3 38
15. Valle Sella Trentino 46˚ 03’ N, 11˚ 27’ E 1000 Mixed mountain forest 20 37.1 38
16. Valle Mocheni Trentino 46˚ 04’ N, 11˚ 14’ E 1050 Mixed mountain forest 10 37.1 38
17. Contrada Sorto Venetia 45˚ 39’ N, 11˚ 18’ E 750 Maple, ash, hornbeam forest 25 34.3 38
18. Broz Venetia 46˚ 08’ N, 12˚ 25’ E 1000 Spruce forest 15 34.3 38
19. Sedico Venetia 46˚ 07’ N, 12˚ 06’ E 400 Mixed broadleaves forest 30 34.3 38
20. Peaio Venetia 46˚ 25’ N, 12˚ 15’ E 1000 Spruce forest 20 34.3 38
21. Schivazzi Venetia 45˚ 36’ N, 11˚ 06’ E 1100 Beech forest 25 34.3 38
22. Fagarè Venetia 45˚ 50’ N, 11˚ 55’ E 250 Oak and hornbeam forest 15 34.3 38
23. Chianei Friuli 46˚ 17’ N, 13˚ 05’ E 800 Mixed broadleaves forest 35 34.3 38
24. Ponte Vittorio Friuli 46˚ 15’ N, 13˚ 30’ E 800 Beech forest 15 34.3 38
25. Preone Friuli 46˚ 24’ N, 12˚ 52’ E 500 Beech forest 25 34.3 38
26. Alta val Ceno Emilia 44˚ 30’ N, 9˚ 38’ E 650 Mixed broadleaves and spruce forest 15 59.7 37
27. Monte Valoria Emilia 44˚ 31’ N, 9˚ 59’ E 900 Beech forest 20 59.7 37
28. Valle Reno Emilia 44˚ 10’ N, 10˚ 59’ E 800 Beech forest 25 59.7 37
29. S.Anna Pelago Emilia 44˚ 12’ N, 10˚ 35’ E 1000 Beech and spruce forest 20 59.7 37
30. Campigna Emilia 43˚ 57’ N, 11˚ 54 E 1100 Mixed broadleaves forest 10 61.1 37
31. Abetone Tuscany 44˚ 09’ N, 10˚ 40’ E 1300 Beech forest 30 59.7 37
2.4. Data analysis
Population genetic parameters were estimated using the Genepop
3.4 software (an updated version of Genepop 1.2 described by Ray-
mond and Rousset [39]). The following statistics of genetic variation
within populations were computed as average over loci: mean number
of alleles per locus (N), average observed heterozygosity (H
o
)andav-
erage gene diversity (H
e
, according to Nei [33]). Average allelic rich-
ness (R), a measure independent of the sample size, was estimated
using the program Fstat version 2.9.3 [19]. Genepop was used for
testing per locus and per population deviations from Hardy-Weinberg
expectations, while Fisher exact test and confidence intervals based
on the Markov chain method evaluated the statistical significance of
the results [20]. Where significant deficiencies of heterozygotes from
Hardy-Weinberg expectations were found, the presence of a relatively
high frequency of null alleles was suspected [36], and in this case the
allele frequencies were adjusted following the correction proposed by
Brookfield [7], using the software Micro-checker [48]. Differences
between uncorrected and corrected allelic frequencies were assessed
by an exact probability test, using SPSS program version 12.0 [45].
Linkage disequilibrium for each pair of loci across all populations
was tested with the Fisher exact test and the sequential Bonferroni
correction [42].
The population genetic structure of the overall samples was anal-
ysed for each locus with Wright’s F-statistics [51,52], computed with
162 D. Ferrazzini et al.
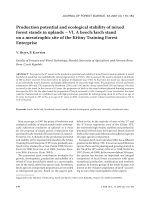
Figure 1. Geographical distribution of the 31 populations of common ash analysed in the study.
Weir and Cockerham [50] method and using the Fstat program. The
analysis of molecular variance (AMOVA) [13] was performed to fur-
ther study the genetic structure of populations using the Arlequin
package version 3.0 [14]. The total molecular variance was parti-
tioned into components due to differences among populations within
pedo-climatic regions, among regions and within populations. The
variance components and F inbreeding indices were tested statisti-
cally by non-parametric randomization tests using 10 000 permuta-
tions. Genetic differentiation between populations was estimated us-
ing pairwise F
ST
values given in form of a matrix, since pairwise F
ST
can be used as a short-term genetic distance between populations [40,
44]. The null distribution of pairwise F
ST
values under the hypothesis
of no difference between the populations was tested by a permutation
test of 10 000 replicates. The genetic distance matrix [32] was com-
puted with software Gendist of Phylip package version 3.6 [16], and
the data obtained were used to construct the UPGMA (Unweighted
Pair-Group Method using Arithmetic means) dendrogram, with the
software Neighbor of the above mentioned package. The cophenetic
values matrix was calculated from the tree matrix using the program
Coph of Ntsys-pc version 2.1 [41]. The cophenetic matrix was used
to evaluate goodness of fit for the cluster analysis by comparing it to
genetic distances matrix (Mxcomp of Ntsys).
Isolation by distance among populations was assessed by comput-
ing F
ST
/(1-F
ST
) ratios for each population pair using Genepop 3.4. A
Mantel test [28] on the matrix of pairwise F
ST
/(1-F
ST
) ratios and that
of the logarithm of geographical distances (natural logarithm-scale)
was performed to test isolation by distance adopting 1 000 permuta-
tions.
3. RESULTS
3.1. Definition of pedo-climatic regions
The area where material was sampled was divided in re-
gions that are homogeneous as regards as their geological,
pedological and climatic characteristics. It was possible to de-
fine the following 5 regions:
– Po Valley (populations 1, 2, 3, 4);
– Ligurian Mountains (populations 5, 8, 9);
– Alps with crystalline soil (populations 6, 7, 13, 15, 16);
– Alps with calcareous soil (populations 10, 11, 12, 14, 17,
18, 19, 20, 21, 22, 23, 24, 25);
– Apennines (populations 26, 27, 28, 29, 30, 31).
Population No. 30 (Campigna) was joined to the Apen-
nine region, even though it is characterized by a Cambisol –
Regosol peculiar soil type with tertiary sedimentary rocks as
parent material association. However, since it is the only rep-
resentative of such a soil region it seemed appropriate to con-
sider the Campigna stand together with the Apennine popula-
tions with which shares the climate type and the geographical
localisation.
3.2. Allelic diversity of microsatellite loci
The total number of alleles at each locus and the size ranges
of the PCR products corresponding to these alleles, are given
in Table II; the data are compared with results reported in pre-
vious studies in France and Bulgaria. All six microsatellite loci
employed in this study were highly polymorphic, displaying a
high number of alleles (from 9 to 76 alleles per locus). The
total number of alleles scored in 930 individuals over all loci
was 253.
It was possible to detect 33 unique alleles, i.e. present only
in one population. The frequency of these alleles was always
very low, ranging from 0.033 to 0.111. The distribution of
unique alleles among microsatellites was unbiased, ranging
from one (FEMSATL16) to eleven (FEMSATL19). The pop-
ulations which displayed the highest number of such alleles
were Lame del Sesia (5 private alleles) and Spazzacamini (3
private alleles), both belonging to the pedo-climatic region of
Po Valley.
Genetic variability in common ash 163
Table II. Allelic diversity of the microsatellite loci scored in the present work, compared with French and Bulgarian results (number of alleles);
n, not scored.
Microsatellite This study France
(Morand et al., 2002)
Bulgaria
(Heuertz et al., 2001)
Molecular weight (range in bp) Number of alleles
FEMSATL04 157–205 32 37 50
FEMSATL10 143–338 76 n n
FEMSATL11 161–234 42 40 32
FEMSATL12 147–261 39 n 18
FEMSATL16 184–214 9 n 10
FEMSATL19 142–238 55 36 33
Table III. Statistics of genetic variation within common ash popula-
tions at six microsatellite loci. N, mean number of alleles per locus;
R, allelic richness average; H
o
, average observed heterozygosity; H
e
average gene diversity; F
IS
average inbreeding coefficient. All given
F
IS
values were highly significant (P < 0.001).
Population NR H
o
H
e
F
IS
1. Lame del Sesia 14.5 10.64 0.516 0.778 0.337
2. Partecipanza 11.8 8.77 0.588 0.761 0.227
3. Spazzacamini 12.8 10.00 0.626 0.812 0.229
4. Merlino 11.5 9.33 0.531 0.752 0.294
5. Pian delle Gorre 12.7 9.58 0.525 0.834 0.371
6. Oncino 13.7 9.77 0.568 0.813 0.301
7. Valle Divedro 11.5 9.19 0.593 0.784 0.243
8. Valle Bormida 9.0 7.99 0.580 0.752 0.229
9. Valle Tanaro 13.7 10.09 0.669 0.825 0.188
10. Archesane 10.0 7.98 0.582 0.793 0.266
11. Ponteranica 11.5 8.15 0.587 0.770 0.237
12. S. Pellegrino 12.8 9.87 0.513 0.830 0.382
13. Val Masino 10.0 8.20 0.459 0.748 0.387
14. Corni di Canzo 14.5 10.66 0.584 0.841 0.305
15. Valle Sella 13.3 9.83 0.500 0.830 0.397
16. Valle dei Mocheni 11.7 9.16 0.615 0.832 0.261
17. Contrada Sorto 14.0 10.34 0.569 0.871 0.347
18. Broz 13.3 10.29 0.531 0.831 0.361
19. Sedico 11.7 8.86 0.586 0.811 0.277
20. Peaio 12.5 8.33 0.597 0.736 0.189
21. Schivazzi 13.5 9.96 0.508 0.798 0.363
22. Fagarè 14.3 10.50 0.640 0.837 0.235
23. Chianei 14.5 10.46 0.646 0.854 0.244
24. Ponte Vittorio 12.3 9.72 0.598 0.838 0.286
25. Preone 12.2 9.11 0.656 0.846 0.225
26. Alta val Ceno 9.7 7.68 0.618 0.802 0.230
27. Monte Valoria 14.0 9.13 0.488 0.726 0.328
28. Valle Reno 10.0 8.29 0.577 0.740 0.220
29. S.Anna Pelago 13.0 9.47 0.594 0.759 0.217
30. Campigna 11.8 9.01 0.512 0.815 0.372
31. Abetone 10.5 8.09 0.546 0.727 0.249
Overall mean 12.3 9.30 0.571 0.798 0.284
(standard deviation) (1.6) (0.89) (0.052) (0.041) (0.064)
3.3. Genetic variation within populations
Statistics on the genetic diversity within populations are
shown in Table III. High polymorphism was found within pop-
ulations, since on average more than 12 alleles were observed
per locus (N = 12.3). The highest value was found in Lame
del Sesia, Corni di Canzo and Chianei (14.5) and the lowest
in Valle Bormida (9.0). Allelic richness R ranged from 7.68
(Alta val Ceno) to 10.66 (Corni di Canzo), with a mean of
9.30. Apennine populations in general showed lower values of
genetic diversity, although the differences between the mean
values of pedo-climatic regions were not statistically signifi-
cant (data not shown).
The probability that two randomly sampled alleles in a
given population were different was close to 80% (H
e
=
0.798). The observed heterozygosity (H
o
= 0.571) was much
lower than the expected heterozygosity (H
e
) indicating a sig-
nificant positive mean inbreeding coefficient. Significant de-
partures from Hardy-Weinberg equilibrium were observed at
most loci in all populations, detecting a significant homozy-
gote excess (F
IS
ranging from 0.188, Valle Tanaro, to 0.397,
Valle Sella, with a mean of 0.284). Among the possible fac-
tors that may account for the excess of homozygotes is the
presence of null alleles, which may lead to biased estimates of
genetic variation and differentiation based on allele frequen-
cies. Allele frequency distribution adjusted after the Brook-
field correction was not significantly different (P < 0.001)
from the uncorrected distribution for the six loci considered.
The average estimated frequency of null alleles was 0.14, and
ranged from 0.05 (FEMSATL19) to 0.25 (FEMSATL12).
Inaccurate results may also be generated by linkage dise-
quilibrium. In our study however no significant linkage dise-
quilibrium was detected between different genotypes at any of
the different loci.
3.4. Genetic differentiation among populations
and regions
Population structure was analysed by calculating the fol-
lowing inbreeding indices: F
IT
, which represents the overall
fixation index; F
IS
, which represents the fixation index due to
non-random mating within populations; and F
ST
, which rep-
resents the fixation index due to population subdivision. F-
statistic estimates calculated per populations and per locus,
164 D. Ferrazzini et al.
Table IV. F statistics of genetic diversity and differentiation among
31 populations of common ash from Italy at six microsatellite loci.
F
IT
, overall inbreeding; F
IS
, average inbreeding coefficient; F
ST
dif-
ferentiation among populations.
Locus F
IT
F
IS
F
ST
FEMSATL04 0.304 0.274 0.041
FEMSATL10 0.367 0.332 0.053
FEMSATL11 0.339 0.312 0.040
FEMSATL12 0.519 0.481 0.073
FEMSATL16 0.240 0.191 0.060
FEMSATL19 0.107 0.078 0.031
Multilocus estimates 0.321 0.286 0.049
Permutation test P < 0.001 P < 0.001 P < 0.001
Table V. Analysis of molecular variance (AMOVA) within and
among the populations joined according to pedo-climatic regions.
Source of variation df Sum Variance Percentage
of squares components of variation P
Among regions 4 33.535 0.011 0.61 < 0.001
Among populations 26 138.959 0.069 3.76 < 0.001
within regions
Within populations 1 443 2 528.853 1.759 95.63 < 0.001
Total 1 473 2 701.347 1.839 100.00 –
according to Weir and Cockerham’s [50], are reported in Ta-
ble IV. The F
IS
values provided evidence that inbreeding oc-
curs within populations, ranging from 0.078 (FEMSATL19) to
0.481 (FEMSATL12), with a mean value of 0.286 (P < 0.001).
The total inbreeding estimate (F
IT
) showed a significant deficit
of heterozygotes (P < 0.001) for all loci, ranging from 0.107
(FEMSATL19) to 0.519 (FEMSATL12), with a mean value
of 0.321. Most of genetic diversity was found within popula-
tions, while only a small amount of the variability occurred
among populations (F
ST
= 0.049, P < 0.001). The F
ST
values
per locus ranged from 0.031 (FEMSATL19) to 0.073 (FEM-
SATL12), and all F
ST
estimates were significantly different
from zero.
The analysis of molecular variance (AMOVA) revealed that
0.61% of the genetic variation was found among pedo-climatic
regions, whereas 3.76% was due to differences among popu-
lations within regions and 95.63% was detected within popu-
lations (Tab. V). All the different statistics were significant for
the null hypothesis of no differentiation after 10 000 random
permutations.
The genetic divergence between populations was further in-
vestigated by computing a pairwise F
ST
matrix. Multilocus
F
ST
values varied between 0.001 (Fagarè and Spazzacamini)
and 0.104 (Campigna and Valle Tanaro) (data not shown). Al-
most all pairwise F
ST
values were significantly greater than
zero, confirming the presence of a slight, although significant,
amount of population structuring in Italian common ash pop-
ulations.
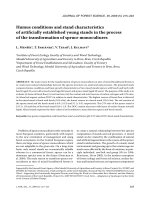
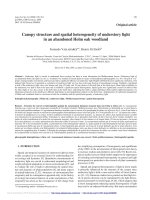
The UPGMA dendrogram (Fig. 2) confirmed the presence
of differentiation between populations as well as a certain de-
gree of structuring. The cophenetic correlation coefficient gave
a value of r = 0.807 (P < 0.001), suggesting the goodness of
fit for the cluster analysis. In particular, populations from Lig-
urian Mountain, and the majority of those belonging to Po Val-
ley and Apennines showed a clear tendency to group together.
Exceptions are represented by populations 3 for Po Valley and
30 for Apennine. On the other hand, no clear structure was
observed for populations from the two regions in which the
Alpine area was divided according to soil characteristics.
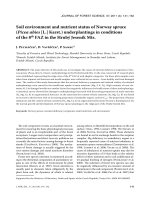
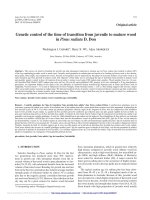
The correlation between genetic diversity, expressed as
F
ST
/(1 – F
ST
) ratio for pairs of populations, and the logarithm
of distances expressed in units of 5 km, did not show the typ-
ical pattern of isolation by distance and did not suggest any
evidence of a relationship between the two factors (Fig. 3).
4. DISCUSSION
The principal aim of this study was to assess the level and
the distribution of genetic variation of common ash in Italy,
in order to get essential knowledge for planning activities in
the fields of plant propagation and the conservation of ge-
netic resources. Species such as common ash that do not have
strong habitat specificity and are continuously distributed are
expected to have more within-populations diversity than those
with strong habitat preference and a scattered distribution. The
level of variation is also associated with the dispersion of
pollen by wind.
Genetic diversity assessed with microsatellite markers in
our sample of populations of Fraxinus excelsior from Italy
was considerable: the observed number of alleles per locus
ranged from 9 to 76 (average per population 12.3), and the
average gene diversity (H
e
) was as high as 0.840. These val-
ues are comparable with those of an analogous study carried
on 10 common ash populations in Bulgaria, where 12.4 alleles
per locus were scored and H
e
was 0.731 [22]. The similar-
ity of genetic variability levels between Italian and Bulgarian
populations is remarkable, and palaeontological data support
the hypothesis that southeastern Europe has been an impor-
tant refuge for plant species, including common ash, during
the Quaternary glacial period [9,34, 49]. In this region species
are therefore expected to preserve high level of intraspecific
biodiversity. Italian populations thus appear to constitute an
important gene reservoir, not limited to the Apennine region
(another possible refuge area), where indeed the level of ge-
netic variation is slightly lower than in other areas. Our results
support the hypothesis of Heuertz et al. [24] concerning the
possibility that other Italian areas (for instance eastern Alps)
were also important refuges for common ash during the Qua-
ternary glacial periods.
Populations of common ash from Italy are strongly inbred
(F
IT
= 0.321 and F
IS
= 0.284). This result is in agree-
ment with that reported by Morand et al. [29] for 12 French
populations analysed at five microsatellite loci. The study on
Bulgarian populations also detected a significant excess of
homozygotes, although at a lower level (F
IS
= 0.014) [22].
Genetic variability in common ash 165
Figure 2. UPGMA dendrogram based on genetic distances between populations. Dotted lines group populations from the same pedo-climatic
region (A, Po valley; B, Ligurian Mountains; C, Apennines). All populations outside the circles belong to the two pedo-climatic regions of
Alps, with the exception of population 3 (Po Valley) and 30 (Apennines).
The deficiency of heterozygotes, as indicated by positive val-
ues of inbreeding coefficient, could be due to many factors,
among which is the artificial reintroduction of genotypes ob-
tained from seeds produced by a limited number of parental
individuals in nurseries. We can exclude this hypothesis how-
ever, since all the populations considered in the study are nat-
ural and no afforestation of common ash occurred in the past.
In forest species in general the level of heterozygosity tends
to increase in mature age classes due to selection against ho-
mozygotes [3, 15, 43, 53]. In a previous study on ash popula-
tions from northwestern Italy, we found that homozygosity, es-
timated through allozyme markers, does indeed decrease with
the age of populations [2]. Morand et al. [29] confirmed the
excess of homozygosites, although the mean inbreeding co-
efficient showed a different pattern and increased from seed
(0.163) to adult tree (0.292) stages. Furthermore these authors
did not observe any inbreeding depression. Additional stud-
ies are needed to better clarify if the peculiar mating system
of common ash induces genetic characteristics of the popula-
tions different from the majority of other forest species. An-
other probable explanation for the excess of homozygotes is
the presence of null alleles, which are common in microsatel-
lite markers [8]. On the other hand, Morand et al. [29] and
Morand-Prieur et al. [30] carried out test crosses and obtained
the expected Mendelian segregations for some of the loci used
in our study (FEMSATL04, FEMSATL11 and FEMSATL19),
thereby excluding the presence of null alleles. We also have to
bear in mind that FEMSATL12 is likely to generate null alle-
les, as already suggested by Heuertz et al. [22] who found a
very high estimate of inbreeding coefficient (F
IS
= 0.697) and
the lack of successful amplification in a large proportion of
individuals (up to 35%). The question of null alleles of FEM-
SATL12 could well be answered using different primers, as
recently suggested by Gérard et al. [18]. Heuertz et al. [25]
also indicated the presence of null alleles in FEMSATL16, al-
though no unreliable amplification reactions were observed.
For FEMSATL10 no data have been found in the literature.
We did however find about 18% of individuals lacking am-
plification, and it therefore seems appropriate to hypothesize
the presence of null alleles, although only the establishment
of a test cross could give definitive confirmation. At any rate,
FEMSATL10 showed the highest frequency of hypothetical
null homozygotes, the data of other markers ranging from 0.10
(FEMSATL04) to 0.16 (FEMSATL12). Differences between
observed allelic frequencies and those corrected according to
Brookfield [7] were not significant, suggesting that the pos-
sible presence of null alleles does not bias the estimates of
population genetic parameters. It is also possible to assume
the presence of a Wahlund effect, that is the structuring of the
populations in subunits within which mating is more probable.
This does not seem to be the case of our populations, since we
collected material from plants usually at a distance of about
166 D. Ferrazzini et al.
Figure 3. Graph of isolation by distance among populations assessed
on the matrix of pairwise F
ST
/(1–F
ST
) ratios and the logarithm of
geographical distances.
50 m from one another, and this should exclude the presence of
any significant substructure. A further possible explanation of
the excess of homozygotes is self-fertilization and biparental
inbreeding, i.e. mating between related individuals. This ap-
pears to be unlikely in a species characterised by a such high
degree of dioecy as common ash: however self-fertilisation has
been observed in controlled crosses performed in France [30]
as well as in Sweden and UK [17]. In the latter experiment
however selfed seeds showed clear symptoms of inbreeding
depression, which makes the survival of such seeds in natural
conditions highly unlikely.
In the production of reproductive material, the level of in-
breeding appears to be of utmost importance, since heterozy-
gotes are in fact more resistant to environmental stresses [31,
46]. Therefore, in the choice of stands to be used for high qual-
ity seed production the homozygosity level should be taken
into consideration, in order to avoid the negative effect of in-
breeding on seed quality.
The overall pattern of genetic divergence among the pop-
ulations studied reflects a story of short-term separation and
consistent gene flow. Low levels of genetic differentiation are
typical of species such as common ash and other forest trees,
characterised by wide and relatively regular distribution, wide
pollen dispersion and a high rate of outcrossing. Our popula-
tions thus share a single gene pool, and there is no evidence
of any barriers likely to restrict gene flow between them. It
should also be kept in mind that the last glacial period, and
the consequent reinvasion of plants, occurred about 10 000
years ago, a period too short to allow environmental selection
and genetic drift to cause significant population divergence.
Our F
ST
value (0.049) is lower than that found in the Bul-
garian study (0.087) [22], where differentiation between re-
gions was also slightly higher than ours (F
RT
= 0.018, that
is about 21% of total genetic diversity). Regions from Bul-
garia however are geographically more separated than ours,
and this could explain the higher genetic divergence between
them. Further confirmation comes from the pattern of isolation
by distance, that was significant in the Bulgarian study but not
in ours. This result is not surprising, due to the peculiar charac-
teristics of the area investigated. Pedo-climatic regions have in
most cases a lengthwise shape, so that populations from differ-
ent regions are often spatially closer than populations belong-
ing to the same region. Furthermore, it is probable that gene
flow, mainly considered to be by pollen diffusion, does not
necessarily follow the shortest distance, due to the clearing for
agricultural purposes affecting almost all of Po Valley. The few
residual plain forests that still survive are isolated from each
other, and in most cases this prevents gene exchange between
them. Therefore, the most probable pathway of gene flow oc-
curs within the areas located at the lower levels of the moun-
tain chains, where the distribution of common ash and other
forest trees is much more regular and almost continuous.
In spite of the low value of F
ST
it was still possible to
observe a pattern of population genetic differentiation. Three
pedo-climatic regions were clearly defined in the dendrogram,
although two of them lacked one population each. Concern-
ing the Po Valley (characterized by peculiar soil type and cli-
matic conditions), the population most differentiated is Spaz-
zacamini (No. 3) which is located at higher altitude and closer
to the Alpine region. All the Apennine populations cluster to-
gether, with the exception of Campigna (No. 30), which is
indeed located in an area with different soil conditions and
was included in this group only for reasons of convenience.
The three populations from the Ligurian Mountains cluster to-
gether, suggesting an effect of soil type: in fact the climate is
common to the alpine regions. However, in case of the Alps
the soil type appears to be less important, since populations
from the two sectors, characterized by different soils, were in-
termingled in different parts of the dendrogram.
5. CONCLUSIONS
Common ash populations from Italy showed a high level of
genetic variability, similar to those detected in Bulgaria which
is one of the most important refuge areas for the species. The
preservation of such diversity therefore appears a goal to be
vigorously pursued, adopting the most appropriate strategy of
forest management.
Populations of common ash showed a considerable ex-
cess of homozygotes, a result which is consistent with find-
ings obtained by other authors for the same species. Although
several hypothesis can be proposed (presence of null alleles,
self-fertilization or mating between related individuals, age
of analysed plants, the Wahlund effect) none of them appear
plausible to fully explain such a high value of inbreeding. It
is likely therefore that any of the proposed explanations plays
Genetic variability in common ash 167
a role in determining the peculiar genetic structure of Italian
common ash populations, although further study is needed to
improve our knowledge of the situation.
Genetic differentiation among populations was slight, and
in many cases it was possible to observe a pattern of genetic
divergence coherent with pedo-climatic characteristics of the
area where the plants grow, although some populations grow-
ing in the same region showed a quite different genetic struc-
ture.
The results of the study contribute to a better understand-
ing of our knowledge of genetic variation of common ash in
Italy, so making for more efficient programmes aimed at the
preservation of the biodiversity. Furthermore our results give
useful indications of how to plan for more rational planning
of the management of reproductive material. According to the
European Council Directive 1999/105/CE, forest reproductive
material falling into the “source-identified” and “selected” cat-
egories should be used only within the Region of Provenance
where it originated. The transfer of material from one Region
to another should be avoided, due to possible problems asso-
ciated with adaptability. Although our results did not show a
significant effect of altitude on genetic characteristics of the
stands it seems appropriate, as a precaution, to also consider
this parameter in the frame of germplasm transfer, as provided
for by European Directive. The identification of Regions of
Provenance is therefore a basic aspect for a rational manage-
ment of activities linked with forest trees propagation, includ-
ing afforestation and in situ genetic preservation.
Acknowledgements: The work was funded by the Agency for En-
vironmental Protection and Technical Services (APAT), Department
of Nature Protection, Rome.
REFERENCES
[1] Bacles C.F.E., Burczyk J., Lowe A.J., Ennos R.A., Historical and
contemporary mating patterns in remnant populations of the forest
tree Fraxinus excelsior L., Evolution 59 (2005) 979–990.
[2] Belletti P., Monteleone I., Frassino maggiore, in: Calvo E., Fedrigol
M., Vaiani L. (Eds.), Caratterizzazione genetica di popolazioni fore-
stali della Lombardia. Regione Lombardia, Azienda Regionale delle
Foreste, Milano, 2002, pp. 44–48.
[3] Belletti P., Monteleone I., Ferrazzini D., Genetic variability at al-
lozyme markers, in sycamore (Acer pseudopatanus L.), populations
from north-western Italy, Can. J. For. Res. (2007) (in press).
[4] Boshier D., Amaral W., Threats to forest ecosystems and challenges
for the conservation and sustainable use of forest genetic resources,
in: Vinceti B., Amaral W., Meilleur B. (Eds.), Challenges in man-
aging forest genetic resources for livelihoods, IPGRI, Rome, 2004,
pp. 7–22.
[5] Boshier D., Stewart J., How local is local? Identifying the scale of
adaptative variation in ash (Fraxinus excelsior L.): results from the
nursery, Forestry 78 (2005) 135–143.
[6] Brachet S., Jubier M.F., Richard M., Jung-Muller B., Frascaria-
Lacoste N., Rapid identification of microsatellite loci using 5’ an-
chored PCR in the common ash Fraxinus excelsior L., Mol. Ecol. 8
(1999) 160–163.
[7] Brookfield J.F.Y., A simple new method for estimating null allele
frequency from heterozygote deficiency, Mol. Ecol. 5 (1996) 453–
455.
[8] Bruford M.W., Ciofi C., Funk S.M., Characteristics of microsatel-
lites, in: Karp A., Isaac P.G., Ingram D.S. (Eds.), Molecular
Tools for Screening Biodiversity, Chapman & Hall, London, 1998,
pp. 202–205.
[9] Comes H.P., Kadereit J.W., The effect of Quaternary climatic
changes on plant distribution and evolution, Trends Plant Sci. 3
(1998) 432–438.
[10] Cundall E.P., Cahalan C.M., Connolly T., Early results of ash
(Fraxinus excelsior L.) provenance trials at sites in England and
Wales, Forestry 76 (2003) 385–399.
[11] Eriksson G., Global warming and gene conservation of Noble
Hardwoods, in: Turok J., Jensen J., Palmberg-Lerche C., Rusanen
M., Russell K., de Vries S., Lipman E. (Eds.), Noble Hardwood
Network – Report of the Third Meeting, 13–16 June 1998, Sagadi,
Estonia, International Plant Genetic Resources Institute, Rome,
1999, pp. 98–112.
[12] European Commission, Georeferenced soil database of Europe,
Manual of procedures, Version 1.0, EUR 18092 EN, 1999.
[13] Excoffier L., Smouse P.E., Quattro J.M., Analysis of Molecular
Variance Inferred From Metric Distances Among DNA Haplotypes:
Application to Human Mitochondrial DNA Restriction Data,
Genetics 131 (1992) 479–491.
[14] Excoffier L., Laval G., Schneider S., Arlequin (version 3.0): An
integrated software package for population genetics data analysis,
Evol. Bioinf. Online 1 (2005) 47–50.
[15] Farris M.A., Mitton J.B., Population density, outcrossing rate, and
heterozygosity superiority in ponderosa pine, Evolution 38 (1984)
1151–1154.
[16] Felsenstein J., PHYLIP: Phylogeny Inference Package, Version 3.6.
(2004) />main.html.
[17] FRAXIGEN, Ash species in Europe: biological characteristics and
practical guidelines for sustainable use, Oxford Forestry Institute,
University of Oxford, U.K., 2005.
[18] Gérard P.R., Fernandez M.J.F., Frascaria-Lacoste N., Temporal
cline in a hybrid zone population between Fr axinus excelsior L. and
F. angustifolia Valh, Mol. Ecol. (2006) in press.
[19] Goudet J., FSTAT (Version 1.2): a computer program to calculate
F-statistics, J. Hered. 86 (1995) 485–486.
[20] Guo S.W., Thompson E.A., Performing the exact test of Hardy-
Weinberg proportion for multiple alleles, Biometrics 48 (1992)
361–372.
[21] Herzog S., Krabel D., Preserving genetic resources: concepts and
silvicoltural consequences on some European genera of Fagaceae,
Forest Snow and Landscape Research 75 (2000) 205–217.
[22] Heuertz M., Hausman J.F., Tsvetkov I., Frascaria-Lacoste N.,
Vekemans X., Assessment of genetic structure with and among
Bulgarian populations of the common ash (Fraxinus excelsior L.),
Mol. Ecol. 10 (2001) 1615–1623.
[23] Heuertz M., Vekemans X., Hausman J.F., Palada M., Hardy O.J.,
Estimating seed versus pollen dispersal from spatial genetic struc-
ture in the common ash, Mol. Ecol. 12 (2003) 2483–2495.
[24] Heuertz M., Fineschi S., Anzidei M., Pastorelli R., Salvani D., Paule
L., Frascaria-Lacoste N., Hardy O.J., Vekemans X., Vendramin
G.G., Chloroplast DNA variation and postglacial recolonization
of common ash (Fraxinus excelsior L.) in Europe, Mol. Ecol. 13
(2004) 3437–3452.
[25] Heuertz M., Hausman J.F., Hardy O.J., Vendramin G.G., Frascaria-
Lacoste N., Vekemans X., Nuclear microsatellites reveal contrast-
ing patterns of genetic structure between western and southeastern
European populations of the common ash (Fraxinus excelsior L.),
Evolution 58 (2004) 976–988.
[26] Huntley B., Birks H.J.B., An Atlas of Past and Present Pollen
Maps of Europe: 0-13 000 Years Ago, Cambridge University Press,
Cambridge, 1983.
168 D. Ferrazzini et al.
[27] Lefort F., Brachet S., Frascaria-Lacoste N., Edwards K.J., Douglas
G.C., Identification and characterization of microsatellite loci in ash
(Fraxinus e xcelsior L.) and their conservation in the olive family
(Oleaceae), Mol. Ecol. 8 (1999) 1088–1090.
[28] Mantel N., The detection of disease clustering and a generalized
regression approach, Canc. Res. 27 (1967) 209–220.
[29] Morand M.E., Brachet S., Rossignol P., Dufour J., Frascaria-
Lacoste N., A generalized heterozygote deficiency assessed with
microsatellites in French common ash populations, Mol. Ecol. 11
(2002) 377–385.
[30] Morand-Prieur M.E., Raquin C., Shykoff A., Frascaria-Lacoste N.,
Males outcompete hermaphrodites for seed siring success in con-
trolled crosses in polygamous Fraxinus excelsior (Oleaceae), Am.
J. Bot. 90 (2003) 949–953.
[31] Namkoong G., Forest Genetics and Conservation in Europe, in:
Turok J., Palmberg-Lerche C., Skrøppa T., Ouédraogo A.S. (Eds.),
Conservation of forest genetic resources in Europe, International
Plant for Genetic Resources Institute, Rome, 1998, pp. 3–10.
[32] Nei M., Genetics distance between populations, Am. Nat. 106
(1972) 282–292.
[33] Nei M., Molecular Evolutionary Genetics, Columbia University
Press, New York, 1987.
[34] Newton A.C., Allnutt T.R., Gillies A.C.M., Lowe A.J., Ennos R.A.,
Molecular phylogeography, intraspecific variation and the conser-
vation of tree species, Trends Ecol. Evol. 14 (1999) 140–145.
[35] Palmberg-Lerche C., Conservation of forest biological diversity
and forest genetic resources, in: Palmberg-Lerche P., Iversen
P.A., Sigaud P. (Eds.), Forest Genetic Resources 29, Food and
Agriculture Organization of the United Nations, Rome, 2001, 70 p.
[36] Pemberton J.M., Slate J., Bancroft D.R., Barrett J.A.,
Nonamplifying alleles at microsatellites loci: a caution for
parentage and population studies, Mol. Ecol. 4 (1995) 249–252.
[37] Picard J.F., Contribution a l’étude de la biologie florale et de la fruc-
tification du Frêne commun (Fraxinus excelsior L.), Rev. For. Fr. 34
(1982) 97–107.
[38] Pliûra A., European long-term gene conservation strategies: Ash
(Fraxinus spp.), in: Turok J., Jensen J., Palmeberg-Lerche C.,
Rusanen M., Russell K., de Vries S., Lipman E. (Eds.), Noble hard-
woods network – Report of the third meeting, 13–16 June 1998,
Sagadi, Estonia, International Plant Genetic Resources Institute,
Rome, 1999, pp. 8–20.
[39] Raymond M., Rousset F., Genepop (version 1.2): population genet-
ics software for exact tests and ecumenicism, J. Hered. 86 (1995)
248–249.
[40] Reynolds J., Weir B.S., Cockerham C.C., Estimation for the
coancestry coefficient: basis for a short-term genetic distance,
Genetics 105 (1983) 767–779.
[41] Rholf F.J., NTSYS-PC, Numerical taxonomy and multivariate anal-
ysis system, Version 2.1, Setauket, NY, USA, Exeter Publishing,
2000.
[42] Rice W.R., Analyzing tables of statistical tests, Evolution 43 (1989)
223–225.
[43] Rossi P., Vendramin G.G., Giannini R., Estimation of mating system
parameters in two Italian natural populations of Fagus sylvatica,
Can. J. For. Res. 26 (1996) 1187–1192.
[44] Slatkin M., A measure of population subdivision based on mi-
crosatellite allele frequencies, Genetics 139 (1995) 457–462.
[45] SPSS, SPSS Base 12.0 for Windows User’s Guide, SPSS Inc.,
Chicago, IL, 2003.
[46] Tessier du Cros E., Màtyàs C., Kriebel H., Contribution of ge-
netics to the sustained management of global forest resources –
Conclusions and recommendations, in: Màtyàs C. (Ed.), Forest
genetics and sustainability, Forestry Sciences, Vol. 63, Kluwer
Academic Publishers, Dordrecht, 1999, pp. 281–287.
[47] Toro M.A., Caballero A., Characterization and conservation of ge-
netic diversity in subdivided populations, Phil. T. Roy. Soc. B. 1459
(2005) 1367–1378.
[48] Van Oosterhout C., Hutchinson W.F., Wills D.P.M., Shipley P.,
M-: software for identifying and correcting genotyp-
ing errors in microsatellite data, Mol. Ecol. Notes 40 (2004) 535–
538.
[49] Vendramin G.G., Degen B., Petit R., Anzidei M., Madaghiele A.,
Ziegenhagen B., High level of variation at Abies alba chloroplast
microsatellite loci in Europe, Mol. Ecol. 8 (1999) 1117–1126.
[50] Weir B.S., Cockerham C.C., Estimating F-statistics for the analysis
of populations structure, Evolution 38 (1984) 1358–1370.
[51] Wright S., Systems of mating, Genetics 6 (1921) 111–178.
[52] Wright S., Evolution and the genetics of populations, The theory of
gene frequency, Vol. 2, University of Chicago Press, Chicago, IL,
1969.
[53] Yadzani R., Muona O., Rudin D., Szmidt A.E., Genetic structure
of a Pinus sylvestris L. seed-tree stand and naturally regenerated
understory, For. Sci. 31 (1986) 430–436.
To access this journal online:
www.edpsciences.org/forest