Báo cáo lâm nghiệp: "Modelling stand basal area growth for radiata pine plantations in Northwestern Spain using the GADA" doc
Bạn đang xem bản rút gọn của tài liệu. Xem và tải ngay bản đầy đủ của tài liệu tại đây (276.9 KB, 11 trang )
Ann. For. Sci. 64 (2007) 609–619
c INRA, EDP Sciences, 2007
DOI: 10.1051/forest:2007039
Available online at:
www.afs-journal.org
Original article
Modelling stand basal area growth for radiata pine plantations in
Northwestern Spain using the GADA
Fernando Castedo-Doradoa*, Ulises Di´ guez-Arandab , Marcos Barrio-Antac ,
e
Juan Gabriel Álvarez-Gonz´ lezb
a
a
Departamento de Ingeniería y Ciencias Agrarias, Universidad de León, Escuela Superior y Técnica de Ingeniería Agraria,
Campus de Ponferrada, 24400 Ponferrada, Spain
b
Departamento de Ingeniería Agroforestal, Universidad de Santiago de Compostela, Escuela Politécnica Superior,
Campus universitario, 27002 Lugo, Spain
c
Departamento de Biología de Organismos y Sistemas, Escuela Universitaria de Ingenierías Técnicas.
C/ Gonzalo Gutiérrez de Quirós, 33600 Mieres, Spain
(Received 14 June 2006; accepted 18 October 2007)
Abstract – A stand basal area growth system for radiata pine (Pinus radiata D. Don) plantations in Galicia (Northwestern Spain) was developed
from data corresponding to 247 plots measured between one and five times. Six dynamic equations were considered for analysis and both numerical
and graphical methods were used to compare alternative models. The equation that best described the data was a dynamic equation derived from the
Korf growth function by the generalized algebraic difference approach (GADA) and by considering two parameters as site-specific. This equation was
fitted in one stage by the base-age-invariant dummy variables method. The system also incorporated an equation for predicting initial stand basal area,
expressed as a function of stand age, site index, and the number of trees per hectare. This information can be used to establish the starting point for the
projection equation when no inventory data are available. The effect of thinning on stand basal area growth was also analyzed and the results showed
that the same projection equation can be used to obtain reliable predictions of unit-area basal area development in thinned and unthinned stands.
stand basal area projection / stand basal area initialization / dummy variables method / generalized algebraic difference approach / thinning
effect
Résumé – Modélisation de la croissance en surface terrière de plantations de Pinus radiata dans le Nord-ouest de l’Espagne. Un système
d’équations modélisant la croissance en surface terrière a été développé pour des plantations de Pinus radiata D. Don en Galice (Nord-ouest de
l’Espagne) à partir des données recueillies dans 247 placettes mesurées entre une et cinq fois. Six équations dynamiques ont été analysées et des
méthodes graphiques et numériques ont été employées pour comparer des modèles alternatifs. Une équation dynamique dérivée de la fonction de
croissance de Korf, dont les deux paramètres spécifiques à la station sont estimés par l’approche de la différence algébrique généralisée (GADA),
décrit le mieux les données. L’équation a été ajustée en une seule étape en utilisant la méthode des variables indicatives indépendantes de l’âge. En
outre, pour prédire la surface terrière initiale, le système incorpore aussi une fonction de l’âge du peuplement, de l’indice de fertilité de station et du
nombre d’arbres à l’hectare. Cette information peut être utilisée pour fixer l’état initial de l’équation de projection quand les données d’inventaire ne
sont pas disponibles. L’effet de l’éclaircie sur la croissance en surface terrière a également été analysé et les résultats montrent que la même équation de
projection peut être utilisée pour prộdire de faỗon able lộvolution de la surface terriốre dans les peuplements non éclaircis et les peuplements éclaircis.
projection de la surface terrière / initialisation de la surface terrière / méthode des variables indicatives / approche généralisée de la différence
algébrique / effet de l’éclaircie
1. INTRODUCTION
According to the Third National Forest Inventory of Spanish forests [70], radiata pine (Pinus radiata D. Don) plantations occupy a total surface area of approximately 90 000 ha
in Galicia. The oldest stands of this species in the region were
planted in the 1940s, and plantations are currently being established at a rate of 6 000 ha per year [1]. This makes radiata
pine one of the three most commonly used species, along with
Eucalyptus nitens Maiden and E. globulus Labill., in reforestation programmes, particularly those involving abandoned agricultural land. The wide distribution and the high growth rate
* Corresponding author:
of the species have also made it very important in the forestry
industry in northern Spain, with an annual harvest volume of
505 000 m3 in the period 1992–2001 [70]. Two different silvicultural regimes are usually applied in the region. Low density regimes, characterized by initially low stocking densities
at plantation (1200–1300 trees ha−1 followed by two heavy
thinnings, resulting in values of the relative spacing index of
0.20–0.22. The high density regime corresponds to initial tree
densities of between 2100–2500 trees ha−1 , and 3–4 light thinnings to maintain the relative spacing index at values of 0.13–
0.15. Rotation ages usually vary from 25 to 35 years depending on the site quality of the stand and on the purpose of the
timber.
Article published by EDP Sciences and available at or />
610
F. Castedo-Dorado et al.
Sánchez et al. [60] developed a static1 stand-level growth
and yield model for the species in Galicia based on data from
the first inventory of a network of permanent plots, which
provides rather limited information about the forest stand.
As more inventories of the network of permanent plots were
available, a dynamic1 whole-stand growth model has been
constructed. Several submodels have been developed to date:
(i) a merchantable volume equation [15], (ii) a diameter distribution function [14], (iii) a mortality model [2], (iv) a site
quality system [27], and (v) a generalized height-diameter
model [16, 45]. The remaining submodel is a stand basal
area growth system. The dynamic whole-stand growth model
would be used for a variety of purposes including inventory
updating, harvest scheduling and prediction of wood yields for
different stand conditions.
The stand basal area growth system is a key component of
whole-stand-level models, since stand basal area is directly related to other very important economic variables, such as total
stand volume and quadratic mean diameter [69]. Furthermore,
estimations from stand basal area growth equations can be
used to constrain size-class or individual tree models, and thus
form a link between high and low resolution models [32, 36].
Stand basal area growth functions must possess three main
properties so that consistent estimates can be obtained [4, 26,
68]: biological meaning, path-invariance and simplicity. The
gross stand basal area function must have an asymptotic value
when the projected stand age approaches infinity [3, 6]. The
projection function must be path-invariant, which implies that
for the same unthinned growth period, the result of projecting
firstly from t0 to t1 , and then from t1 to t2 , must be the same as
that of the one-step projection from t0 to t2 . Finally, the models
must be parsimonious, because models that are too complex
and include many interactions between independent variables
may be unstable and have a poor predictive capacity.
Fulfilment of these properties depends on both the construction method and the mathematical function used to develop the model. Most of them can be achieved by use of the
Algebraic Difference Approach (ADA) proposed by Bailey
and Clutter [7] or its generalization (GADA) of Cieszewski
and Bailey [22]. The GADA can be applied in modelling the
growth of any site dependent variable involving the use of unobservable variables substituted by the self-referencing concept [51] of model definition [21], such as dominant height,
stand basal area, stand volume, number of trees per unit area,
stand biomass or stand carbon sequestration (e.g., [9, 21]).
The objective of the present study was to develop a stand
basal area growth system for radiata pine plantations in Galicia
(northwestern Spain). A stand basal area projection function
for different types of stands (thinned and unthinned) was developed by use of the GADA. A stand basal area initialization
model was developed for establishing the stating point for the
1
Static growth models attempt to predict directly the course over
time of the quantities of interest (volumes, mean diameter). Dynamic
growth models, rather than directly modelling the course of values
over time, predict rates of change under various conditions. The trajectories over time are then obtained by adding or integrating these
rates.
projection equation when no inventory data are available. The
effect of thinning on stand basal area growth was also examined.
2. MATERIALS AND METHODS
2.1. Data
The data used to develop the stand basal area growth system were
obtained from two different sources. Initially, in the winter of 1995
the Unidade de Xestión Forestal Sostible of the University of Santiago
de Compostela established a network of 223 plots in pure radiata pine
plantations in Galicia. The plots were located throughout the area of
distribution of this species in the study region, and were subjectively
selected to represent the existing range of ages, stand densities and
sites. The size of plot ranged from 625 to 1200 m2 , depending on
stand density, in order to achieve a minimum of 30 trees per plot.
All the trees in each sample plot were labelled with a number. Two
measurements of diameter at breast height (1.3 m above ground level)
were made at right angles to each other and to the nearest 0.1 cm, with
callipers, and the arithmetic mean of the two measurements was calculated. Total height was measured to the nearest 0.1 m with a digital
hypsometer in a 30-tree randomized sample and in another sample
including the dominant trees (the proportion of the 100 thickest trees
per hectare, depending on plot size). Descriptive variables of each
tree were also recorded, e.g. if they were alive or dead.
A subset of 155 and 46 of the initially established plots was remeasured in the winters of 1998 and 2004, respectively. Between
each of the three inventories, 22 plots were lightly or moderately
thinned once from below. These plots were also remeasured immediately before and after thinning operations, so that they were inventoried four or five times. The first sources of data were the inventories
carried out in 1995, 1998, and 2004 and on the date of the thinning
operations.
In addition, data from the first and second measurements of two
thinning trials installed in a 12-year old stand of radiata pine were
also used. Each thinning trial consisted of 12 plots of 900 m2 , in
which four thinning regimes were replicated on three different occasions. The four thinning treatments considered were: an unthinned
control, a light thinning from below (approximately 10% of the stand
basal area removed), a moderate thinning from below (approximately
25% of the stand basal area removed), and a selection thinning (selection of crop trees and extraction of their competitors, which represent
approximately 20% of the stand basal area of the unthinned control).
The plots were thinned immediately after plot establishment in 2003
and were re-measured two years later. The second source of data corresponds to the first and second inventories of these thinning trials.
The stand variables calculated for each inventory were: stand age
(t), stand basal area (BA), number of trees per hectare (N), dominant
height (H0 ) (defined as the mean height of the 100 thickest trees per
hectare), and site index (S , defined as the dominant height of the
stand, in meters, at a reference age of 20 years), which was obtained
from the site quality system developed by Diéguez-Aranda et al. [27].
Only live trees were included in the calculations for stand basal
area and number of trees per hectare. In addition, data on the number
of trees per hectare and stand basal area removed in thinning operations were available. Summary statistics, including the mean, minimum, maximum, and standard deviation of these stand variables are
given in Table I.
Stand basal area growth model for radiata pine plantations
611
Table I. Characteristics of the sample plots used for model fitting.
Unthinned plots (368 inventories)
Thinned plots (90 inventories)
Variable
Mean
Min.
Max.
S.D.
Mean
Min.
Max.
S.D.
t (years)
23.9
7
47
8.9
19.9
12
35
6.7
245.1
−1
N (trees ha )
965
191.6
2048
566.4
885.8
378.0
1333.0
BA (m2 ha−1 )
34.6
5.1
87.1
11.4
30.5
16.9
63.0
9.4
H0 (m)
20.5
5.9
35.2
5.8
20.2
12.9
32.7
4.4
S (m)
19.1
10.8
27.6
3.4
21.6
15.3
26.7
3.0
2.2. Stand basal area projection function
Several stand basal area projection functions for thinned and unthinned stands have been reported. Many of these functions are
empirically-based [6, 8, 24, 25, 35, 40, 49, 53, 54, 56, 65, 69], while
others [9, 28, 55, 66, 67] are derived directly from biologically-based
growth functions (e.g., Korf (cited in [46]), Hossfeld [38], and
Bertalanffy-Richards [11, 12, 57]).
The use of dynamic equations derived from the integral form of
biologically-based differential functions is highly recommended for
projecting stand basal area over time since they fulfil the three previously outlined desired characteristics. Bailey and Clutter [7] proposed
a technique for dynamic equation derivation that is known in forestry
as the Algebraic Difference Approach (ADA), which essentially involves replacing a base-model site-specific parameter with its initialcondition solution. The main limitation of this approach is that most
models derived with it are either anamorphic or have single asymptotes [7, 22]. Cieszewski and Bailey [22] extended this method and
presented the Generalized Algebraic Difference Approach (GADA),
which can be used to derive the same models as those derived by
ADA. The main advantage of GADA is that the base equations can
be expanded according to various theories about growth characteristics (e.g. asymptote, growth rate), thereby allowing more than one
parameter to be site-specific and allowing derivation of more flexible
dynamic equations (see [18–20, 22]). GADA includes the ability to
simulate concurrent polymorphism and multiple asymptotes.
2.3. Stand basal area initialization function
To project stand basal area by use of a projection function it is necessary to have an initial value at a given age for this variable. Usually,
the initial condition value is obtained from a common forest inventory where diameter at breast height is measured; however, when this
is not available, a stand basal area initialization equation is required.
After replacing the site-specific parameters of the base equation
with explicit functions of X (one unobservable independent variable that describes site productivity as a summary of management
regimes, soil conditions, and ecological and climatic factors), we developed an initialization function for estimating stand basal area at
any specific point in time. Since stand basal area depends on the age
of the stand and other stand variables (theoretically the productive capacity of the site and any other measure of stand density), it is generally necessary to relate X to these variables to achieve good estimates.
Compatibility between the projection and initialization functions
is ensured when: (1) both are developed on the basis of the same
base equation, (2) X is related in linear or nonlinear form to stand
variables that do not vary over time (e.g. site index), and (3) the nonsite-specific parameters of the base equation have the same value for
both the initialization and projection functions. Compatibility implies
that, for a given stand basal area curve obtained from the initialization
function, irrespective of which point on the curve is used as the initial
condition value in the projection function, the estimated stand basal
area will always be a point on that curve.
The compatibility between the projection and initialization functions does not depend on the process of parameter estimation, so different methodologies can be used to estimate the parameters of both
functions considering the same base model: (a) estimation of the parameters of the projection function, substitution of their values into
the initialization function, and then fitting the latter to estimate the
parameters that relate X to stand variables that do not vary over time;
(b) estimation of the parameters of the initialization function, and recovery of the implied projection function; or (c) estimation of all the
parameters of the system simultaneously using an appropriate regression technique that accounts for the correlations between the righthand side endogenous variables and the error component of the lefthand side endogenous variables (this is called simultaneous equation
bias) [62]. With options (a) and (b) is easier to achieve convergence
on the parameter estimates, and provide the best estimates of stand
basal area projection or initialization, depending on which equation
is prioritized; however, this may increase the bias and the standard error of the other equation. Option (c) reduces the total system squared
error, that is, it simultaneously minimizes both stand basal area projection and initialization errors. The selection of the most appropriate fitting option will depend on the forest manager, who should decide if the system will be used mainly for stand basal area projection,
initialization, or a mixture of both. In this study we selected option
(a), which gives priority to the projection function, because the dynamic model will be most frequently used to project stand basal area,
given an initial stand condition obtained from a common forest inventory [9, 28, 67].
2.4. Models considered
A large number of mathematical equations can be used to describe stand basal area growth. In the present study, three well-known
growth functions in forestry applications, including stand basal area
growth modelling, were selected for analysis: Korf (cited in [46]),
Hossfeld [38], and Bertalanffy-Richards [11, 12, 57].
On the basis of these equations, several dynamic models were formulated by use of GADA to develop the projection function. Most
of the equations considered for modelling stand basal area growth
did not assume anamorphic growth for this variable (e.g., [3, 30,
66, 67]; therefore, only the possible polymorphic solutions of the
612
F. Castedo-Dorado et al.
Table II. Base models and GADA formulations considered.
Base model
Parameter
Solution for X with initial values (t0 ,Y0 )
related to site
Korf:
a2 = X
X0 = − ln
Y = a1 exp −a2 t−a3
a1 = exp (X)
−b3
X0 = 1 t0
2
Y0
a1
Dynamic equation
a
Y = b1
t03
⎛
⎜
⎜
⎜b + tb3 ln (Y ) +
⎜
⎜ 1 0
0
⎝
b
b
⎞
2⎟
⎟
⎟
⎟
ln (Y0 ) ⎟
⎠
Y0
b1
t 0 b3
t1
(BA1)
Y = exp (X0 ) exp − (b1 + b2 /X0 ) t−b3
(BA2)
Y = b1 1 − (1 − b1 /Y0 ) (t0 /t)b3
4b2 t03 + −b1 − t03
(BA3)
a2 = b1 + b2 /X
−a3
a2 = X
Y=
X0 = t0
a1 = b1 + X
Hossfeld:
X0 =
a1
1+a2 t −a3
1
2
a1
Y0
−1
Y0 − b1 +
−b3
(Y0 − b1 )2 + 4b2 Y0 t0
Y=
a2 = b2 /X
b1 +X0
1+b2 /X0 t −b3
X0 = − ln 1 − (Y0 /b1 )1/b3 t0
⎛
⎜
⎜
⎜
⎜
Y = b1 ⎜1 − 1 −
⎜
⎝
X0 =
Y = Y0
a3 = b2 + b3 /X
Y = a1 1 − exp (−a2 t)
a2 = X
a1 = exp (X)
Bertalanffy-Richards:
with L0 = ln
a3
1
2
ln Y0 − b2 L0 +
(ln Y0 − b2 L0 )2 − 4b3 L0
1 − exp (−b1 t0 )
above-mentioned equations were considered for analysis. Some of
these solutions had been discarded earlier because the fitting curves
performed poorly in describing the observed trends in the data. We
therefore focused our efforts on six dynamic equations, the formulations of which are shown in Table II. All of the equations are base-age
invariant.
General notational convention, a1 , a2 . . . an was used to denote
parameters in base models, whereas b1 , b2 . . . bm were used for global
parameters in subsequent GADA formulations. All the GADA-based
models have the general implicit form of Y = f (t, t0 , Y0 , b1 , b2 . . . bm ).
Models BA1, BA3 and BA5 were derived by applying GADA to
the Korf, Hossfeld and Bertalanffy-Richards functions, respectively,
and by considering only parameter a2 to be site specific. In this case
GADA is equivalent to ADA. Model BA1 has been used to describe
stand basal area growth in many studies (e.g., [3,9,28,30,44,66,67]).
Model BA3 is the polymorphic equation described by McDill and
Amateis [48] for estimating site quality, and can also be used for stand
basal area growth modelling (e.g., [30,31]). Model BA5 has also often
been used in forestry applications, including stand basal area growth
modelling [28, 41, 44, 53, 55], because of its theoretical flexibility. All
of these models are polymorphic and have a single asymptote.
Dynamic models BA2, BA4 and BA6 were developed by considering two parameters to be site specific. Model BA2 was derived on
the basis of the Korf function by considering both parameters a1 and
a2 to be dependent on X. To facilitate such derivation, the base equation was re-parameterized into a more suitable form for manipulation
of these two parameters, by use of exp(X) instead of a1 . Parameter a2
was expressed as a linear function of the inverse of X. Model BA4
was derived by Cieszewski [19] from the Hossfeld function, by replacing a1 with a constant plus the unobserved site variable X, and
a2 by b2 /X. Model BA6 was developed by Krumland and Eng [43]
by expressing the asymptote as an exponential function of X and the
shape parameter as a linear function of the inverse of X.
For the base equations with two site-specific parameters, the solution for X involved finding roots of a quadratic equation and selecting the most appropriate for substituting into the dynamic equation.
We only used the solutions involving addition rather than subtraction
(BA4)
Y0
b1
1−exp(−b1 t)
1−exp(−b1 t0 )
⎞b3
1/b3 t /t0 ⎟
⎟
⎟
⎟
⎟
⎟
⎠
(b2 +b3 / X0 )
(BA5)
(BA6)
of the square root because they are more likely to be real and positive [22].
In summary, both recently developed dynamic equations with two
site-specific parameters and frequently used dynamic equations with
only one site-specific parameter were tested. The initialization function was developed on the basis of the base growth function from
which the dynamic model that provided the best results on projection
was derived.
2.5. Model fitting and validation
The stand basal area growth system was developed in two stages:
firstly, we fitted a model for projecting stand basal area over time; secondly, we attempted to develop a compatible initialization function,
using option (a) (see Sect. 2.3.). If this is not possible (i.e., if the initialization function requires the inclusion of stand variables that vary
over time -such as number of trees per hectare or dominant height- to
achieve good estimates), compatibility is not ensured, so the “best”
stand basal area initialization model should be constructed, regardless of the base function used for the stand basal area projection.
Data measurements generally contain environmental and measurement errors. If stand basal area is assumed to be error free when
it is on the right-hand side of the equation, but includes error when it
is on the left-hand side of the equation, a conflict exists. Therefore,
stand basal areas that appear on the right-hand side of the models
should represent points on the global model (estimates) that cannot
be evaluated until the global parameters are estimated. However, the
estimated stand basal areas must be known so that unbiased estimates
of the global model parameters can be obtained [43]. Several methods have been suggested to overcome this problem (e.g., [7, 23, 33]).
These have generally been applied for fitting site-quality equations
and involve simultaneous estimation of the global model parameters
and of the measurement and environmental errors associated with the
site-specific parameters.
We used the dummy variables method proposed by Cieszewski
et al. [23]. In this method, the initial conditions are specified as
Stand basal area growth model for radiata pine plantations
identical for all the measurements belonging to the same unthinned
growth period within a single plot, hereafter the individual being investigated. During the fitting process the stand basal area corresponding to the initial age (which can be arbitrarily selected for each unthinned interval, although age zero is not allowed) is simultaneously
estimated for each individual and all of the global model parameters.
In the dummy variables method it is recognized that each measurement is made with error, and therefore, it seems unreasonable to force
the model through any given measurement. Instead, the curve is fitted
to the observed individual trends in the data.
As an example of this procedure, consider model BA1. The Y0
variable must be substituted by a sum of terms containing a sitespecific or local parameter (an initial stand basal area) and a dummy
variable for each individual:
Y = b1
(Y01 I1 + Y02 I2 + . . . + Y0n In )
b1
t 0 b3
t1
(1)
where Y0i is the site-specific parameter for each individual i, and Ii
is a dummy variable equal to 1 for individual i and 0 otherwise. The
sum of terms of the initial stand basal area times the dummy variable
collapses into a single parameter (an estimated stand basal area at
the specified initial age) that is unique for each individual during the
fitting process. The dummy variables method was programmed using
the MODEL procedure of SAS/ETS [62]. The Marquardt algorithm
was used for model fitting.
Once the projection function was fitted, the shared parameters
were substituted in the initialization function and the remaining unknown parameters were estimated by ordinary nonlinear least squares
(ONLS) by the NLIN procedure of SAS/STAT [63]. Only data from
inventories corresponding to ages younger than 15 years were used,
and it was assumed that if projections based on ages older than this
threshold are required, the initial stand basal area should be obtained
directly from inventory data.
The models were fitted by nonlinear least squares without considering the possible autocorrelation among the errors because of the
repeated measurements on the same plots. With data from the first inventory of 223 plots and from the second and third re-measurements
of 155 and 46 of these plots, respectively, the maximum of possible
time correlations among residuals is practically inexistent. In addition, preliminary graphical analysis did not reveal any trend in raw
residuals as a function of age lag1-residuals within the same individual for the models analyzed. Therefore, the problem of autocorrelated
errors was not considered in the fitting process.
Comparison of the estimates for the different models was based on
numerical and graphical analyses of the residuals. Two statistics were
examined: the root mean square error (RMSE), which analyses the
accuracy of the estimates in the same units as the dependent variable,
and the coefficient of determination (also referred to as pseudo-R2
when applied in nonlinear regression), which shows the proportion
of the total variance of the dependent variable that is explained by
the model. Although there are several shortcomings associated with
use of the R2 in nonlinear regression, the general usefulness of some
global measure of model adequacy would seem to override some of
those limitations ([59], p. 424). The expressions of these statistics are
as follows:
n
ˆ 2
i=1 (yi − yi )
RMSE =
(2)
n− p
R2 = 1 −
n
ˆ 2
i=1 (yi − yi )
n
¯2
i=1 (yi − y)
(3)
613
were yi , yi and y are the observed, predicted and average values of
ˆ
¯
the dependent variable, respectively, n is the total number of observations, and p is the number of model parameters.
Another important step in evaluating the models was to perform
graphical analyses of the residuals and the appearance of the fitted
curves overlaid on the trajectories of the stand basal area for each
individual. Visual or graphical inspection is an essential point in selecting the most appropriate model because curve profiles may differ
drastically, even though fitting statistics and residuals are similar.
If we are interested in comparing candidate models in terms of
their predictive capabilities, it must be taken into account that ordinary residuals are measures of quality of fit and not of quality of future prediction ([50], p. 168) and therefore validation of the model
must be carried out. For this, only a newly collected data set can
be used [42]. Several methods of validation have been proposed because of the scarcity of such data (e.g., splitting the data set or crossvalidation, double cross-validation), although they seldom provide
any additional information compared with the respective statistics obtained directly from models built from entire data sets [42]. Moreover,
according to Myers ([50], p. 170) and Hirsch [37] the final estimation
of the model parameters should come from the entire data set because
the estimates obtained with this approach will be more precise than
those obtained from the model fitted from only one portion of the
data. We therefore decided to defer model validation until a new data
set is available for assessing the quality of the predictions.
2.6. Thinning effect on basal area growth
Theoretically, when a forest stand is thinned, its growth characteristics and dynamics change (e.g. [64]). Several studies have shown
that basal area growth rates in thinned stands exceed those of unthinned stands with the same characteristics (e.g. [5, 6, 34, 35, 52, 53,
56]). Two approaches have been commonly used to consider the effect of thinning operations on stand basal area growth:
1. Development of different basal area growth functions for different types of stands (unthinned and thinned) that have the same
mathematical structure but that have been parameterized using
different data sets [40, 52, 69, 71].
2. Inclusion of a thinning response function that expresses the basal
area growth of a thinned stand as a product of a reference growth
and the thinning response function [39]: the reference growth accounts for the factors affecting stand growth in unthinned stands
while the thinning response function predicts the relative growth
response following thinning. Several attempts have been made to
model the thinning response on the growth of the remaining basal
area [5,8,17,30,35,54,56], mainly with stands derived from plantations.
In this study, we used the first approach to take into account the effect of thinning on stand basal area growth, by employing dummy
categorical variables. To compare the differences between basal area
growth in thinned and unthinned plots, we used the non-linear extra sum of squares method for detecting simultaneous homogeneity
among parameters for both treatments (see Bates and Watts [10],
pp. 103–104). If the homogeneity of parameters test reveals significant differences between silvicultural treatments, separate basal area
growth models are necessary for each treatment.
614
F. Castedo-Dorado et al.
Table III. Parameter estimates, approximated standard errors, and goodness-of-fit statistics for the models analyzed.
Base model
Dynamic
equation
Korf
BA1
Korf
BA2
Param.
Estimate
Approx.
std. error
Approx. p-value
b1
122.4
11.49
< 0.0001
b3
0.8570
0.0670
< 0.0001
b1
BA4
0.9233
0.0681
b1
83.43
3.90
< 0.0001
b3
1.897
0.079
< 0.0001
68.62
4.32
–3972
1577
0.0125
2.020
0.084
Bertalanffy-Richards
BA6
b1
73.37
2.64
< 0.0001
b3
2.208
0.144
< 0.0001
0.06025
0.00518
0.9935
1.366
0.9927
1.334
0.9930
1.372
0.9926
1.325
0.9930
< 0.0001
b2
–8.737
2.495
0.0006
b3
BA5
1.290
< 0.0001
b1
Bertalanffy-Richards
0.9932
< 0.0001
b2
1.315
< 0.0001
b3
Hossfeld
0.0111
R2
0.0180
543
b1
BA3
115.9
1391
b3
Hossfeld
–276.1
b2
RMSE
47.01
10.95
< 0.0001
3. RESULTS AND DISCUSSION
3.1. Stand basal area projection function
The parameter estimates for each model, including their approximated standard errors and p-values, and the corresponding goodness-of-fit statistics are shown in Table III. Among
all the equations analyzed, the models with only one sitespecific parameter (models BA1, BA3, and BA5) provided
slightly poorer results for the goodness-of-fit statistics than the
corresponding models with two site-specific parameters (models BA2, BA4, and BA6, respectively) derived from the same
base equation. All of the models accounted for approximately
99.3% of the total variation and provided a random pattern of
residuals around zero with homogeneous variance and no discernable trends.
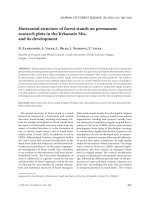
As previously commented, visual or graphical inspection
of the models was considered an essential point in selecting
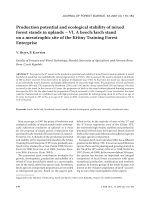
the most accurate representation. Therefore, plots showing the
curves for stand basal areas of 15, 30, 45, and 60 m2 ha−1 at
20 years overlaid on the trajectories of observed values over
time, were examined (Fig. 1). The equations derived from the
same base model (with one and two site-specific parameters)
were overlaid on the same graph. This comparison allowed us
to discard some models that did not provide a good description
of the trends in the data. Models BA3 and BA5, derived considering only one parameter to be site-specific in the base models of Hossfeld and Bertalanffy-Richards, respectively, were
significantly poorer at describing the data than the corresponding two site-specific parameter models BA4 and BA6. The
asymptotic values of models BA3 and BA5 appeared to be too
small, especially for the highest growth curves, in which they
clearly cross the observed values of stand basal area over time.
Model BA1 derived from the base model of Korf by considering one parameter to be site-specific, was the only model that
behaved in a similar way to the corresponding model with two
site-specific parameters (BA2).
Within the group with two site-specific parameters all models provided similar results, although model BA2 seemed to
provide slightly better graphical descriptions, especially for juvenile ages. The asymptotic value for the highest stand basal
area growth curves generated with model BA2 (125.4 m2 ha−1 )
appeared to be slightly high, although this does not have any
apparently serious consequences for the quality of the predictions within the rotation ages of 25–35 years usually applied
for radiata pine stands in Galicia [14,58]. Moreover, the curves
seem reliable beyond the rotation age, as judged by the estimations of stand basal area overlaid on the trajectories of the
observed values over time (Fig. 1). Similar results were obtained by Barrio et al. [9] in developing a basal area projection
function for Pinus pinaster stands in Galicia.
In summary, taking into account the adequate graphs provided by model BA2 (Fig. 1) as well as the values of
the goodness-of-fit statistics obtained in the fitting process
(Tab. III), the BA2 dynamic model derived from the Korf
equation was selected for projecting the stand basal area of
Stand basal area growth model for radiata pine plantations
Korf base model (BA1, BA2)
Hossfeld base model (BA3, BA4)
60
60
BA , m2 ha-1
70
-1
80
70
50
2
80
40
BA , m ha
615
30
50
40
30
20
20
10
10
0
0
0
10
20
30
40
50
0
10
t , years
20
30
40
50
t , years
Bertalanffy-Richards base model (BA5, BA6)
80
70
2
BA , m ha
-1
60
50
40
30
20
10
0
0
10
20
30
40
50
t , years
Figure 1. Stand basal area growth curves for stand basal areas of 15, 30, 45 and 60 m2 ha−1 at 20 years for the two- (solid line) and one-sitespecific models (dashed line) overlaid on the trajectories of observed values over time.
+
−276.1 +
ln (Y0 )
⎫
⎪
2⎪
⎬
0.9233
0.9233
4 × 1391t0
+ 276.1 − t0
ln (Y0 ) ⎪ ·
⎪
⎭
4
2
Residual, m ha
X0 =
0.9233
t0
-1
ˆ
Y = exp (X0 ) exp − (−276.1 + 1391/X0 ) t−0.9233 , with
−0.9233
0.5t0
6
2
radiata pine plantations in Galicia. The model is expressed as
follows:
0
-2
-4
(4)
-6
0
20
40
60
2
3.2. Thinning effect on basal area growth
Equation (4) provided the best overall representation of
stand basal area development considering all the growth intervals both for thinned and unthinned plots, and explained a high
percentage of the total variance (99.35%). However, it was
also important to know if there were differences in the unitarea basal area growth between thinned and unthinned stands,
which would lead to inconsistent and biased stand basal area
projections.
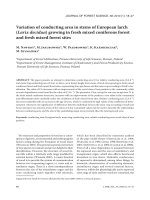
The effect of thinning was analyzed considering a new
dummy variable. The non-linear extra sum of squares method
used for detecting simultaneous homogeneity among parameters for both treatments did not reveal any significant differences (the null hypothesis of a unique stand basal area projection model for thinned and unthinned stands was accepted
80
100
-1
Predicted, m ha
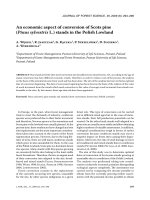
Figure 2. Plot of residuals versus predicted values of the stand basal
area projection function BA2 for unthinned (plus signs) and thinned
plots (circles).
because of a insignificant F-value of 2.57 at α = 0.05). Therefore, Equation (4) was considered for projecting stand basal
area for both thinned and unthinned stands. Examination of
the residuals – by applying Equation (4) to thinned and unthinned plots (Fig. 2) – did not indicate any trends in terms of
underestimation of the stand basal area of unthinned plots or
overestimation of the stand basal area of thinned plots.
All these results suggest that, for our data set, the stand
basal area growth pattern after thinning is close to the
stand basal area growth pattern of a stand with similar stand
616
F. Castedo-Dorado et al.
10
10
-1
15
Residual m ha
5
2
2
Residual, m ha
-1
15
0
-5
5
0
-5
-10
0
10
20
30
2
Predicted, m ha
40
-1
-10
500
1000
1500
N , trees ha
2000
2500
-1
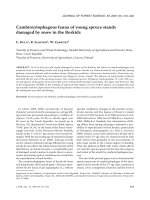
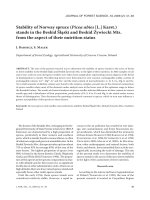
Figure 3. Plot of residuals versus predicted values and number of trees per hectare of the stand basal area initialization function derived from
model BA2 considering only site index as explanatory stand variable.
conditions but that has not been recently treated. Since the data
used to develop the model were obtained from both thinned
and unthinned stands, it seems reasonable to assume that the
thinning effect is built into the model. This is in accordance
with the studies of Clutter and Jones [25], Cao et al. [13],
Matney and Sullivan [47] and Barrio et al. [9] for different pine
species, which have demonstrated that there is no difference in
the unit-area basal area growth in thinned and unthinned stands
of the same age, site index and stand basal area.
This result, however, contradicts those of some studies of
stand basal area growth of radiata pine in other regions. Espinel et al. [29] used a different formulation for estimating the
stand basal area growth before and after thinning operations in
the Basque Country (Northern Spain). A similar approach was
also reported by Woollons and Hayward [69] for radiata pine
in New Zealand. It has also been demonstrated for Chilean radiata pine plantations that the stand basal area of the thinned
plots exceeds that of the unthinned counterparts [61]. In this
case, a thinning response function depending on the intensity
of thinning, the time since last thinning and the age of the stand
at the thinning, was included in the projection model.
The apparently contradictory results of the thinning effect
on stand basal area growth for radiata pine plantations for
Galicia and these other regions may be at least partly attributed
to the experimental data sets used. In the present study we used
data derived from plots or thinning trials where mainly low or
moderate thinnings were carried out, whereas in New Zealand
and Chile, heavy thinnings are usually applied. Nevertheless, it
must be taken into account that the studies involving thinning
experiments in even-aged stands showed inconsistent results
in terms of the effects of stand density variation on stand basal
area growth ([26], p. 68).
In summary, the assumption of no difference in the per unitarea basal area growth between thinned and unthinned stands
of the same age, site index, and stand basal area holds for our
data set, and therefore it was not necessary to incorporate any
thinning effect in the dynamic model (Eq. (4)).
3.3. Stand basal area initialization function
Once the stand basal area projection function was selected,
we focused our efforts on developing a compatible stand basal
area initialization function from Equation (4). Parameters b1 ,
b2 , and b3 were substituted in the base equation of Korf (after replacing the site-specific parameters of the base equation
with the explicit function of X) with the values obtained for the
projection function, and the unknown site-dependent function
X was related to site variables. Firstly, X was substituted by a
power function of site index. The inclusion of site index in this
relationship is consistent with the philosophy of GADA, and
directly warrants compatibility between the projection and initialization functions because site index is considered as a stable stand attribute over time. Under these conditions, the initialization function explained 61.8% of the total variance, with
a RMSE or 5.315 m2 ha−1 , and provided a pattern of residuals with homogeneous variance but with significant trends
both against predicted stand basal area and observed number
of trees per hectare (Fig. 3).
We therefore analyzed the inclusion into the previous model
of other stand variables that may affect the amount of stand
basal area at any specific moment (theoretically variables related to stand density), in order to improve the estimation capability of the initialization function at the expense of losing
compatibility. When the inverse of the number of trees per
hectare was included together with a power function of the site
index, the initialization equation explained 70.3% of the variance, with a RMSE of 4.688, and provided a random pattern of
residuals around zero with no detectable significant trends, for
either predicted stand basal area or observed number of trees
per hectare. This formulation provided significantly better estimates of stand basal area for any specific point in time.
The important improvement (almost an increase of 12.1%
in R2 and a reduction of 11.8% in RMSE) achieved by including the number of trees per hectare into the initialization
function led us to discard compatibility within the stand basal
area growth system. At this point, it seemed unnecessary to
force the development of the initialization equation considering the same base model of the projection equation. Following the methods of several authors (e.g., [6, 54], we analyzed
several linear and nonlinear models with different explanatory
stand variables (age, dominant height, site index, number of
trees per hectare, relative spacing index, and combinations of
these variables). A linear model with stand age, site index, and
number of trees per hectare as independent variables behaved
best. This model explained 72.5% of the total variance of the
data (15.2% more than the compatible model), with a RMSE
Stand basal area growth model for radiata pine plantations
5
5
2
Residual m ha
-1
10
2
Residual m ha
-1
10
0
-5
-10
0
10
20
30
2
Predicted, m ha
0
-5
-10
600
40
1000
1200
1400
N , trees ha
1800
2000
5
-1
5
1600
-1
10
2
2
Residual m ha
-1
800
-1
10
Residual m ha
617
0
-5
-10
0
-5
-10
14
16
18
20
22
24
26
28
7
8
9
S, m
10
11
12
13
14
15
t , years
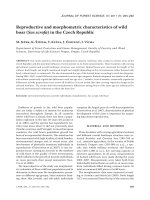
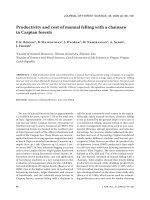
Figure 4. Plot of residual versus predicted values and the observed explanatory variables age, site index and number of trees per hectare of the
stand basal area initialization function selected (Eq. (5)).
of 4.595 m2 ha−1 (13.5% smaller than the compatible model),
and behaved logically: older stands on better sites and with
more trees per unit-area achieved higher values of stand basal
area. This model also provided a random pattern of residuals
around zero with no detectable significant trends for predicted
stand basal area and the observed explanatory variables stand
age, site index, and number of trees per hectare (Fig. 4).
The finally recommended initialization equation for radiata
pine plantations in Galicia is:
ˆ
Y = −52.23 + 2.676t + 1.306S + 0.0101N
(5)
where t is the age of the stand (years), S the site index (m,
defined as the dominant height of the stand at the reference
age of 20 years [27]), and N the number of trees per hectare.
4. CONCLUSIONS
Three well-known growth functions were considered for
developing a stand basal area growth system for radiata pine
plantations in northwestern Spain. Among the six dynamic
equations finally evaluated for stand basal area projection, the
GADA formulation from the Korf base model in which parameters a1 and a2 are considered to be site-specific behaved best.
Selection of the dynamic model was based on both numerical analysis and graphical representation of the fitted curves
overlaid on the trajectories of the observed stand basal area
over time. The selected equation allowed simulation of concurrent polymorphism and multiple asymptotes, two desirable
characteristics of growth equations. Furthermore, the dummy
variables method used for model fitting is a base-age invariant
method that accounts for site-specific and global effects and
fits the curves to observed individual trends in the data.
A linear stand basal area initialization function, in which
stand age, site index and number of trees per hectare were
considered as explanatory variables, was also developed. The
stand basal area system is not compatible; however, this is not
a major problem for most applications, because the initialization function would only be used to provide an initial value at
a given age for this variable, and not to project stand basal area
over time.
For the data set analyzed, the initial stand basal area and
age provided sufficient information about the future trajectory
of the stand basal area. It was therefore not necessary to consider the thinning effect in the dynamic model for projecting
stand basal area in thinned stands. These results were not consistent with those obtained by other authors for radiata pine
plantations in other regions, and may be due to the scarcity of
intensively treated plots in the experimental data.
Acknowledgements: This study was financed by the
Spanish Ministry of Education and Science; project No.
AGL2004-07976-C02-01. We thank Dr. Christine Francis for
correcting the English grammar of the text.
REFERENCES
[1] Álvarez Álvarez P., Viveros forestales y uso de planta en repoblación en Galicia, Ph.D. thesis, Universidade de Santiago de
Compostela, 2004.
[2] Álvarez González J.A., Castedo F., Ruiz A.D., López C., Gadow
K.v., A two-step mortality model for even-aged stands of
618
F. Castedo-Dorado et al.
Pinus radiata D. Don in Galicia (Northwestern Spain), Ann. For.
Sci. 61 (2004) 439–448.
[3] Amaro A., Reed D.D., Themido I., Tomé M., Stand growth modelling for first rotation Eucalyptus globulus Labill. in Portugal, in:
Amaro A., Tomé M. (Eds.), Empirical and process-based models
for forest tree and stand growth simulation, 1997, pp. 99–110.
[4] Amaro A., Tomé M., Themido I., ALBA, un modelo de crescimento em área basal para povoamentos de eucalipto, in: Puertas
F., Rivas M. (Eds.), II Congreso Forestal Español-Irati 97, 1997,
vol. IV, pp. 39–44.
[5] Amateis R.L., Modeling response to thinning in loblolly pine plantations, South. J. Appl. For. 24 (2000) 17–22.
[6] Amateis R.L., Radtke P.J., Burkhart H.E., TAUYIELD: A standlevel growth and yield model for thinned and unthinned loblolly
pine plantations, Va. Polytech. Inst. State Univ. Sch. For. Wildl.
Resour. Report No. 82, 1995.
[7] Bailey R.L., Clutter J.L., Base-age invariant polymorphic site
curves, For. Sci. 20 (1974) 155–159.
[8] Bailey R.L., Ware K.D., Compatible basal area growth and yield
model for thinned and unthinned stands, Can. J. For. Res. 13 (1983)
563–571.
[9] Barrio M., Castedo F., Diéguez-Aranda U., Álvarez González J.G.,
Parresol B.R., Rodríguez R., Development of a basal area growth
system for maritime pine in northwestern Spain using the generalized algebraic difference approach, Can. J. For. Res. 36 (2006)
1461–1474.
[10] Bates D.M., Watts D.G., Nonlinear regression analysis and its applications, John Wiley & Sons, New York, 1988.
[11] Bertalanffy L.v., Problems of organic growth, Nature 163 (1949)
156–158.
[12] Bertalanffy L.v., Quantitative laws in metabolism and growth, Q.
Rev. Biol. 32 (1957) 217–231.
[13] Cao Q.V., Burkhart H.E., Lemin R.C. Jr., Diameter distributions and
yields of thinned loblolly pine plantations, Va. Polytech. Inst. State
Univ. Sch. For.Wildl. Resour. Publ. FWS-1-82, 1982.
[14] Castedo F., Modelo dinámico de crecimiento para las masas de
Pinus radiata D. Don en Galicia. Simulación de alternativas selvícolas con inclusión del riesgo de incendio, Ph.D. thesis, Universidad
de Santiago de Compostela, 2004.
[15] Castedo F., Álvarez González J.G., Construcción de una tarifa de
cubicación con clasificación de productos para Pinus radiata D.
Don en Galicia basada en una función de perfil del tronco, Invest.
Agrar.: Sist. Recur. For. 9 (2000) 253–268.
[16] Castedo F., Diéguez-Aranda U., Barrio M., Sánchez Rodríguez
M., Gadow K.v., A generalized height-diameter model including
random components for radiata pine plantations in Northwestern
Spain, For. Ecol. Manage. 229 (2006) 202–213.
[17] Chikumbo O., Mareels I.M., Turner B.J., Predicting stand basal area
in thinned stands using a dynamic model, For. Ecol. Manage. 116
(1999) 175–187.
[18] Cieszewski C.J., Three methods of deriving advanced dynamic site
equations demonstrated on inland Douglas-fir site curves, Can. J.
For. Res. 31 (2001) 165–173.
[19] Cieszewski C.J., Comparing fixed-and variable-base-age site equations having single versus multiple asymptotes, For. Sci. 48 (2002)
7–23.
[20] Cieszewski C.J., Developing a well-behaved dynamic site equation
using a modified Hossfeld IV function Y3 = (axm)/(c + xm-1), a
simplified mixed-model and scant subalpine fir data, For. Sci. 49
(2003) 539–554.
[21] Cieszewski C.J., GADA derivation of dynamic site equations with
polymorphism and variable asymptotes from Richards, Weibull,
and other exponential functions. University of Georgia PMRC-TR
2004-5, 2004.
[22] Cieszewski C.J., Bailey R.L., Generalized algebraic difference approach: theory based derivation of dynamic equations with polymorphism and variable asymptotes, For. Sci. 46 (2000) 116–126.
[23] Cieszewski C.J., Harrison M., Martin S.W., Practical methods for
estimating non-biased parameters in self-referencing growth and
yield models, University of Georgia PMRC-TR 2000-7, 2000.
[24] Clutter J.L., Compatible growth and yield models for loblolly pine,
For. Sci. 9 (1963) 354–371.
[25] Clutter J.L., Jones E.P., Prediction of growth after thinning in oldfield slash pine plantations, USDA For. Serv. Res. Pap. SE-217,
1980.
[26] Clutter J.L., Fortson J.C., Pienaar L.V., Brister H.G., Bailey R.L.,
Timber management: a quantitative approach, John Wiley & Sons,
Inc. New York, 1983.
[27] Diéguez-Aranda U., Burkhart H.E., Rodríguez R., Modelling dominant height growth of radiata pine (Pinus radiata D. Don) plantations in northwestern Spain, For. Ecol. Manage. 215 (2005) 271–
284.
[28] Diéguez-Aranda U., Castedo F., Álvarez González J.G., Funciones
de crecimiento en área basimétrica para masas de Pinus sylvestris L.
procedentes de repoblación en Galicia, Invest. Agrar.: Sist. Recur.
For. 14 (2005) 253–266.
[29] Espinel S., Cantero A., Sáenz D., Un modelo de simulación para rodales de Pinus radiata D. Don en el País Vasco, in: Puertas F., Rivas
M. (Eds.), II Congreso Forestal Español- Irati 97, 1997, vol. IV,
pp. 201–206.
[30] Falcao A., DUNAS – A growth model for the National Forest of
Leiría, in: Amaro A., Tomé M. (Eds.), Empirical and process-based
models for forest tree and stand growth simulation, 1997, pp. 145
153.
[31] Fonseca T.J.F., Modelaỗóo do crescimento, mortalidade e distribuiỗóo diamộtrica, do pinhal bravo no vale do Tâmega, Ph.D. thesis, Universidade de Trás-os-Montes e Alto Douro, 2004.
[32] Gadow K.v., Real P., Álvarez González J.G., Modelización del crecimiento y la evolución de los bosques, IUFRO World Series, vol. 12,
Vienna, 2001.
[33] García O., A stochastic differential equation model for the height
growth of forest stands, Biometrics 39 (1983) 1059–1072.
[34] Hamilton C.J., The effects of high intensity thinning on yield,
Forestry 54 (1981) 1–15.
[35] Hasenauer H., Burkhart H.E., Amateis R.L., Basal area development in thinned and unthinned loblolly pine plantations, Can. J. For.
Res. 27 (1997) 265–271.
[36] Hein S., Dhôte J.F., Effect of species composition, stand density
and site index on the basal area increment of oak trees (Quercus
sp.) in mixed stands with beech (Fagus sylvatica L.) in Northern
France, Ann. For. Sci. 63 (2006) 457–467.
[37] Hirsch R.P., Validation samples, Biometrics 47 (1991) 1193–1194.
[38] Hossfeld J.W., Mathematik für Forstmänner, Ökonomen und
Cameralisten (Gotha, 4. Bd., S. 310), 1822.
[39] Hynynen J., Predicting the growth response to thinning for Scots
pine stands using individual-tree growth models, Silva. Fenn. 29
(1995) 225–247.
[40] Knoebel B.R., Burkhart H.E., Beck D.E., A growth and yield model
for thinned stands of yellow-poplar, For. Sci. Monograph 27, 1986.
[41] Kotze H., Vonck D., A growth simulator and pruning scheduler
for Pinus patula in Mpumalanga-North Province, South Africa, in:
Amaro A., Tomé M. (Eds.), Empirical and process-based models
for forest tree and stand growth simulation, 1997, pp. 205–221.
[42] Kozak A., Kozak R.A., Does cross-validation provide additional information in the evaluation of regression models? Can. J. For. Res.
33 (2003) 976–987.
[43] Krumland B., Eng H., Site index systems for major young-growth
forest and woodland species in northern California, Cal. Dep.
Forestry and Fire Protection, Calif. For. Rep. No. 4, 2005.
Stand basal area growth model for radiata pine plantations
[44] Lei Y., Modelling forest growth and yield of Eucalyptus globulus
Labill. in central-interior Portugal, Ph.D. thesis, Universidade de
Trás-os-Montes e Alto Douro, 1998.
[45] López Sánchez C.A., Gorgoso J., Castedo F., Rojo A., Rodríguez
R., Álvarez J.G., Sánchez F., A height-diameter model for Pinus
radiata D. Don in Galicia (Northwest Spain), Ann. For. Sci. 60
(2003) 237–245.
[46] Lundqvist B., On the height growth in cultivated stands of pine and
spruce in Northern Sweden, Medd. Fran Statens Skogforsk. Band
47 (1957) 1–64.
[47] Matney T.G., Sullivan A.D., Compatible stand and stock tables for
thinned and unthinned loblolly pine stands, For. Sci. 28 (1982) 161–
171.
[48] McDill M.E., Amateis R.L., Measuring forest site quality using the
parameters of a dimensionally compatible height growth function,
For. Sci. 38 (1992) 409–429.
[49] McTague J.P., Bailey R.L., Compatible basal area and diameter
distribution models for thinned loblolly pine plantations in Santa
Catarina, Brazil, For. Sci. 33 (1987) 43–51.
[50] Myers R.H., Classical and modern regression with applications, 2nd
ed., Duxbury Press, Belmont, California, 1990.
[51] Northway S.M., Fitting site index equations and other selfreferencing functions, For. Sci. 31 (1985) 233–235.
[52] Pienaar L.V., An approximation of basal area growth after thinning
based on growth in unthinned plantations, For. Sci. 25 (1979) 223–
232.
[53] Pienaar L.V., Shiver B.D., An analysis and models of basal area
growth in 45-year-old unthinned and thinned slash pine plantation
plots, For. Sci. 30 (1984) 933–942.
[54] Pienaar L.V., Shiver B.D., Basal area prediction and projection
equations for pine plantations, For. Sci. 32 (1986) 626–633.
[55] Pienaar L.V., Turnbull K.J., The Chapman-Richards generalization
of von Bertalanffy’s growth model for basal area growth and yield
in even-aged stands, For. Sci. 19 (1973) 2–22.
[56] Pienaar L.V., Shiver B.D., Grider G.E., Predicting basal area growth
in thinned slash pine plantations, For. Sci. 31 (1985) 731–741.
[57] Richards F.J., A flexible growth function for empirical use, J. Exp.
Bot. 10 (1959) 290–300.
[58] Rodríguez R., Sánchez F., Gorgoso J., Castedo F., López C., Gadow
K.v., Evaluating standard treatment options for Pinus radiata
619
plantations in Galicia (north-western Spain), Forestry 75 (2002)
273–284.
[59] Ryan T.P., Modern regression methods, John Wiley & Sons, New
York, 1997.
[60] Sánchez F., Rodríguez R., Rojo A., Álvarez J.G., López C., Gorgoso
J., Castedo F., Crecimiento y tablas de producción de Pinus radiata
D. Don en Galicia, Invest. Agrar.: Sist. Recur. For. 12 (2003) 65–83.
[61] Sánchez J., Methodology to increase resolution of the Growth and
Yield simulator for Pinus radiata D. Don in Chile, in: Álvarez
J.G., Goulding C., Rojo A., Rodríguez R., Zoralioglu T., Ruiz A.D.
(Eds.), Proceedings of the IUFRO Conference: The economics and
management of high productivity plantations, 2004.
[62] SAS Institute Inc., SAS/ETS
Institute Inc., 2004.
9.1 User’s Guide. Cary, NC: SAS
[63] SAS Institute Inc., SAS/STAT
Institute Inc., 2004.
9.1 User’s Guide. Cary, NC: SAS
[64] Sharma M., Smith M., Burkhart H.E., Amateis R.L. Modeling the
impact of thinning on height development of dominant and codominante trees, Ann. For. Sci. 63 (2006) 349–354.
[65] Sullivan A.D., Clutter J.L., A simultaneous growth and yield model
for loblolly pine, For. Sci. 18 (1972) 76–86.
[66] Tomé M., Falcao A., Amaro A., Globulus V1.0.0: A regionalised
growth model for Eucalypt plantations in Portugal, in: Ortega A.,
Gezan S. (Eds.), Proceedings of the IUFRO Conference: Modelling
growth of fast-grown tree species, 1997, pp. 138–145.
[67] Tomé M., Ribeiro F., Soares P., O modelo Globulus 2.1, Universidad
Técnica de Lisboa-ISA, Relatórios Técnico-científicos do GIMREF
n◦ 1, 2001.
[68] Van Laar A., Akỗa A., Forest Mensuration. Cuvillier Verlag,
Göttingen, 1997.
[69] Woollons R.C., Hayward W.J., Revision of a growth and yield
model for radiata pine in New Zealand, For. Ecol. Manage. 11
(1985) 191–202.
[70] Xunta de Galicia, O monte galego en cifras. Dirección Xeral
de Montes e Medio Ambiente Natural, Consellería de Medio
Ambiente, Santiago de Compostela, 2001.
[71] Zarnoch S.J., Feduccia D.P., Baldwin V.C., Dell T.R., Growth and
yield predictions for thinned and unthinned slash pine plantations
on cutover sites in the West Gulf region, USDA Forest Service Res.
Pap. SO-264, 1991.