Báo cáo khoa học: "Lesions in the thymus and bone marrow in chicks with experimentally induced chicken infectious anemia disease" pot
Bạn đang xem bản rút gọn của tài liệu. Xem và tải ngay bản đầy đủ của tài liệu tại đây (1.33 MB, 9 trang )
JOURNAL OF
Veterinary
Science
J. Vet. Sci. (2008), 9(1), 15
23
*Corresponding author
Tel: +90-212-473-70-70; Fax: +90-212-473-72-41
E-mail:
Lesions in the thymus and bone marrow in chicks with experimentally
induced chicken infectious anemia disease
Burak Kuscu, Aydin G
ü
rel*
Department of Pathology, Faculty of Veterinary Medicine, Istanbul University, Avcilar 34310, Istanbul, Turkey
One-day-old SPF chicks were inoculated with the Cux-l
strain of chicken infectious anemia virus (CIAV), and the
clinical development of disease and its macroscopic and
microscopic alterations in the thymus and bone marrow,
were observed. Tissue sections of thymus and bone marrow
were stained using the streptavidin-biotin peroxidase method
and examined under light microscope for evaluation of
antigenic intensities in tissues. Those findings were then
compared with blood parameters and ELISA results
obtained through collected sera during sacrifice procedures.
We sought to determine: the localization of viral antigens
in thymus and bone marrow tissues after inoculation, the
correlation between antigen intensities and hematologic,
serologic and histopathologic findings, definitive diagnostic
criteria using histopathologic and immunoperoxidase methods,
and the reliability of these methods in the diagnosis of CIAV
infection. For this purpose, 83, one-day-old SPF chicks
were used. The birds were divided into experimental (n =
52) and control (n = 26) groups. A virus dose of TCID50 of
100,000/ml was administered intramuscularly to every
bird in the experimental group. Based on the results of this
study, we have suggested that clinical examination, along
with macroscopic and microscopic evaluation of the thymus
and bone marrow, maybe undertaken starting from day 7
post-inoculation (PI). ELISA, might be of value, as it
might give consistent results starting from day 14 PI.
However, the most reliable results were obtained through
examination of thymus and bone marrow sections from
infected birds stained by immunoperoxidase technique, as
early as day 4 PI.
Keywords: bone marrow, chicken infectious anemia, histo-
pathology, immunohistopathology, thymus
Introduction
The causative agent of chicken infectious anemia (CIA),
which was first isolated in Japanese poultry by Yuasa et al.
[28], is not considered to be ubiquitous all over the world.
The causative agent is a circular, single-stranded DNA
virus: chicken infectious anemia virus (CIAV) [23]. Packed
cell volumes (PCV) of less than 25% have been detected in
this disease [16,17,23,28]. The disease may pose a significant
economic threat to the broiler industry [2]. Although it has
not yet been officially confirmed, the Turkish poultry
industry also seems to be affected by CIA, based on the
results of two reports published independently, by Ergün et
al. [4] and Yilmaz et al. [27].
The aim of this study was to observe the clinical,
microscopic, and macroscopic changes caused by CIAV
and to detect CIAV antigens immunohistochemically by
using the streptavidin-biotin peroxidase technique in
thymus and bone marrow tissues of one-day-old chicks
infected with CIAV. We additionally sought to find out the
first localization sites of the viral antigens and to clarify the
correlation between the histopathologic observations
made by routine light microscopy and staining intensity
revealed by streptavidin-biotin peroxidase technique. The
most important goal of the study was to frame diagnostic
criteria and evaluate the reliability of these techniques in
the diagnosis of CIA.
Materials and Methods
Animals
Eighty-three, one-day-old SPF white leghorn chicks were
used in this study. Five randomly selected chicks were
sacrificed before virus inoculation, and their blood sera
were analyzed using ELISA to confirm the absence of
antibodies against CIAV. Fifty-two of the chicks (experimental
group) were inoculated with CIAV and placed in a floor
pen, while the remaining 26 chicks were used as the control
group.
16 Burak Kuscu et al.
Tabl e 1 . Sacrifice and sampling dates and number of birds,
b
efore
and after virus inoculation
Days
Sacrificed/ sampled
Experimental group
Control group
1*
3
4
5
7
8
10
12
13
14
17
20
25
28
30
2
2
4
4
4
4
4
4
4
4
4
4
4
4
5
1
1
2
2
2
2
2
2
2
2
2
2
2
2
Total 52 31
*Only for day 1, sacrifice procedures were performed before virus
inoculation.
Experimental design
Cux-l isolate of CIAV with TCID
50
= 100,000/ml
(obtained from the Veterinary Medical Research Institute
of the Hungarian Academy of Sciences) was used in this
study. Each bird was inoculated with 0.5 ml of virus
suspension. Both groups of birds were fed ad libitum by a
commercial layer starter feed. Pre-boiled and re-cooled tap
water was supplied ad libitum to both groups. Two blood
samples were obtained during the sacrifice procedure,
according to the experimental design shown in Table 1,
separately from each bird respectively, for hemogram and
ELISA tests. A first blood sample from each bird was col-
lected in a tube containing a sufficient amount of EDTA,
while a second sample was collected in a sterile centrifuge
tube. Samples for hemogram tests were evaluated using an
electronic cell counter, within one hour after sampling. The
sera samples, which were collected in sterile tubes, were
kept at 20°C for the ELISA test.
Immunostaining procedure
The primary antibody, which is cell supernatant of a
monoclonal antibody specific for VP3, was obtained from
the Institute for Animal Science and Health (ID-DLO;
Netherlands), and was used for the streptavidin-biotin
peroxidase technique. The antibody was intended for use at
a dilution of 1:100. A commercially available test kit
(LSAB-2 kit, Dako, USA) containing both goat
anti-mouse and anti-rabbit IgG conjugated with biotin, was
used in this study. Standard techniques were used for the
streptavidin-biotin staining procedures [20,26]. Each
staining lot included at least one known positive and one
known negative tissue. Antigen retrieval was achieved
using the microwave-based antigen retrieval technique
[11,24] with a working dilution (1:10) of a commercially
available antigen retrieval Citra solution (pH 6.0; BioGenex,
USA) and a kitchen type microwave oven (Arçelik,
Turkey). Endogenous peroxidase activity was quenched
by incubating the tissues 20 min with a methanol solution
containing 0.1 ml of 3% H
2
O
2
. All washing steps were
performed by using Tris buffer solution (TBS; Dako,
USA), and all incubations were done in room temperature
conditions. The tissues were incubated with l:20 dilution
of normal goat serum in TBS for 20 min in order to prevent
non-specific binding of the secondary antibody. Each slide
was incubated with the anti-CIAV monoclonal antibody
for 30 min. The link solution (biotin conjugated anti-
mouse and anti-rabbit IgG) and peroxidase conjugated
streptavidin, which were commercially supported within
the kit (LSAB-2 kit; Dako, USA), were applied for 15 min.
In order to obtain a brown colored reaction product on
antigenic sites, a chromogen/substrate solution containing
0.02 % H
2
O
2
and l mg of diaminobenzidine per ml was
applied to the tissues and incubated for 10 min. The slides
were counterstained with Mayer’s hematoxylin (Dako,
USA) and mounted with Glycer-Gel (Dako, USA).
Methods
Together with the 5 birds sacrificed on day l prior to virus
inoculation procedures, thymus and bilateral femoral bone
samples were collected from all birds at various time
intervals, as shown in Table 1. The tissues were then fixed
in 10% formalin solution for 18 to 24 h. All tissue
specimens, except femoral bone samples, were routinely
processed. Femoral bone samples were decalcified in a
17% EDTA solution for an additional period of 18 to 24 h.
3 and 5 µm thick sections were prepared from each organ
sample, using a rotary microtome. 3 µm thick sections
were used in streptavidin-biotin staining technique and
5 µm thick sections were stained with hematoxylin and
eosin.
Statistical analyses
The mean, standard deviation, and significant values of
the data obtained were determined by Duncan’s test [3], as
groups comprising the days 1-7, 8-10, 12-14, 17-20, 25-28,
and 30.
Lesions in the thymus and bone marrow in chicks with CIA 17
Tabl e 2 . Comparison of average live weight at different days afte
r
CIAV infection
Days
Groups
Experiment group (n)
†
Control group (n)
1-7
8-10
12-14
17-20
25-28
30
*46.84 ± 3,049
d,A
(12)
51.60 ± 3,606
d,A
(8)
65.78 ± 6,225
c,A
(12)
71.73 ± 10,253
c,A
(8)
80.75 ± 12,824
b,A
(8)
135.20 ± 11,703
a,A
(4)
49.03 ± 2,530
d,A
(11)
55.30 ± 5,281
c,d,A
(4)
68.22 ± 13,374
c,d,A
(6)
72.78 ± 12,194
c,A
(4)
95.65 ± 6,859
b,A
(4)
148.65 ± 20,435
a,A
(2)
*Mean ±SD,
a, b, c, d
Each group designed with different letters are stat
-
istically significant (p < 0.05).
A
Difference between trial and con-
trol groups are statistically insignificant (p > 0.05).
†
n = number.
Table 3. Comparison of the optic density (O.D.) and sample / negative (S/N) value of the sacrificed chicken
Days
Experiment group Control Group
1 2 3412
O.D. S/N Result O.D. S/N Result O.D. S/N Result O.D. S/N Result O.D. S/N Result O.D. S/N Result
3
4
5
7
8
10
12
13
14
17
20
25
28
30
0.212
0.503
0.473
0.832
1.392
0.477
0.525
0.882
0.685
0.286
0.258
0.185
0.149
0.138
0.314
0.744
0.700
1.231
2.059
0.706
0.777
1.305
1.013
0.423
0.382
0.274
0.220
0.204
+
+
+
+
+
+
0.373
0.472
0.450
0.459
0.580
0.461
0.207
0.502
0.390
0.168
0.255
0.589
0.336
0.169
0.552
0.698
0.666
0.679
0.858
0.682
0.306
0.743
0.577
0.249
0.377
0.871
0.497
0.250
+
+
+
+
+
+
+
0.510
0.342
0.481
0.643
0.582
1.279
0.317
0.221
0.336
0.257
0.502
0.333
0.754
0.506
0.712
0.951
0.861
1.892
0.469
0.327
0.497
0.380
0.743
0.439
+
+
+
+
+
+
0.598
0.350
0.562
0.507
0.610
0.858
0.298
0.308
0.182
0.297
0.109
1.051
0.885
0.518
0.831
0.750
0.902
1.269
0.441
0.456
0.269
0.439
0.161
1.555
+
+
+
+
+
+
0.461
0.515
0.334
0.500
0.610
1.720
0.542
0.939
1.105
0.749
0.973
0.585
0.555
0.514
0.682
0.762
0.509
0.740
0.902
2.544
0.802
1.389
1.635
1.108
1.439
0.865
0.821
0.760
+
0.398
0.595
0.617
0.528
0.527
1.262
0.509
0.559
0.433
0.598
0.544
0.435
0.589
0.880
0.913
0.782
0.780
1.867
0.753
0.827
0.641
0.885
0.805
0.643
+
Results
Clinical findings
Clinical signs, including anorexia, lethargy, and
listlessness characterized by drooping of both wings, were
observed in only two of the birds in the experimental
group, one at the fourteenth day and the other at the seven-
teenth day of the experiment. The symptoms progressed
over a 24 h period, and these birds were sacrificed for
examination (in their own groups, before a natural death
occurred). Although the live weights of the groups, which
were determined every day before the sacrifice, were
different, the difference between groups was statistically
insignificant. Weight values were found to be 4.46, 6.69,
3.57, 1.44, 15.57, and 9.09 percentage points lower in
experimental group animals sacrificed on day intervals
1-7, 8-10, 12-14, 17-20, 25-28 and 30, respectively (Table
2).
Necropsy findings
Between days 12 and 25 of the study, in the experimental
group, some of the birds’ beaks, wattles, and conjunctivae
were observed to have pale and yellowish color. Some of
the thymuses in the experimental group were observed to
be slightly hyperemic on day 8, and this seemed to be more
severe between days 10 and 14. Starting from day 14, this
hyperemia was observed to lose its severity, and slight
atrophy of the organs was observed. This atrophy was quite
prominent in most of the animals in the experimental group
until day 28. Starting from day 8, some of the bone
marrows of the birds in the experimental group kept their
pale, yellowish-pink color and fatty appearance, while the
marrows of the control group turned from a pink to a dark
red color. These findings were still detectable at day 17,
and the yellowish appearance was recognized only in the
diaphyseal zones of the bones of the experimental group on
day 20.
Hematologic and serologic findings
The most prominent hematologic findings were recorded
in PCV and RBC values, especially on the seventeenth to
18 Burak Kuscu et al.
Table 4. ELISA test results and scoring of histopathologic lesions and immunoperoxidase results in the bone marrow and thymus
Days Bird No. ELISA test results
Histopathologic lesions Immunoperoxidase staining results
Bone marrow Thymus Bone marrow Thymus
1
3
4
5
7
8
10
12
13
C1
C2
C3
C4
C5
E1
E2
C1
E1
E2
C1
E1
E2
E3
E4
C1
C2
E1
E2
E3
E4
C1
C2
E1
E2
E3
E4
C1
C2
E1
E2
E3
E4
C1
C2
E1
E2
E3
E4
C1
C2
E1
E2
E3
E4
C1
C2
N
N
N
N
N
P
P
N
N
N
N
N
N
N
N
P
P
N
N
N
P
N
N
N
N
N
N
N
N
N
N
N
N
N
N
N
P
N
N
N
N
N
N
N
N
N
N
+
+
+
+
++
++
++
++
+++
+++
+++
+++
+++
+++
+++
+++
+++
++
++
++
+
+
+
+
+
+
+
++
++
+
++
++
+++
+++
++
+++
+++
+++
+++
+++
+++
+++
+++
+
+
+
++
++
+
+
+++
+++
++
+++
+++
+++
+++
+++
+++
+++
+++
+++
+++
++
++
++
+
+
+
+
+
+
+
++
++
+
++
+++
+++
+++
+++
+++
+++
+++
+++
+++
+++
+++
++
Lesions in the thymus and bone marrow in chicks with CIA 19
Table 4. Continued
Days Bird No. ELISA test results
Histopathologic lesions Immunoperoxidase staining results
Bone marrow Thymus Bone marrow Thymus
14
17
20
25
28
30
E1
E2
E3
E4
C1
C2
E1
E2
E3
E4
C1
C2
E1
E2
E3
E4
C1
C2
E1
E2
E3
E4
C1
C2
E1
E2
E3
E4
C1
C2
E1
E2
E3
E4
C1
C2
N
P
P
P
N
N
P
P
P
P
N
N
P
P
P
P
N
N
P
N
P
P
N
N
P
P
N
P
N
N
P
P
P
N
N
N
+++
++
+++
++
++
+
+
++
+
+
+
+
+
+*
+*
+*
+*
+*
+*
+*
+++
+++
+++
+++
+++
++
++
+++
++
++
++
++
+
+*
+
+*
+*
+*
++
++
++
+
+
+
+
+
+
+
+
+++
++
+
+
++
++
++
+
+
+
+
C: control, e: experimental, n: negative, p: positive, −: normal (or no antigen specific staining), +: slight, ++: moderate, +++: severe,
*Hyperplasia.
twentieth day interval in the experimental group. In this
period, PCV values were found to be 8.65%, and RBC
values were found to be 7.9% lower than the control group
of birds examined. The differences were found to be
statistically insignificant (p > 0.05). Although the first
positive results of the ELISA were detected in two
experimental group birds sacrificed on day 3 and in two
control birds sacrificed on day 5, the most consistent
results from both groups were obtained on day 14 and later
(Tables 3 & 4).
Histopathologic findings
The first histopathologic changes noted in the thymuses
of the experimental group's birds were seen in a single bird
on day 4 and in two birds on day 5. All of the thymuses of
the experimental group's birds showed minor changes
20 Burak Kuscu et al.
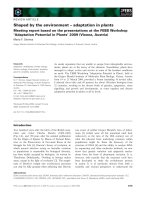
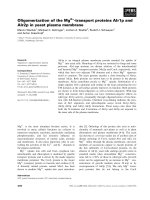
Fig. 1. (A) Normal appearance of the thymus of a bird from the
control group sacrificed on day 12. Scale bar = 200 µm. (B) Dep-
letion of the cortical thymocytes and medulla-like appearance o
f
the thymic cortex in the thymus section of a bird from the
experimental group sacrificed on day 12. Scale bar = 200 µm. (C
)
N
ormal appearance of the bone marrow of a bird from the control
group sacrificed on day 10. Scale bar = 100 µm. (D) A prominen
t
decrease in the number of cells in the bone marrow of a bird fro
m
the experimental group sacrificed on day 10. Scale bar = 100 µm.
H&E stain.
starting from day 7. Although, on day 4 and 5, those thymic
lesions were confined to small foci in the thymic cortex
which were defined by a few scattered cells staining paler
and showing marginal hyperchromasia in their nuclei,
those lesions seemed to extend, and some of these cells
showed large, eosinophilic inclusions in their nuclei on day
7. During the same time interval, microfocal areas of
coagulative necrosis were also prominent in the thymic
cortex of some of the experimental birds, and some of the
destructive areas were observed to be replaced by reticular
cells. Those lesions seemed to progress, develop and were
more significant and diffuse between days 8 and 10. It was
still possible to observe intranuclear eosinophilic inclu-
sions in these enlarged cells and in reticular cells situated
both in the medullar and the cortical areas. Starting from
day 7, hemorrhage was observed, especially in the subcap-
sular areas of the thymic cortex, and its appearance seemed
to be more significant and diffuse between days 10 and 12.
One of the most interesting findings recorded in the
thymuses of the animals in the experimental group was the
reduction in the size of the thymic cortex due to depletion
of cortical thymocytes, resembling the medullar zone,
between days 10 and 25. This finding was most prominent
between days 12 -14 (Figs. 1A & B). The first signs of
regeneration were observed on day 20, and mitotic activity
resulted in repopulation of cortical thymocytes until day 30
of the study (Table 4).
The first histopathologic changes detected in the bone
marrow sections of the experimental group’s animals was
characterized by the presence of a few, larger hemocy-
toblasts on day 7. These cells and intranuclear eosinophilic
inclusions were observed occasionally between days 8 and
10. In the mean time, the number of cells of the erythrocytic
and granulocytic series was found to be decreased, and the
empty spaces left behind were filled by adipose tissue
(Figs. 1C & D). Abundant osteoclasts and macrophages
were also found quite frequently around the degenerative
areas. Hematopoietic activity seemed to return to normal
levels starting from day 17. This condition was detectable
until the end of the experimental period (Table 4).
Immunoperoxidase findings
The first antigen-specific staining in the experimental
group’s birds’ thymus sections was recorded in one bird
sacrificed on day 4. Specifically stained cells were iden-
tified as a few large thymocytes that were closely situated
to each other, on the subcapsular zone of the thymic cortex,
within only one of the thymic lobules. The staining pattern
was quite similar to that of the birds which were sacrificed
on day 5, which was still limited to only a single lobe.
While all thymus sections were stained specifically in all
the birds sacrificed between days 7 and 14, only some cells
in different areas were found to be specifically stained in
experimental group animals sacrificed between days 17
and 25. Specifically stained sections were encountered to a
lesser degree in the cortex, and only a few stained cells
could be found in the medulla between days 7 and day 8. A
prominent increase in the number of specifically stained
cells was detected, and stained cells were also found to be
more abundant in the medullar zone. However, they did not
reach a frequency equal to the number present in the cortex
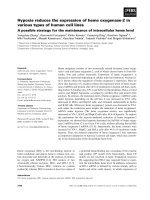
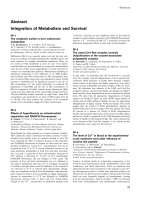
on day 10 (Fig. 2A). These specifically stained cells
showed a homogenous distribution in the medulla and
were indistinguishable in the cortex on days 12 (Fig. 2B).
Specifically stained cells could only be detected in the
thymus section of one bird in the experimental group on
day 25.
The first antigen specific staining in the bone marrow was
recorded in one bird from the experimental group sacri-
ficed on day 4. Specifically stained cells were identified as
large hemocytoblasts and reticulocytes situated in the
extrasinusoidal or intrasinusoidal spaces. Moreover, stem
cells that were in various stages of differentiation were also
determined to be stained specifically. The number of
stained cells showed an increase between days 8 and 10
(Figs. 2C & D). A decrease in the number of stained cells
was recorded at day 14 and afterwards. Specific staining
could be observed in only one experimental bird on day 25,
and no stained cell was encountered in the bone marrow
sections of birds sacrificed on day 28 and afterwards (Table
2).
Lesions in the thymus and bone marrow in chicks with CIA 21
Fig. 2. (A) Abundant antigen-specific staining in the cortex and, to a lesser extent, in the medulla of the thymus section of an
experimental bird sacrificed on day 10. Scale bar = 100 µm. (B) Antigen-specifically stained cells both in the depleted cortical and
medullar zones of the thymus section of an experimental bird sacrificed on day 12. Scale bar = 200 µm. (C) Antigen-specifically staine
d
large hemocytoblasts in the bone marrow section of an experimental bird sacrificed on day 8. Scale bar = 100 µm. (D)
Antigen-specifically stained hemocytoblasts and stem cells at different stages of differentiation in the bone marrow section of an
experimental bird sacrificed on day 10. Scale bar = 50 µm. Immunoperoxidase stain.
Discussion
As stated in much of the literature, CIAV infections have
become a worldwide economical problem, and their effect
is most likely to be observed in 2- to 4-week-old broilers, as
well as layers of the same age [2,16,18].
Although no significant change was found between the
mean values of live weights of the animals in the control
and the experimental groups, the mean live weight of the
experimental group was found to be consistently lower
throughout the entire experimental period, in comparison
with the control group. The results of Hoop [12], obtained
through inoculation of day-old Light Sussex chicks with
TCID
50
= l0
6
of a Scottish isolate of CIAV, were compatible
with the current study.
Despite the fact that there was no antigenic difference
between CIAV isolates in terms of cross-neutralization and
cross-immunofluorescence tests, the incidence of anemia
induced by different isolates of CIAV was reported to have
ranged between 0 and 88% [1,28]. Considering the dose
used in this study (50,000 TCID
50
/chick), it was possible to
induce the subclinical form of the disease. The incidence of
anemia in the experimental group was found to be within
the expected range. Although PCV values below 25-27%
were accepted as clinical anemia, recent studies have
indicated that neonatal physiological anemia can be
observed in avian species. The threshold of anemia for SPF
leghorn chicks should be accepted as PCV values lower
than 23, 25, 26, 28, 31, and 30% on days 3, 7, 14, 21, 28,
and 35, respectively [6-8]. All data obtained from clinical
observations, necropsies, and hemogram tests have illust-
rated the point that the pathological picture might be
variable, even between the birds infected with the same
dose of CIAV. It was difficult to identify the animals which
were experiencing the subclinical form of the disease.
Goodwin and Brown [5] indicated that anemia and atrophy
of hematopoietic organs are not sufficient criteria for the
diagnosis of CIAV infections. Practical methods are also
needed to confirm the disease in a virological, serological,
and pathological manner. Some authors have emphasized
the influence of genetic constitution, nutritional state, and
management conditions on the incidence of clinical mani-
festations and the severity of anemia in CIAV infections
[1,7,9].
The results of this study confirm that histopathologic
changes such as depletion of cells and increase in the
number of reticulocytes and general atrophy in the bone
marrow and thymus might be important evidences of CIAV
infection, although they are not considered pathognomonic
lesions, as stated by previous authors [10,15,25,28]. Thus,
22 Burak Kuscu et al.
we conclude that histopathologic changes might give a
clue to the diagnosis of CIAV infections. For differential
diagnosis, it is also important to consider sulfur intoxication,
mycotoxicoses, trichloroethylene intoxication, and con-
current infection with infectious bursal disease (IBD) virus
as well as adenovirus strains, some strains of Marek's
Disease (MD) virus, and osteopetrosis in the etiology of
aplastic anemia and pancytopenia. Moreover, it has repor-
ted that atrophy in the thymus cortex has been induced by
some strains of IBD [14]. The presence of inclusions
encountered in the reticulocytes and hemocytoblasts of the
bone marrow and cortical thymocytes and reticulocytes in
the thymus between post-inoculation days 8 and 10 were
also reported by other authors [10]. In contrast, there was
no evidence about the presence of inclusions in the reports
from natural outbreaks. This condition might have been
associated with the temporary character of those inclu-
sions, before the onset of clinical signs. Thus, it is possible
to say that clinical and histopathologic findings might have
revealed important evidences, but inclusions were unable
to be considered as an important finding in the diagnosis of
naturally occurring diseases.
In our study, the first positive serum antibody titers in the
experimental group were detected on day 3 and day 7,
while consistent positive results in the experimental group
were obtained starting from day 14. Results obtained from
the experimental and control birds sacrificed on day 3 and
day 5 were considered as non-specific false positives, based
on our consistent negative findings on routine histopa-
thologic and immunoperoxidase staining. On the basis of
our own findings and some of the relevant literature
[19,22], it has been suggested that in 1-day-old chicks
inoculated with CIAV, seropositivity by ELISA might be
obtained as early as day 7 or 8, while consistent positive
results might be achieved starting at day 14.
CIAV genome is reported to have three different Open
Reading Frames (ORF's), and these ORF's are responsible
for the synthesis of three viral proteins designed as VP1,
VP2, and VP3 [21]. VP1 is reported to be the capsid
protein, and VP1 and VP2 together are said to determine
the antigenic characteristics of the virus [21]. VP3 (also
termed “apoptin”) is reported to be only detectable in
virus-infected cells and is the particular indication of
apoptosis in the target cell [21,22]. The monoclonal anti-
body used in this study had the capability to specifically
bind VP3, enabling us to label virus-infected cells in
different stages of apoptosis. It also had the advantage of
directly labeling the antigen, compared to ELISA, which
can only give an idea about the antibody status against the
disease, but cannot describe whether the antibodies present
are maternally derived or acquired as a response to direct
infection. In birds infected with CAV at one day of age,
consistent results were observed in the examination of
thymus sections obtained between the seventh and seventeenth
days, and in bone marrow sections obtained between the
thirteenth and seventeenth days. These results are sup-
ported by the reports of parallel studies [13,15,18,25] and
also by our observations from routine histopathologic
examinations.
The two main target organs affected by CIAV were
determined to be the bone marrow and thymus, on the basis
of our viral antigen detection studies by the streptavidin-
biotin peroxidase technique. The severity of histopathologic
lesions and antigen staining intensities detected by the
immunoperoxidase technique used in this study showed a
positive correlation, particularly for thymus and bone
marrow sections.
It was determined that for birds infected via the intramuscular
route on the day of hatch, histopathological alterations
were detectable in the thymus and bone marrow starting
from day 10, and labeling of CIAV antigens was possible
between days 4 and 25. It is possible to say that the
streptavidin-biotin peroxidase technique involving a
monoclonal antibody like the one we used in this study
enables early and specific diagnosis of CIAV infections.
The earliest and most reliable results can be obtained by the
immunoperoxidase technique using a monoclonal antibody
like the one we used in this study, considering that immu-
noperoxidase techniques are quite practical and do not
require expensive equipments such as fluorescent micro-
scopes. Attempts to produce various monoclonal antibodies,
not only against CIAV but also against other pathogens,
would be of great help for pathologists, in order to enable
the early and reliable diagnosis of various infections, even
in poorly equipped laboratories.
References
1. Bülow VV. Avian infectious anemia and related syndromes
caused by chicken anemia virus. Crit Rev Poult Biol 1991, 3,
1-17.
2. B
ülow VV, Sebat KA. Chicken infectious anemia. In:
Calnek BW, Barnes HJ, Beard CW, McDonald LR, Saif YM
(eds.). Disease of Poultry. 10th ed. pp.739-756, Iowa State
University Press, Ames, 1997.
3. Duncan DB. Multiple range and multiple F tests. Biometrics
1955, 11, 1-42.
4. Erg
ün A, Yurtman M, Nalbantsoy A. A sero-survey study
on chicken anemia (CAV) by ELISA test. Ciftlik 1998, 171,
44-46.
5. Goodwin MA, Brown J. Inability of so-called chicken ane-
mia agent (CAA) infections to be diagnosed by anemia and
hematopoietic organ atrophy alone. Avian Dis 1992, 36,
353-355.
6. Goodwin MA, Brown J, Davis JF, Girshick T, Miller SL,
Nordgren RM, Rodenberg J. Comparisons of packed cell
volumes (PCVs) from so-called chicken anemia agent (CAA;
a virus)-free broilers to PCVs from CAA-free specific-patho-
gen-free leghorns. Avian Dis 1992, 36, 1063-1066.
7. Goodwin MA, Brown J, Latimer KS, Miller SL. Packed
Lesions in the thymus and bone marrow in chicks with CIA 23
cell volume reference intervals to aid in the diagnosis of ane-
mia and polycythemia in young leghorn chickens. Avian Dis
1991, 35, 820-823.
8. Goodwin MA, Davis JF, Brown J. Packed cell volume ref-
erence intervals to aid in the diagnosis of anemia and poly-
cythemia in young broiler chickens. Avian Dis 1992, 36,
440-443.
9. Goodwin MA, Smeltzer MA, Brown J, Girshick T,
McMurray BL, McCarter S. Effect of so-called chicken
anemia agent maternal antibody on chick serologic con-
version to viruses in the field. Avian Dis 1993, 37, 542-545.
10. Goryo M, Suwa T, Umemura T, Itakura C, Yamashiro S.
Histopathology of chicks inoculated with chicken anemia
agent (MSB1-TK5803 strain). Avian Pathol 1989, 18, 73-89.
11. Gown AM, de Wever N, Battifora H. Microwave-based an-
tigenic unmasking. A revolutionary new technique for rou-
tine immunohistochemistry. Appl Immunohistochem 1993,
1, 256-266.
12. Hoop RK. Persistence and vertical transmission of chicken
anemia agent in experimentally infected laying hens. Avian
Pathol 1992, 21, 493-501.
13. Hoop RK, Reece RL. The use of immunofluorescence and
immunoperoxidase staining in studying the pathogenesis of
chicken anemia agent in experimentally infected chickens.
Avian Pathol 1991, 20, 349-355.
14. Inoue M, Fukuda M, Miyano K. Thymic lesions in chicken
infected with infectious bursal disease virus. Avian Dis 1994,
38, 839-846.
15. Jeurissen SH, Pol JM, de Boer GF. Transient depletion of
cortical thymocytes induced by chicken anaemia agent.
Thymus 1989, 14, 115-123.
16. McIlroy SG, McNulty MS, Bruce DW, Smyth JA, Goodall
EA, Alcorn MJ. Economic effects of clinical chicken anemia
agent infection on profitable broiler production. Avian Dis
1992, 36, 566-574.
17. McNeilly F, Allan GM, Moffett DA, McNulty MS.
Detection of chicken anemia agent in chickens by immuno-
fluorescence and immunoperoxidase staining. Avian Pathol
1991, 20, 125-132.
18. McNulty MS. Chicken anemia agent: a review. Avian Pathol
1991, 20, 187-203.
19. Michalski WP, O'Rourke D, Bagust TJ. Chicken anemia
virus antibody ELISA: problems with non specific reactions.
Avian Pathol 1996, 25, 245-254.
20. Naish S. Handbook of immunochemical staining methods.
pp. 16-20, Dako, California, 1989.
21. Noteborn MHM, Koch G. Chicken anemia virus infection:
molecular basis of pathogenicity. Avian Pathol 1995, 24,
11-13
22.
Otaki Y, Saito K, Tajima M, Nomura Y. Persistence of ma-
ternal antibody to chicken anemia agent and its effect on the
susceptibility of young chickens. Avian Pathol 1992, 21,
147-151.
23. Pope CR. Chicken anemia agent. Vet Immunol Immunopathol
1991, 30, 51-65.
24. Shi SR, Key ME, Kalra K. Antigen retrieval in formal-
in-fixed, paraffin-embedded tissues: an enhancement method
for immunohistochemical staining based on microwave oven
heating of tissue sections. J Histochem Cytochem 1991, 39,
741-748.
25. Smyth JA, Moffett DA, McNulty MS, Todd D, Mackie DP.
A sequential histopathologic and immunocytochemical study
of chicken anemia virus infection at one day of age. Avian Dis
1993, 37, 324-338.
26. Taylor CR. Immunoperoxidase techniques. Practical and
theoretical aspects. Arch Pathol Lab Med 1978, 102, 113-121
27. Yilmaz H, Turan N,
Özgür Y, Helps CR, Akay Ö.
Detection of chicken anemia virus DNA in thymus of natu-
rally Infected chicken in Turkey. Avian Dis 2001, 45,
529-533.
28. Yuasa N, Taniguchi T, Yoshida I. Isolation and some char-
acteristics of an agent inducing anemia in chicks. Avian
Pathol 1979, 23, 366-385.