TEAM FLY WIRELESS NETWORK DEPLOYMENTS phần 4 pps
Bạn đang xem bản rút gọn của tài liệu. Xem và tải ngay bản đầy đủ của tài liệu tại đây (800.17 KB, 28 trang )
70 Chapter 4
approximately 500 sectors, reducing to approximately 380 for a conversion
ratio of 1, when we deploy CDMA on every analog cell site within the
footprint.
However, as we increase the traffic the CDMA coverage starts to shrink.
The coverage provided by the cell sites along the border starts to shrink and
we are required to deploy more cell sites within the dual-mode footprint to
maintain the same coverage. As the coverage along the borders shrinks
slightly, the number of cells within the guard zone is also reduced. This
reduces the impact of the CDMA system on the underlying analog system
while increasing the traffic capacity of the analog system.
Table 1 illustrates the trend and shows the increase in the total traffic
(AMPS + CDMA) with respect to the traffic in the dual-mode footprint and
the size of the guard zone. As we increase the number of cell sites within the
dual-mode footprint we can increase the traffic that we can carry. As the
CDMA traffic increases we could opt to add an additional frequency to our
CDMA system. If we go to an additional frequency we double effectively
the CDMA capacity, though incurring an additional loss in the underlying
analog system. From Table 1, we see that only when the conversion rate is
around 0.84 or higher do we see that there is a benefit to going to another
frequency.
TEAMFLY
Team-Fly
®
Optimization of Dual Mode CDMA/AMPS Networks 71
Before the actual deployment uniform traffic amongst the cells is
typically assumed. However, in a real deployment scenario, the traffic
distribution will not be uniform, but will involve traffic hot spots. These hot
spots will use the resources of the neighboring cell sites. We consider the
baseline case of 27 CDMA cell sites within the dual-mode footprint
(conversion factor = 0.73). As shown in Table 1, the CDMA traffic carried
was 861 Erlangs.
To simulate the hotspot areas, the traffic in the center 7 dual-mode cells
was increased by 4 Erlangs/sector. This led to coverage holes, due to the
excess traffic around the center. The issue facing the service provider is
5
AMPS is assumed to have nominally 18 channels per sector, at 2% blocking and
CDMA to occupy 1.8 MHz of spectrum.
72
Chapter 4
whether to deploy more cell sites in the neighborhood of these hot spots, or
possibly go to an additional frequency. Table 2 shows the results of the 3
options. The first option of adding another CDMA carrier in the core led to
a reduction in the total traffic of 110 Erlangs. The second option of using
the additional carrier everywhere reduced the overall traffic that could be
carried by 530 Erlangs. This is mainly as a result of the excessive loss in
analog traffic capacity of 738 Erlangs. The third option in the scenario was
to increase the number of cell sites within the dual-mode footprint. For this
case it just takes an additional two sites to maintain the coverage objective
and results in an additional 197 Erlangs being carried.
Of course as the traffic increases we can use the inherent potential of the
additional carrier to allow for future growth. However, as seen in Table 2,
the addition of another carrier is not always the best alternative. It is also
clear that in defining the gain of CDMA over analog that the Erlang loss in
traffic carrying capacity in the guard zone must also be taken into account.
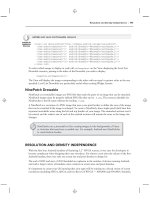
2.2 Impact of CDMA-to-AMPS Handdown Procedures on
Network Performance
Another important network optimization issue is the flawless network
operation at the boundaries of the dual-mode (mainly urban areas) and
analog only (typically more rural) areas. Mobile users in the border of a
CDMA coverage area—or on the edge of a “CDMA coverage hole”—must
be able to get their CDMA service gracefully handed down to the AMPS
system. Careful network engineering and optimization is required at the
borders so that the CDMA call is handed down to an explicitly specified
AMPS server well before the CDMA signal gets too weak and the call is
dropped. In a similar fashion, when there is a request for a call initiation in
the CDMA-AMPS boundaries, it may be necessary for the call to be
immediately handed over to the overlaid AMPS service.
To guarantee a flawless handdown procedure that is triggered and
controlled by the network, a CDMA-AMPS handown (CAH) region should
be identified at the boundary area between the CDMA and AMPS footprints.
This region should be (1) contiguous, to guarantee a consistent handdown
event along the CDMA-AMPS boundaries; and (2) not very wide, because
this leads to a considerable loss in the traffic supported by the CDMA cells
in the boundary of the dual-mode footprint. Typically, CAH strategies
involve CDMA beacons, border cells, explicitly defined pilot neighbor lists
Optimization of Dual Mode CDMA/AMPS Networks 73
for the sectors along the boundaries, and variable cell sizes
6
to facilitate a
flawless CDMA to AMPS handover of service. We limit our studies here to
the approaches based on border and beacon cells with variable cell sizes.
A border cell
7
is a regular CDMA server located in the CDMA-AMPS
boundary area. It is equipped with the additional functionality of first
triggering a CAH event and then transferring the CDMA call to the AMPS
server that is usually collocated with the border server
8
. During a border-
cell-assisted CAH, a mobile user is handed down to AMPS when both the
following two conditions are met: (1) all CDMA pilots in the user’s active set
should be configured for this handdown type (i.e., they are border servers as
well); and (2) the received CDMA pilot signal over the total interference
should be below a user-specified handdown threshold
T
brd
for all
pilots in the user’s active set.
A CDMA beacon is a pilot-only sector located in the dual-mode to
AMPS geographical border area. It does not carry any traffic but is rather
used to trigger a CAH event and maintain the necessary synchronization.
During a CDMA beacon assisted handdown, a user is handed down to an
AMPS server (usually collocated with the CDMA beacon) when at least one
CDMA beacon with received pilot power above a user-specified
threshold
T
beac
has been detected.
The sector cell size is a tuning parameter typically available on every
CDMA sector in the network. In deployed networks, due to the coverage
versus capacity tradeoffs, the serving areas of CDMA cells can vary
dynamically in size with the changing traffic conditions. Typical base station
equipment can be programmed with a distance/time related parameter
referred to as cell size to limit undesirable soft-handoffs and call initiations
from “weak” portables. A proper setting of the cell size helps eliminate
“rogue” pilots from entering the active set of a portable, especially from base
stations located far away with very tall antennas, or in areas of potential
“pilot-pollution” where the portable may have to change the status of its
active set much too often. Cell size is also important in facilitating intelligent
CAH strategies involving CDMA beacons. A CDMA-to-AMPS handdown
event that is assisted via the cell size parameter, denoted as C in our analysis,
6
This is a sector parameter which limits the distance within which the sector’s pilot will be
considered as a possible server or a handoff candidate.
7
By “border cell,” we mean a sector deployed in a regular CDMA base station which is on
the edge of the dual-mode network and its primary function is to seamlessly hand-down to
analog gracefully.
8
This is usually the case as it reduces confusion as to which analog carrier the signal should
be handed down too.
74 Chapter 4
at a CDMA beacon, necessitates that a user is handed down to an AMPS
server when (a) at least one CDMA beacon with received pilot power
above a user specified threshold has been detected and (b) the user’s
distance from the corresponding beacon is within the range C as defined by
the value of the cell size parameter set on that beacon.
We have conducted numerous simulations to study the impact of the
aforementioned CAH strategies on the performance of a dual-mode CDMA
network. The performance criteria used were the average capacity loss and
average handoff overhead per boundary cell. The average capacity loss per
boundary cell represents the loss in CDMA primary traffic carried by a
boundary cell with border or beacon sectors relative to the CDMA primary
traffic carried by the same boundary cell without any borders or beacons.
The average handoff overhead per boundary cell represents the ratio of total
CDMA traffic carried by a boundary cell over the CDMA primary traffic
carried by the same cell. It defines the additional number of channel
elements required to support handoff (virtual) traffic and provides an
indication of network efficiency. The effect of the tuning parameters
T
brd
,
and C on the system performance is described next. Additional details
may be found in [9,14].
The simulation is as described previously with similar parameters except
as noted below. The CDMA network considered is loaded at approximately
40% of its pole capacity. The voice coding with overhead is assumed at
14.4 kbps (rate set II). The nominal traffic channel power is set at 2.7 W
with a pilot channel power of 5.0 Watts. The remaining paging and sync
control channels have a total power of 2.2 Watts. Every cell site is assumed
to have a noise figure of 6 dB, cable loss of 2 dB and a 110 degree antenna
with a nominal gain of 11.0 dBd for both the CDMA and analog cells. One
CDMA channel is used from the cellular band centred at 881.52 MHz.
CDMA soft handoff parameters are set at negative 15 dB, and a
of 2.5 seconds is assumed.
CDMA Border-Cell-Assisted Handdown
We investigate the performance tradeoffs in network coverage, capacity
and handoff with respect to the number of border sectors deployed per
boundary site and the handdown threshold
T
brd
. One, two, or three border
sectors are deployed per boundary cell site and
T
brd
varies from –2 to –6 dB.
Figure 6(a) shows the variation of the average capacity loss versus the
handdown threshold
T
brd
. As the handdown threshold increases, the average
Optimization of Dual Mode CDMA/AMPS Networks 75
loss in capacity also increases. This is because the probability of having
CDMA border pilots in the active set decreases with an increase in
T
brd
,
resulting in more CAH events and hence a loss in CDMA traffic at the
boundary cells.
In addition, the loss in capacity increases as the number of deployed
border sectors per boundary cell increases. When one border sector is
deployed, no more than 20% of the offered CDMA traffic at the boundary
cell is handed down to AMPS. However, a contiguous CAH area cannot be
formed around the dual-mode footprint. The CAH area becomes contiguous
when two border sectors per boundary cell are deployed and the capacity
loss in this case is up to 50%. Finally, most of the CDMA traffic offered at
the boundary cells is handed down to analog when three border sectors per
boundary cell are deployed. However, in this case, the CDMA traffic loss
may be as high as 90%, causing the CDMA coverage to shrink by almost
one tier of cells.
Figure 6(b) shows the impact of handdown threshold T
brd
on the average
handoff overhead at the boundary cells. As the handdown threshold
increases, an increase in the handoff overhead is also observed; this increase
is more apparent in the case of three border sectors per cell. For the other
two cases, the impact of
T
brd
on the handoff overhead is not significant and
is similar to that observed in the case of no border sectors at the boundary
cell.
CDMA Beacon-Assisted Handdown
Alternatively, CDMA beacons were deployed either at the boundary
CDMA site or at the AMPS sites within the first tier of analog network
surrounding the CDMA footprint. The impact on the loss in capacity and
handoff overhead was studied by varying the handdown threshold
T
beac
from
–4 dB to –16 dB. Figure 7 (a) shows the variation of the average capacity
loss with the handdown threshold T
beac
. As observed, a decrease in
handdown threshold leads to an increase in the average capacity loss. This is
because the probability of having CDMA beacon pilots in the active set
increases with a decrease in T
beac
resulting in more CAH events and hence a
loss in CDMA traffic at the boundary cells.
At thresholds below –12 dB, there is no impact on the amount of traffic
handed down to analog because the interference at the boundary is lower
than that at the core of the CDMA footprint. The CAH strategy of placing
two beacons per cell leads to the highest loss in capacity on the order of
80%, causing the CDMA coverage to shrink by almost one tier. On the other
hand, placing beacons at the first tier of AMPS cells leads to the minimum
76 Chapter 4
loss in capacity. In particular, thresholds of the order of –8 dB lead to a
minimum loss in capacity while maintaining a contiguous CAH area. For
thresholds below –8 dB, a contiguous CAH area is maintained for all three
cases.
Optimization of Dual Mode CDMA/AMPS Networks 77
Figure 7 (b) shows the impact of handdown threshold
T
beac
on the
average handoff overhead at the boundary cells. Similarly with the average
capacity loss, a decrease in the handdown threshold leads to an increase in
the handoff overhead. Lowest handoff overheads are observed in the case
when one beacon sector is deployed at the AMPS sites outside the CDMA
footprint. In this case, the overhead is even lower than that observed when
these are no beacon sectors at the boundary cell. The impact of
T
beac
at
values above –12 dB is more apparent for CAH strategies involving one or
two beacons at the CDMA boundary cells.
Cell Size - Assisted Handdown
The last CAH strategy investigated involves the deployment of beacon
sectors with limited cell sizes at the network boundaries. Two sub-cases are
considered depending on the number of beacons (one or two respectively)
deployed on every CDMA site located at the boundary tier of the CDMA
network. To reduce the large search space, the handdown threshold was
fixed at –15 dB. Figure 8 shows the impact of varying cell size to the
average CDMA traffic loss per boundary cell and the associated handoff
overhead. As the cell size C increases, the CDMA traffic carried by the outer
sites decreases, or equivalently, the capacity loss increases. This lost CDMA
traffic is handed down to AMPS. This is expected, since a large cell size
defines a larger CAH region over which users are handed down to AMPS
when they detect a strong beacon pilot. In the case of one beacon deployed
per boundary site, the CDMA capacity loss increases from 15% to 57% as C
is varied from 0.5 to 1.5. A similar trend is observed when two beacons are
deployed per boundary site. However, the CDMA traffic carried in the latter
case is significantly less when compared to that of the former. This is
expected since only one sector in these sites is equipped to carry CDMA
primary traffic. Another observation is that when C is lower than 1, the CAH
region does not remain contiguous anymore. This would be undesirable
since it does not facilitate graceful CDMA to AMPS handdown events over
the entire CDMA boundary. For higher values of C, CAH contiguity is
maintained although the CDMA traffic carried is significantly reduced as
illustrated before.
The cell size also affects the handoff overhead at the boundary sites. The
two-beacon per site deployment scenario appears to be very sensitive to
variations in C; even a small increase in C makes the handoff overhead high.
On the other hand, variations in
C
appear to have a minimal impact on the
handoff overhead when one beacon per site is deployed. In summary, a cell
78
Chapter 4
size on the order of the cell radius provides a contiguous CAH region while
maximizing the CDMA traffic carried and keeping the handoff overhead
low.
Optimization of Dual Mode CDMA/AMPS Networks 79
80 Chapter 4
In summary, we investigated performance tradeoffs for various CAH
procedures and identified optimum values for the associated tuning
parameters. When border cells are used at the network boundaries, optimum
performance may be achieved when Tbrd is on the order of –4 dB. Similarly,
optimum performance with CDMA beacons or cell sizes is achieved when
handdown threshold Tbeac and cell size C is on the order of –8 dB and cell
radius respectively. It should be noted however, that in addition to
performance, deployment cost will eventually determine the most cost-
effective CAH procedure.
3. CONCLUDING REMARKS
As we have illustrated, optimization of the CDMA network even with
one carrier is quite challenging. It involves the tradeoff between capacity,
coverage and voice quality. With the constant increase in traffic demand,
service providers are deploying additional CDMA carriers. When another
carrier is added in the network, issues concerning inter-carrier handoff,
handdown procedures from all CDMA carriers, the performance tradeoffs
between handoff gain and the resulting overhead, etc. need to be explored. In
some scenarios, the service provider may deploy another carrier only in
some potential hotspot areas as outlined previously, or during some
temporary events like major football events, the Olympics, etc. However, it
is clear from the aforementioned analysis that deploying more carriers can
have a detrimental effect on the overall capacity due to the nature of the
resultant guard band and guard zone. Ultimately, the degree of optimization
by the underlying technology possible in an overlay system is a function of
the underlying analog network and its performance and any capacity,
coverage or quality benefits of the overlay network will be affected by the
underlying technology and how it has been deployed.
With the advent of 3G type services, like wireless web browsing, several
techniques are being considered to increase the capacity of the network
while maintaining a consistent QoS. One of the techniques is the inclusion of
a smart antenna system. Such systems typically include multi-beam or
adaptive beam forming and have been shown to provide capacity
improvements in digital cellular networks [16]. Other techniques include
Tower-Mounted Amplifiers (TMA) and/or super-conducting filters [17]
which can provide several dB’s improvement in reverse link coverage,
which is sufficient in many cases to correct coverage holes. TMA’s have not
TEAMFLY
Team-Fly
®
Optimization of Dual Mode CDMA/AMPS Networks 81
been much used in the past due to maintenance and lightning concerns, but
their application needs to be re-evaluated as a valuable alternative to adding
digital-only cell sites. It is thus imperative that the choice of migration
technology is not based on the ultimate performance of said technology but
of the total deployed network and off the synergies that can be fostered
between the technologies.
REFERENCES
[1] V. H. McDonald," The Cellular Concept", BSTJ, no. 58, pp. 15-40, 1979.
[2] W. C.Y. Lee," Mobile Cellular Telecommunications", McGraw-Hill New York, 1989.
[3] TIA/EIA/IS-95, “Mobile Station-Base Station Compatibility Standard for Dual-Mode
Wideband Spread Spectrum Cellular System,” Telecommunications Industry Association
(TIA), Washington, DC, 1993.
[4] A. J. Viterbi and A.M. Viterbi, “Erlang Capacity of a power controlled CDMA system”
in IEEE Selected Areas in Communications
,
pp. 892-900, Aug. 1993.
[5] S. Titch, ”Blind Faith”, Telephony
,
Sept. 8, 1997.
[6] M. Riexenman," Communication", IEEE Spectrum, pp. 29-36, Jan. 1998.
[7] E. Jugl, H. Boche," Limits of Sectorization gain caused by Mobility and soft handoff",
Elect. Letts. Pp. 119-120, vol. 35, #2, Jan. 21,1999.
[8] Ameritech," ClearPath™ Media Kit", .
[9] R. Ganesh and V. O’Byrne, “Improving System Capacity of a Dual-Mode CDMA
Network,” Proc.
of
IEEE
ICPWC,
pp.
424–428,
1997.
[10] H. Chan and C. Vinodrai," The Transition to Digital Cellular", 40
th
Vehicular
Technology Conference, pp. 191-194, Orlando FL, May 1990.
[11] H. Stellakis and R. Ganesh, "CDMA to AMPS Handdown Strategies In a Dual-mode
Cellular Network", in Proceedings of Int’l Conference on Communications
(
ICT'98),
Greece, June 1998.
[12] H. Stellakis and A. Giordano, “CDMA Radio Planning and Network Simulation”, in
Proc. IEEE Int. Symposium. On Personal, Indoor and Mobile Communications, Taiwan,
1996.
[13] M. Wallace and R. Walton, “CDMA Radio Network Planning,” Proc. of IEEE ICUPC
,
pp. 62–67, 1994.
[14] M. Hata, ”Empirical Formula for Propagation Loss in Land Mobile Radio Services”,
IEEE Transactions on Vehicular Technology
,
vol. VT-29, Aug. 1980.
[15] R. Ganesh, H. Stellakis, “Impact of cell size on capacity and handoff in deployed
CDMA networks”, Elect. Letts
,
pp. 2205-2207, Vol. 34, No. 23, Nov. 1998.
[16] Y. Li, M. J. Feuerstein, D. O. Reudink, “Performance Evaluation of a Cellular Base
Station Multi-beam Antenna”, IEEE Transactions on Vehicular Technology
,
Vol. 46,
Feb. 1997.
[17] Marc Rolfes, "Speeding the cell-site acquisition process", Mobile Radio Technology,
November 1996.
This page intentionally left blank.
Chapter 5
MICROCELL ENGINEERING IN CDMA
NETWORKS
DR. JIN YANG
Vodafone AirTouch Plc.
Abstract: CDMA microcell engineering is systematically studied and presented. The
embedded microcell shares the same frequency and has full connectivity with
the overlaying macrocell. The capacity of microcell and macrocell is derived
and simulated at various traffic distributions. The microcell capacity is 1.03 to
1.12 times the capacity of a regular cell. The capacity of the combined
microcell and macrocell is 2.00 to 2.11 times that of a regular cell. The
microcell and macrocell performance is also analyzed in terms of RF
reliability, soft hand-off factors, interference and power levels. The macrocell
RF reliability will degrade more seriously than that of the microcell. The radio
hand-off factors of the microcell are about 11% higher than that of the
macrocell. The average required forward traffic channel power of the
microcell is about 10% less than that of the macrocell. Microcell engineering
guidelines in a commercial CDMA system are also provided. The results
show that embedding the microcell in an existing CDMA network could be a
very efficient way to improve hot-spot capacity and dead-spot coverage.
84 Chapter 5
1. INTRODUCTION
Microcells play an important role in expanding an existing wireless
network. Code Division Multiple Access (CDMA) communications systems
have been deployed and commercialized all around the world [1]. The
traffic demand for CDMA wireless systems has grown rapidly in recent
years. The emerging next generation wireless systems are hierarchical
systems to serve customers’ various needs.
Wireless networks consist of various layers of macrocells, microcells and
picocells. The macrocell service area radius is usually larger than 1
kilometer. The microcell service area radius is around several hundred
meters. The picocell service area radius is less than 100 meters. The
underlay-overlay hierarchy has been used in frequency division multiple
access wireless systems to achieve high capacity. The underlay system will
transmit at a different frequency from the overlay system. There is little
power co-ordination among microcells and macrocells. However, complex
frequency planning and re-tuning are needed for the entire network. Hard
hand-off boundaries are also difficult to define.
In a CDMA system, users of one CDMA carrier are sharing the same
frequency bandwidth. This poses the challenge to implement a
macrocell/microcell hierarchical structure [2] [3] among cell sites that use
the same CDMA carriers. The hierarchical cell sites must effectively control
their powers to eliminate mutual interference. Soft hand-off among
microcells and macrocells reduces the required transmit power around cell
boundaries. It can also easily adapt to irregular cell boundaries. Frequency
planning is not needed.
There are several types of macrocell/microcell structures:
I. Macrocell/microcell with coverage defined by natural environments:
for example, a mountain top macrocell covers a large area with
around 10 mile radius, while several microcells inside the macrocell
coverage area cover major traffic spots, such as along highways.
This type of microcell has a regular cell site configuration and set-
II. A minimalist version of a microcell with remote low power RF
transceivers: for example, the RF radiated signals are converted to
optical signals, and then relayed through optical fiber to an attended
center cell site. This type of microcell consists of two special
components: the optical conversion unit and the low power RF
radiator. It is typically used for tunnels, subways, or in-building
coverage, where remotely transmitted low power is necessary to
achieve the coverage. The microcell main unit consists of baseband
processing and network interface functions. The remote RF units
up.
Microcell Engineering in CDMA Networks 85
contain transmit power amplifiers and receiver pre-amplifiers, which
interface with the antennas. The microcell main unit can serve one
or more RF units through optical fiber or coaxial cable. Some of the
microcells may feed a leaky cable or distributed antenna system.
III. Simulcast of macrocell and several microcells: A high powered
sector simulcasts with microcell transceivers, or several microcell
transceivers simulcast together. This type of structure requires high
isolation among coverage areas of simulcasting cell sites.
The Type II microcell discussed above is a special case of Type I.
Remotely located low power transceiver units can significantly reduce
network cost. However, the time delay on optical fiber, or other
transmission media, needs to be taken into account. Search window sizes
and other parameters may need to be adjusted.
Most of the studies on heterogeneous cells are either based on partially
isolated microcell and macrocell tele-traffic [3], or no soft hand-off between
the microcells and macrocells [4]. Microcell capacity analyses were limited
to the reverse link [2]. The performance impacts of additional CDMA cell
sites on the existing network are still not well understood.
In this chapter, a practical microcell structure based on IS-95 CDMA
systems is systematically studied on both the forward link and the reverse
link. The embedded microcell shares the same frequency and has full
connectivity with the overlaying macrocell. Soft hand-off is applied among
microcells and macrocells. The required transmit powers for both the
macrocell and the microcell are controlled to the minimum levels, using the
AirTouch radio planning tool. The impacts of various traffic densities and
cell site distances between microcells and macrocells are presented. The
microcell and macrocell performance is also analyzed in terms of RF
reliability, soft hand-off factors, interference and power levels.
Section 2 presents the microcell and macrocell propagation models used
in this chapter. Section 3 evaluates system capacity and performance.
Section 4 presents microcell simulation results. Section 5 provides microcell
engineering guidelines. Section 6 presents the conclusions.
2. MICROCELL AND MACROCELL PROPAGATION
MODELS
Microcell sites are usually used for hot traffic spots, or small coverage
holes. Fig. 1 shows a typical macrocell/microcell geometry.
The Type I microcell has a complete base station unit located in the
microcell site. The Type II microcell will have only a RF transceiver unit
located in the microcell site connected to the base station unit located in the
86 Chapter 5
overlay macrocell. Compared to a macrocell, a microcell is usually more
flexible and designed to be deployed with a small size and light weight. It
could be mounted on a wall, pole or floor. A weatherproof cabinet is usually
used for an unattended microcell.
In a mobile communications environment, the radio propagation pathloss
(denoted as T
(
y
))
can be modeled as
where y denotes the distance between the base station and the mobile
station.
denotes the pathloss exponent factor. The corresponding
pathloss slope is
g(.) represents the combined impacts of antenna heights (base
station antenna height Hs and mobile station antenna height hm
),
terrain and environment impacts etc.
A typical suburban propagation model is used for the macrocell. The
microcell propagation model was derived from empirical data collected in a
suburban neighborhood in San Francisco [5]. Fig. 2 shows the received
signal strengths as measured for the macrocell and the microcell. Note that
the microcell is accommodated inside the macrocell. The outward boundary
of the microcell stretches farther out because the difference in received
signal strengths is smaller. The soft hand-off zone is also stretched farther
out, as shown in Fig. 3. A directional microcell with the antenna towards the
overlay cell site could achieve more centralized microcell coverage.
Microcell Engineering in CDMA Networks 87
88 Chapter 5
Table I below shows the slopes and intercepts used for the microcell and
macrocell propagation models. The microcell is mounted under rooftops
with antenna heights lower than 10 feet. The macrocells are mounted above
rooftops, with antenna heights around 40 feet.
In most of the area covered by a microcell, the pathloss slope is steeper
than for a macrocell. Thus, the radiated power will decrease more rapidly.
A CDMA network with the microcell propagation will provide a higher
capacity than that of the macrocell [6].
3. CAPACITY AND PERFORMANCE EVALUATION
Use of microcells can enhance CDMA network performance and increase
coverage and capacity.
The performance of a CDMA system depends heavily on pilot channel
performance [7] [8]. The pilot channel performance is represented by pilot
defined as the ratio of received pilot channel chip energy to
received signal power spectral density.
The received at a mobile station from the macrocell and
microcell can be calculated as
where W denotes the CDMA system bandwidth.
Microcell Engineering in CDMA Networks 89
represents the non-CDMA RF background noise power.
denotes the interference from other CDMA cells in the
system, excluding the macrocell and microcell of interest.
represents the total radiated power from the macrocell.
denotes the total radiated power from the microcell.
and represent the pilot channel power percentage from
the macrocell and the microcell, respectively.
and are the transmission pathloss from the macrocell
and microcell sites to a desired spot, respectively. The desired spot
is located at distance y from the macrocell site and distance x from
the microcell site, as shown in Fig. 1.
The forward link performance is also determined by the traffic channel
performance. The forward link performance is defined as the ratio of
forward link received bit energy to noise power spectral density. Based on
(2) and (3) above, the from the macrocell and microcell can be
derived as
where and represent the traffic channel power allocation
percentage for the macrocell and microcell of interest, respectively. PG
denotes the processing gain of the spread spectrum system, ρ
M
and
represent the orthogonal factor of the macrocell and microcell, respectively.
The orthogonal factor is defined as a degradation of the signal due to the
inability of rejecting other user interference in the forward links of the same
cell. These include imperfections in the transmitter and receiver chains as
well as multipath interference. An orthogonal factor of 1 means purely
orthogonal and of 0 means totally lost orthogonality.
Defining p as the ratio of the received signal strength from the microcell
to that from the macrocell at the mobile station, then
90 Chapter 5
Combining (2) and (3), we have
And
That is,
Thus, to achieve a target under the specified
environment, the required traffic channel power allocation percentage is
calculated as
The above formula can also be applied to a regular cell site configuration.
For example, when the pilot channel power percentage is 15%, the received
is –9 dB, the processing gain is 85, and the orthogonal factor is 0.8.
A traffic channel power allocation of 4.5% is required to achieve a target
of 10 dB.
Fig. 4 shows the relationship between the required forward link traffic
channel power allocation and operation points. When
increases, the required traffic channel power decreases. Within the
microcell, the microcell is larger than that of the macrocell, the
microcell traffic channel power is smaller than that of the macrocell.
The cell boundary between the microcell and the macrocell is defined as
the intersection of the transmission curves in Fig. 2. Around the middle of
the cell boundary, the forward link pilot from both cell sites should
be equal. Therefore, we have
TEAMFLY
Team-Fly
®
Microcell Engineering in CDMA Networks 91
Since the transmission loss from the microcell is less than that from the
macrocell, the pilot transmit power from the macrocell should be set to a
higher level than that of the microcell.
To balance the reverse link cell boundary with that of the forward link,
the required transmit power from the mobile station should also be the same,
i.e.,
where and denote the ratio of total interference to
the noise power at the macrocell and microcell of interest,
respectively.
denotes the mobile station transmit power.
and represent the required reverse
link at the macrocell and microcell sites, respectively.
92
Chapter 5
The transmission loss from the microcell is less than that from the
macrocell. For the same required at both cell sites, (12) shows that
the microcell reverse link rise is less than that of the macrocell. Therefore,
when the microcell loading is the same as the macrocell loading, an
attenuation pad may be added on the microcell receiver to balance the link.
This can achieve desensitization when other cell engineering techniques are
not available, such as lower antenna heights, down-tilted antennas, or natural
propagation barriers.
Combining (11) and (12) above, we have
Equation (13) shows that when the number of users in the microcell
increases, the reverse link rise also increases, and therefore the microcell
pilot power should decrease or the macrocell power should increase to
balance the link.
Assuming there is an average of N users per sector in a CDMA system
with S sectors, we have
where and represent the combined pilot, paging and
synchronization channel power percentage and the average traffic
channel power percentage of the i’th sector, respectively.
denotes the total transmit power from the i’th sector.
denotes the transmission pathloss from the i’th sector.
When the number of users in the system increases, the decreases,
and the required traffic channel power will increase. However, when the
decreases, the soft hand-off area shrinks accordingly.
In a commercialized CDMA network, system capacity data must be
obtained from a network performance monitor. A practical way to calculate
capacity is based on power and interference measurement data from the
forward and reverse links.
Microcell Engineering in CDMA Networks 93
On the forward link, the transmit power percentage of various channels
can be obtained. The CDMA forward link capacity can be
calculated as
Where and represent the power allocation
percentages for the pilot, paging and synchronization channels,
respectively.
v denotes the voice activity factor.
represents the hand-off reduction factor which provides an
estimate of the additional power needed for hand-off.
denotes the traffic channel power allocation percentage.
On the reverse link, the total interference level above the background
noise level can be monitored as the reverse link rise value. For a given
reverse
link
rise
value
(denoted
as
RL_rise,
a
value
without
units)
under
a
corresponding number of active users (N
active
) in the system, the reverse
link capacity can be derived as
When the number of active users in the system is held constant, reverse
link capacity decreases as the reported reverse link rise increases.
4. MICROCELL SIMULATION ANALYSIS
The CDMA system is an interference limited system. The required
transmit powers at the mobile station and the base station must be large
enough to satisfy the signal-to-noise ratio requirement, but small enough to
avoid interference.
Simulations are carried out with a CDMA planning tool to analyze the
system performance. Both the forward and reverse link powers are
controlled at the minimum required power levels, with 1 dB standard
deviation. Monte Carlo simulations are carried out on two tiers of hexagonal
three-sectored cell sites, as illustrated in Fig. 3. The microcell is also three-
sectored to obtain a consistent capacity comparison between the microcell
and the macrocell. Mobile stations are placed randomly and uniformly over
the service area of each sector. Therefore, when the cell site radius
decreases, the traffic density in the cell increases. The statistics of capacity,
94 Chapter 5
hand-off percentage, signal and interference levels are obtained through
simulation.
The information bit rate for the simulation is set at 14.4 kbps. The
processing gain is 85.3. The orthogonality factor is 0.8. The pilot, paging,
and synchronization channel power percentages are set at 15%, 12% and
1.5%, respectively. The macrocell base station power is set to 5 Watts. The
microcell base station power is set between 0.42 Watts and 5 Watts.
The microcell and macrocell propagation models specified in Table I are
used in the simulations. Flat terrain is assumed. The radius of the macrocell
(denoted as R) is fixed at 3 miles. The radius of the microcell (denoted as r)
varies from 0.3 to 0.6 miles. Five cases are studied and simulated as
follows:
Case I: Regular cell sites without microcell. It is used as a baseline to
determine macrocell capacity without embedded microcell.
Case II: A microcell is added at 2/3R from the macrocell site. The
transmit power is equal to that of the macrocell. The microcell radius is
about 0.6 miles.
Case III: The microcell power is reduced to one-third that of Case II. The
cell radius is about 0.45 miles.
Case IV: The microcell power is reduced to one-quarter that of Case III.
The cell radius is about 0.3 miles.
Case V: A microcell is added at 1/3R from the macrocell site. The
transmit power is equal to that of the macrocell. The microcell radius is
about 0.3 miles.
The preliminary results are summarized in Table II. The forward link
capacity is defined as the maximum number of mobile stations that a system
can support with a forward link failure rate of less than 5%. The reverse link
capacity is calculated using (16). The voice activity factor used is 0.45 for
the forward link and 0.40 for the reverse link.
The cell site capacity is defined as the smaller of forward and reverse link
capacity. The microcell capacity gain is measured by the ratio of the
microcell capacity to a regular cell site capacity. The combined network
capacity gain is defined as the ratio of the combined microcell and
macrocell capacity to a regular cell site capacity.
Table II shows that the system capacity is limited by the forward link.
The microcell capacity is 1.03 to 1.12 times the capacity of a regular cell
site. The combined microcell and macrocell provide 2.00 to 2.11 times the
capacity of a regular cell site. These results show that microcells could be a
very efficient engine to relieve hot spot capacity requirement. The mobile
stations are distributed continuously around microcell boundaries in this
study. Therefore, the microcell capacity is lower than the case where a