transformer engineering design and practice 1_phần 10 docx
Bạn đang xem bản rút gọn của tài liệu. Xem và tải ngay bản đầy đủ của tài liệu tại đây (397.97 KB, 40 trang )
327
8
Insulation Design
Insulation design is one of the most important aspects of the transformer design. It
is the heart of transformer design, particularly in high voltage transformers. Sound
design practices, use of appropriate insulating materials, controlled
manufacturing processes and good house-keeping ensure quality and reliability
of transformers. Comprehensive verification of insulation design is essential for
enhancing reliability as well as for material cost optimization.
With the steady increase in transmission system voltages, the voltage ratings
of power transformers have also increased making insulation content a
significant portion of the transformer cost. Also, insulation space influences the
cost of active parts like core and copper, as well as the quantity of oil in the
transformer, and hence has a great significance in the transformer design.
Moreover, it is also environmentally important that we optimize the transformer
insulation which is primarily made out of wood products. In addition, with the
associated increase in MVA ratings, the weight and size of large transformers
approach or exceed transport limits. These reasons together with the ever-
increasing competition in the global market are responsible for continuous
efforts to reduce insulation content in transformers. In other words, margin
between withstand levels and operating stress levels is reducing. This requires
greater efforts from researchers and designers for accurate calculation of stress
levels at various critical electrode configurations inside the transformer under
different test voltage levels and different test connections. Advanced
computational tools (e.g., FEM) are being used for accurate calculation of stress
levels. These stress levels are compared with withstand levels which are
established based on experimental/published data.
For the best dielectric performance, reduction in maximum electric stress in
insulation is usually not enough; the following factors affecting the withstand
Copyright © 2004 by Marcel Dekker, Inc.
Chapter 8328
characteristics should be given due consideration, viz. waveform of applied
voltage and corresponding response, volt-time characteristics of insulation, shape
and surface condition of electrodes, partial discharge inception characteristics of
insulation, types of insulating mediums, amount of stressed volume, etc.
Minimization of non-uniform dielectric fields, avoiding creepage stress,
improvement in oil processing and impregnation, elimination of voids,
elimination of local high stresses due to winding connections/crossovers/
transpositions, are some of the important steps in the insulation design of
transformers. Strict control of manufacturing processes is also important.
Manufacturing variations of insulating components should be monitored and
controlled. Proper acceptance norms and criteria have to be established by the
manufacturers for the insulation processing carried out before high voltage tests.
The transformer insulation system can be categorized into major insulation
and minor insulation. The major insulation consists of insulation between
windings, between windings and limb/yoke, and between high voltage leads and
ground. The minor insulation consists of basically internal insulation within the
windings, viz. inter-turn and inter-disk insulation. The chapter gives in details the
methodology of design of the major and minor insulations in transformers.
Various methods for field computations are described. The factors affecting the
insulation strength are discussed. In transformers with oil-solid composite
insulation system, two kinds of failures usually occur. The first kind involves a
complete failure between two electrodes (which can be jump/bulk-oil breakdown,
creepage breakdown along oil-solid interface or combination of both). The
second one is a local oil failure (partial discharge), which may not immediately
lead to failure between two electrodes. Sustained partial discharges lead to
deterioration of the insulation system eventually leading to a failure. The chapter
discusses these failures and countermeasures to avoid them. It also covers various
kinds of test levels and method of conversion of these to an equivalent Design
Insulation Level (DIL) which can be used to design major and minor insulation
systems. Statistical methods for optimization and reliability enhancement are also
introduced.
8.1 Calculation of Stresses for Simple Configurations
For uniform fields in a single dielectric material between bare electrodes, the
electric stress (field strength) is given by the voltage difference between the
electrodes divided by the distance between them,
(8.1)
The above equation is applicable to, for example, a parallel plate capacitor with
one dielectric.
Copyright © 2004 by Marcel Dekker, Inc.
Insulation Design 329
For non-uniform fields (e.g., cylindrical conductor—plane configuration), the
stress (E
nu
) is more at the conductor surface; the increase in stress value as
compared to that under the uniform field condition is characterized by a non-
uniformity factor (
η
),
(8.2)
The non-uniformity factor is mainly a function of electrode configuration.
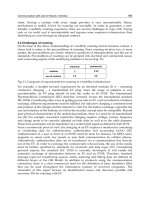
For a multi-dielectric case between two parallel plates shown in figure 8.1, the
stress in any dielectric for a potential difference of V between the plates is
(8.3)
where
ε
i
is relative permittivity of i
th
dielectric. This expression for the
configuration of parallel plates can be derived by using the fact that the stress is
inversely proportional to permittivity. The stress value is constant within any
dielectric.
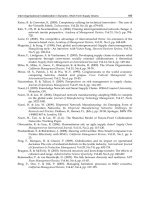
For two concentric cylindrical electrodes of radii r
1
and r
2
, with a single
dielectric between them as shown in figure 8.2, the stress in the dielectric is not
constant and varies with radius. The stress at any radius r(r
1
<r<r
2
) is
Figure 8.1 Multi-dielectric configuration
Figure 8.2 Concentric cylindrical electrodes
Copyright © 2004 by Marcel Dekker, Inc.
Chapter 8330
(8.4)
and the maximum stress occurs at the inner electrode surface given by
(8.5)
For the multi-dielectric case shown in figure 8.3, the stress at any radius r is
(8.6)
For the cylindrical conductor—plane configuration (figure 8.4), formulae for
stresses at the conductor surface and plane are derived in appendix B. The
maximum stress on the conductor surface occurs at point P (along the shortest
distance between the two electrodes) which is given by the expression (equation
B14 of appendix B),
Figure 8.3 Concentric cylindrical electrodes with multiple dielectrics
Figure 8.4 Cylindrical conductor—plane configuration
Copyright © 2004 by Marcel Dekker, Inc.
Insulation Design 331
(8.7)
and the maximum stress at the plane occurs at point G, which is given by the
expression (equation B19),
(8.8)
In the previous two equations, the factor multiplying the term (V/(s-R)) is non-
uniformity factor. For calculation of stress at any other point along the shortest
distance, equation B22 can be used.
For the configuration of two bare cylindrical conductors shown in figure 8.5
with a potential difference V between them, the maximum electric stress occurring
at points P and Q is given as (from equations B12 and B13)
The above equation is applicable when the electrostatic field between the two
conductors is not influenced by any other boundary condition (the case of two
isolated conductors).
Thus, for bare leads of equal radii, the configuration is equivalent to
considering a potential difference of (V/2) applied between one conductor and
plane at a distance of s from the conductor center (cylindrical conductor—plane
configuration of figure 8.4).
For the configuration of paper insulated cylindrical conductor (e.g., insulated
high voltage lead in the transformer) and plane shown in figure 8.6, the maximum
stress in oil at the surface of the covered conductor (at point A) is
Figure 8.5 Stress between two bare cylindrical conductors
Copyright © 2004 by Marcel Dekker, Inc.
Chapter 8332
(8.10)
Similarly, the maximum stress in the paper insulation at the conductor surface (at
point B) is given by the expression,
Figure 8.6 Stress between insulated lead and ground
(8.11)
At any other point in this geometry and for more complicated electrode
configurations, analytical or numerical techniques should be used for accurate
field computations as described in the next section.
Copyright © 2004 by Marcel Dekker, Inc.
Insulation Design 333
8.2 Field Computations
8.2.1 Analytical methods
For estimating electric stress levels at various critical electrodes, it is necessary to
find electrostatic field distribution. The field distribution can be found by a
variety of methods. Classical methods such as method of images give quite
accurate results whenever they can be applied. For complex configurations, which
exist inside a transformer, these methods cannot be applied. Initially, transformer
designers had to depend on analog methods in which conducting paper and
electrolytic tank analogs were used [1]. Before the advent of computers and
numerical methods, these methods were widely used for multi-electrode and
multi-dielectric material systems of transformers with two-dimensional
approximations of the problem. Stressed oil volume, required for estimation of
strength, was also calculated by direct plotting of equigradient lines on a
conducting paper analog by using suitable instrumentation [2]. Analog methods
are inconvenient, inaccurate, expensive, and are limited in their application. They
may not be relevant now due to the rapid development of computational
techniques.
A conformal mapping technique such as the Schwarz-Christoffel
transformation has also been widely used for relatively simple geometries within
the transformers [3,4]. In this method, the whole region of interest is mapped into
a new plane in which the solution is constructed involving unknown constants in
the transformation equation. The unknown constants are calculated by solving a
set of nonlinear equations which describe the boundaries of the region in the
original plane. Curved boundaries can also be handled in this method. Although
the method is suitable for regions with a single dielectric material, for multi-
dielectric problems an approximate solution can be obtained by converting them
into a single dielectric region by using equivalent insulation distances. The
method is best suited for a simply connected region containing few electrodes. For
multiple connected regions with complicated electrode shapes and multiple
dielectrics, this method is not suitable.
8.2.2 Numerical methods
In many cases, physical systems are so complex that analytical solutions are
difficult or impossible, and hence numerical methods are commonly used for field
computations. A numerical technique, Finite Difference Method (FDM), is used in
[5,6] for the field computations. It results into a set of linear equations which are
solved by direct matrix methods or iterative methods. FDM gives accurate results
and can handle curved boundaries accurately if large number of points (fine grid)
is taken on the boundary. Its main disadvantage is that the solution (potential
distribution) is available at discrete points only, and hence the method presents
some difficulties where quantities like stressed areas/volumes are required to be
calculated [7].
Copyright © 2004 by Marcel Dekker, Inc.
Chapter 8334
One of the most powerful and popular numerical techniques these days is FEM.
It is in use for electrostatic field computations since the last three decades [8].
Usefulness of the method has already been demonstrated for magnetostatic and
eddy current problems in the earlier chapters. At locations where the field is
changing sharply, higher order polynomials can be used to approximate the
potential distribution within the corresponding elements and/or fine mesh can be
used. As the method yields a set of linear equations, solution can be obtained by
direct matrix methods or iterative methods. The electric stress in any element is
calculated by differentiating the approximated polynomial function. The stressed
area between two equigradient lines can be derived by finding the elements in
which the stresses are within the two limits of stress values.
Many adopt charge simulation method (CSM) for electric field computations
because it can solve unbounded regions and has high accuracy [9]. In this method,
physically distributed charges on the conductor surface are replaced by discrete
fictitious line charges placed outside the space in which the field distribution is to
be computed. The magnitude of these fictitious charges is calculated in order that
their integrated effect satisfies the boundary conditions exactly, at some selected
number of points on the boundary. The method requires proper selection and
placement of a large number of charges for a good accuracy. For example, a
distributed charge on the surface of high voltage electrode can be replaced by k
line charges placed inside the electrode. For determining the magnitude of these
charges, k points are chosen on the surface of the electrode and the condition to be
satisfied is as follows. At each of these points on the electrode surface, the
potential resulting from the superposition of these fictitious charges should be
equal to the conductor electrode potential V
c
,
(8.12)
where P
i
is potential coefficient and Q
i
is discrete fictitious line charge. When the
above equation is applied to all the selected points k, we get a system of k linear
equations which are solved to get the magnitudes of k charges. The electric field
value at any point in the domain of interest can be determined easily by the
superposition method using these values of charges. Thus, although CSM has
distinct advantages of its applicability to unbounded regions and reasonable
computational efforts, it is not well suited for complex electrode configurations
with a number of dielectric materials. On the contrary, FEM is most suitable for
complex problems but for bounded regions. For electrodes with very small radius,
because of the limitation on the smallest size of element that can be used and the
approximation of curved path by small line segments, the accuracy of FEM may
not be the best. Hence, advantages of CSM and FEM can be combined with
elimination of their disadvantages in the combination method as reported in [10].
In this method, the entire problem space is divided into two parts; CSM is used
Copyright © 2004 by Marcel Dekker, Inc.
Insulation Design 335
mainly for the open space with infinite boundary and FEM is used for the finite
enclosed space.
8.3 Factors Affecting Insulation Strength
The breakdown voltage of a dielectric material is a statistically distributed
quantity which is a function of its physical/chemical properties and impurities
present in it. Failures may not be always initiated by higher electrical stresses;
interrelated thermal, chemical and mechanical factors may also have significant
influence on the breakdown processes. As compared to metals, insulating
materials exhibit an erratic behavior. With the ageing and/or deterioration of
electrical and mechanical properties, it becomes even more difficult to predict
their performance. In transformers, composite oil-solid insulation system is used.
The erratic behavior of transformer oil is pronounced when used alone. There is a
much larger scatter of breakdown voltage for oil as compared to a smaller scatter
observed for air. The very large scatter of the oil gap breakdown voltage may be
associated with the random path of streamers and variations in their progress in the
oil [11]. Hence, larger oil ducts are always subdivided by solid insulation into
smaller ducts due to which the transformer insulation system becomes more
dependable and stable.
Compared with breakdown processes in gases, little is known about the
processes which initiate and lead to breakdowns in the oil. General models using
micro-bubble and weak-link theory have been attempted. It is reported in the
literature that some micro-bubbles exist m the oil even in the absence of electric
field, and the application of field creates additional bubbles. It is suggested that
discharges are ignited in these micro-bubbles. Due to dielectrophoretic forces,
particles/impurities are swept from surrounding oil regions to the points of
highest stress in the oil gap [12]. These particles then tend to line up along the
electric field lines to create a weak-link in the oil gap; this phenomenon is
accentuated in the presence of moisture. Transformer designers use to a great
extent semi-empirical data for the insulation design as there is still no coherent
theory of oil breakdown.
8.3.1 Effect of moisture and impurities
Needless to say, moisture and other impurities have significant deteriorating
effect on the dielectric strength of the transformer insulation. The moisture has
deteriorating effect on both electrical and mechanical properties of the insulation.
As the moisture content in oil increases, strength reduces drastically till the
saturation point, after which there is no appreciable further deterioration of the
strength. Hence, percentage saturation is the decisive factor influencing the
dielectric strength of the transformer oil [13,14]. The degrading effect of moisture
content is also significantly affected by the amount of other impurities present in
the oil [15]. The presence of solid impurities makes the deteriorating effect (of
Copyright © 2004 by Marcel Dekker, Inc.
Chapter 8336
moisture on strength) more significant even at quite low moisture content in the
oil. The solid insulation has more affinity (as compared to the oil) for moisture. It
has been reported in [16] that at room temperature, the reduction in dielectric
strength of the oil due to presence of cellulose particles gets amplified at higher
moisture content.
An increase of pressure or temperature, increases the quantity of gas the oil can
hold. If the oil temperature rises owing to increase of ambient temperature or load,
the oil expands and the pressure increases. When the pressure falls, the oil has
more gas content than it can hold. The excess gases eventually diffuse out of the
oil after some time (few days or weeks) depending on the ratio of the oil surface
exposed to gas and the total oil volume. If the pressure drops suddenly the gas
bubbles may get formed in the oil, reducing the dielectric strength [15].
The dielectric strength of paper insulation is significantly decided by its
mechanical properties. A brittle paper having lost mechanical strength has a low
dielectric strength. Ageing of insulation affects its mechanical strength more
significantly than the electrical strength [15]. The rate of ageing increases rapidly
with the increase in temperature deteriorating mechanical properties.
A number of studies have been reported in the literature [13,16–19]
highlighting effects of various influencing factors, viz. temperature, pressure,
impurities, moisture, electrode shape/surface, electrode metal, applied voltage
and its duration, gap between electrodes, etc., on the oil breakdown strength.
8.3.2 Effect of time and frequency
Volt-time characteristics are specific curves representing the relationship between
voltage and time to breakdown. These characteristics generally follow a law that
some amount of energy is required to cause breakdown of a gap, and thus the
breakdown voltage and time are interdependent [20]. The higher the voltage the
lower the time is to cause the breakdown. A typical volt-time curve of air
insulation is shown in figure 8.7.
Figure 8.7 Typical volt-time curve
Copyright © 2004 by Marcel Dekker, Inc.
Insulation Design 337
In short-time power frequency overvoltage tests, the breakdown strength of the
solid insulation is influenced by temperature rise. When an alternating voltage is
applied, initially the heat on account of dielectric losses is stored inside the
insulation and temperature begins to rise. The heat is dissipated to surrounding
ambient which is at a lower temperature than the insulation. The insulation
temperature continues to rise until a state of equilibrium is reached, wherein the
heat dissipated is equal to the heat generated. But with the increase in
temperature, the resistance of the solid insulation decreases due to the negative
temperature coefficient of resistance resulting in increase of current. Losses are
further increased due to increase of current, and this leads to a run-away condition
resulting in an eventual breakdown. Hence, with the increase in the time of
application of voltage, the dielectric strength at power frequency reduces. For
most of the insulating materials, the infinite time strength is approximately two-
thirds of the one-minute strength, and the one-second strength is about 1.6 times
the one-minute strength [21].
The dependence of the oil dielectric strength on the duration of voltage
application is erratic as compared to the solid insulation. Although it is difficult to
obtain definite volt-time characteristics, it can be said that the dielectric strength
reduces rapidly after few seconds and remains more or less constant after few
minutes for power frequency test voltages. It requires time for impurities to get
lined up and bridge the gap; hence for very short time of application the strength
is very high.
Like the duration of voltage application, the frequency of test voltage has a
significant effect on the insulation strength; the increase in frequency results in
reduction of strength, and thus increases rapidly the severity of the power-
frequency overvoltage test. As the frequency increases, the dielectric loss and
heating increase, reducing the strength of the solid insulation. The strength does
not vary in the linear proportion to the reciprocal of frequency [22] but
approximately with an exponent of 0.137, i.e., strength The effect of
increase in frequency has much smaller effect on the oil strength as compared to
the solid insulation. In general, it can be concluded that the increase of frequency
has a harmful effect on the strength of transformer insulation during the power-
frequency overvoltage tests. If the frequency is increased, the time of application
of voltage should be reduced to produce the same amount of dielectric stress.
Hence, the test standards specify the total number of cycles for the power
frequency induced overvoltage test. When this test (in which the insulation is
stressed to at least twice the voltage/turn) is conducted, frequency is also
increased in order to avoid the core saturation. With the increase in frequency,
time of application of voltage is reduced to maintain the same degree of severity.
The IEC standard 60076–3, second edition: 2000, specifies that the test time
should be 60 seconds for any frequency upto and including twice the rated
frequency. For a test frequency higher than twice the rated frequency, the test time
should be reduced and calculated in accordance with the formula,
Copyright © 2004 by Marcel Dekker, Inc.
Chapter 8338
(8.13)
subject to a limit that it should not be less than 15 seconds. In other words, the
number of cycles for the test is fixed; 6000 cycles for 50 Hz and 7200 cycles for 60
Hz transformer. Hence, for a 50 Hz transformer, if the test is conducted at 200 Hz,
the test duration will be 30 seconds.
The effect of time and frequency of the voltage (during the power-frequency
overvoltage test) on the creepage strength is not significant as compared to that on
the puncture of the solid insulation [22]. The creepage breakdown in the absence
of conducting material impurities is mostly decided by the oil failure, and the
increase of frequency does not result in significant decrease of the oil strength due
to smaller heat effect [23].
Regarding impulse volt-time curves, two types of curves are derived in the
literature. For the first one, called full-wave volt-time curve, a full impulse wave is
applied across the insulation and the breakdown may occur either on the wave-
front or wave-tail portion or may not occur if the voltage is quite low. A volt-time
curve is plotted using these breakdown points. For the second one, the wave-front
slope is varied, and for each slope value the voltage is increased till the
breakdown occurs. This front-of-wave volt-time curve is of similar nature but has
somewhat different values as compared to the full-wave volt-time curve.
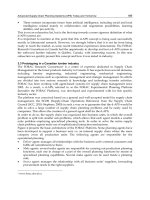
The impulse volt-time curve of the insulation used in a transformer is
drastically different than that of the air insulation. Typical curves for oil and oil-
impregnated pressboard are shown in figure 8.8. The curves indicate that the oil
and solid insulations have flat characteristics after few microseconds. Composite
oil-solid insulation generally has the volt-time characteristics close to that of the
solid insulation alone. It is reported in [24] that the dependence of dielectric
strength on the impulse duration in the range of 10
-3
to 10
-1
seconds is small for
major insulation consisting of oil-barrier system (e.g., gap between windings).
The impulse ratio can be defined as the ratio of impulse full wave strength to
one-minute r.m.s. AC (50 or 60 cycle) strength. Few of the earlier researchers have
reported impulse and one-minute volt-time characteristics [25,26,27] and the
corresponding impulse ratios. With the introduction of concept of partial
discharge later on, volt-time curves for partial discharge inception voltage have
also been reported. The partial discharge and breakdown volt-time curves, and
corresponding impulse ratios are reported in [28] for three different cases, viz.
turn-to-turn insulation, disk-to-disk insulation and oil duct insulation between
barriers. It has been shown that the breakdown volt-time curve, as expected, is
significantly above the partial discharge volt-time curve in the microsecond
range. The two curves come very close to each other in the AC long-term region of
several minutes as shown by the typical curves in figure 8.9. It means that for very
short times, a partial discharge initiated is not sufficient to cause the breakdown,
whereas in the longer duration of several minutes its magnitude is sufficient to
cause the breakdown of the insulation.
Copyright © 2004 by Marcel Dekker, Inc.
Insulation Design 339
In transformer works, different dielectric tests, viz. lightning impulse,
switching impulse and short-time/long-time power frequency tests, are carried out
separately independent of each other. In actual power system operation, the
transformer may be subjected to superimposed AC and lightning impulse
voltages. The dielectric strength under such superimposed AC and lightning stress
levels is reported in [29]. The breakdown voltage under the superimposed stress
condition can be significantly lower than the corresponding value for the
lightning impulse alone.
Figure 8.8 (a) Volt-time curve of oil-gap
(b) Volt-time curve of oil-impregnated pressboard
Figure 8.9 Breakdown (BD) and Partial Discharge (PD) volt-time curves [28]
Copyright © 2004 by Marcel Dekker, Inc.
Chapter 8340
Gas Insulated Substations (GIS) are being widely used all over the world.
Disconnecting switch operations in GIS generate steep front transient
overvoltages characterized by a rise time of few nanoseconds (5 to 20 ns), a short
duration of several microseconds and amplitude as high as 2.5 per-unit. The 50%
breakdown probability voltage of oil-paper insulation is reported [30] lower for
steep fronted GIS transients than for lightning impulses. The oil-paper insulated
equipment like transformers or their bushings, subjected to GIS transients, may
fail at voltages below the lightning impulse level. Hence, the insulation of
transformers for the GIS application must be designed with due consideration to
these steep fronted transients.
Sometimes transformers are subjected to high frequency oscillatory
overvoltages. In such cases, the damping of oscillation (defined as the ratio of two
consecutive amplitudes of the same polarity) has significant impact on the
dielectric strength of insulation; the strength increases with the increase in
damping. For example, the strength for an undamped oscillating voltage of
frequency of 0.9 MHz is below the dielectric strength for the lightning impulse,
whereas with a damping ratio of 0.9 the strength is in the same range of that for the
lightning impulse voltage [31].
8.3.3 Effect of temperature
As temperature increases, the dielectric strength of most of the solid insulations
reduces. Due to increase in dielectric loss (and power factor), insulation
temperature goes up further. The insulation ohmic resistance reduces with the
increase of temperature, which results in flow of more current in the insulation. It
may finally lead to the current run-away condition and eventual breakdown. The
deterioration of the solid insulation strength with increase of temperature is
opposite to the effect usually observed for the transformer oil.
The oil dielectric strength usually increases with temperature in the operating
range. A marked improvement in the strength with the temperature increase is
observed for the oil containing high moisture content. The temperature effects are
dynamic in the sense that a considerable amount of time is required for
establishing equilibrium between moisture in the oil and that in the solid
insulation made of cellulose material. During different thermal loading
conditions, there is a continuous interchange of moisture affecting the strength to
some extent. For a reasonable temperature rise, the amount of moisture in the oil
reduces, and thus this helps to keep the transformer insulation system in a healthy
condition. It is known that an increase of temperature usually increases the
mobility of carriers and conductivity. Hence, the breakdown voltage of oil should
decrease with the increase in temperature; experiments conducted by many
researchers show the opposite trend. The variation of carriers and mobility,
therefore, may not possibly be used to explain the results of experiments. There is
some amount of gas bubbles present in the oil and their solubility increases with
temperature; this explains the increase of strength with the temperature [32].
Copyright © 2004 by Marcel Dekker, Inc.
Insulation Design 341
Hence, it is generally not preferable to keep a transformer idle for a long time.
Even a spare transformer should be kept in no-load condition for a reasonable
amount of time periodically. The strength increases with temperature from -5°C to
about 80 to 100°C; above which it reduces [21, 33]. Below -5°C, the strength
increases rapidly as moisture particles in suspension get frozen.
8.3.4 Effect of thickness
It is known that dielectric strength of insulation does not generally increase in
direct proportion to its thickness in a non-uniform field. The strength of the
insulating materials can be expressed by the simple exponential formula [34],
(8.14)
The value of numerical constant n varies from 0.5 to 1.0 depending up on the
processing/treatment of material and degree of non-uniformity of the field. For an
untreated insulation, n is lower as compared to a treated insulation. For better
shaped electrodes giving uniform field, its value is higher than that for a non-
uniform field. For an electrode with a small radius, there is more crowding of
equipotential lines at the electrode surface resulting in higher stress and lower
value of breakdown voltage. The above equation indicates that with the increase
in voltage rating, the insulation content of the transformer increases more rapidly.
8.3.5 Stressed volume effects
It is well-known that the breakdown strength of the transformer oil decreases
statistically with the increase in its stressed volume [35]. This is also in line with
the general fact that insulation strength reduces with the increasing area of
insulation under test [36]. The oil dielectric strength reduces with the increase in
stressed volume for both power frequency and impulse voltages [13]. Although,
designers take either stressed area or stressed volume for strength considerations,
it is generally agreed that the size of the structure is instrumental in the breakdown
process. The strength calculations based on stressed oil volume are more
commonly used in the industry. A breakdown in a gap is usually initiated at the
weakest spot under a high stress condition. If in some other gap, a greater volume
of oil is subjected to the same level of stress, it is quite probable that a still weaker
spot will be present, resulting in breakdown at a lower voltage. Amount of
impurities and electrode protrusions become quite important considerations for
the area/volume effects. Usually the relationship between the breakdown strength
and stressed volume is obtained experimentally from a number of breakdown
studies for various types of electrode configurations. The breakdown strength for
a plain oil gap is expressed in terms of the stressed oil volume (for power
frequency test voltages) as [12]
Copyright © 2004 by Marcel Dekker, Inc.
Chapter 8342
E=17.9(SOV)
-0.137
kVrms/mm (8.15)
where stressed oil volume (SOV) is in cm
3
. In [37], the 50% breakdown probability
stress for one-minute power frequency voltage is calculated as
E=11.5(SOV)
(-1/9.5)
+2.5 kVrms/mm (8.16)
where SOV is in cm
3
. It can be verified that the strengths given by the formulae
8.15 and 8.16 give the values of E of the same order for practical values of SOV (for
the cases such as high voltage lead to ground configuration). The design should
be such that the calculated stress value should be lower than E by some margin
which is decided based on experience. It is assumed in above equations that
electrodes are covered with some minimum thickness of paper insulation.
Thus, if a failure is predominantly decided by particles/impurities, a larger oil
volume will provide more number of particles which are drawn into high stress
zones, which may subsequently lead to a breakdown. However, a point is reached
after which a further increase in volume will have insignificant effect on the
strength since there is little influence of field on remote zones unless the field
divergence is quite low. Hence, the volume in the above equations is taken as
corresponding to the region in which the calculated electric stress values are
between the maximum value and 90% of the maximum value.
Equations 8.15 and 8.16 tell us that with the increase in stressed volume, the
dielectric strength of the insulation system reduces. If the electrode radius is
increased, the stress values reduce; but at the same time the stressed oil volume
(between maximum value and 90% of maximum value) increases reducing
withstand. Hence, the optimum electrode contour can be determined by studying
the relative variation of stress and strength due to the changes made in the
electrode contour [38].
8.3.6 Creepage phenomenon
The solid insulation is used inside a transformer at a number of places, viz.
between turns, between layers, between disks, between winding and ground, and
between windings. The designer is confronted with mainly two types of electrical
failures, viz. puncture and creepage. The puncture strength of the solid insulation
is significantly higher than the creepage strength. Its creepage strength is
maximum when it is along equipotential lines, i.e., when electric field (E) is
normal to the insulation surface (equipotential lines are at right angles to the
electric field). Due to complications of winding construction and connections, it
is difficult to keep the field normal to the insulation surface everywhere. Also, it is
not always possible to bend the solid insulation components to any desired radius
or contour. In any case, considering the fact that the electric field is actually a
three-dimensional one, difficulties of having shaped insulation components
normal to the field are obvious. These places, where there is a field component
parallel to the insulation surface, the strength is significantly reduced. When there
Copyright © 2004 by Marcel Dekker, Inc.
Insulation Design 343
is a failure along the surface of a insulation, it is termed as a creepage failure
phenomenon. If the placement of the solid insulation results in stresses along its
surface, much of the purpose of using it, viz. subdivision of oil ducts for higher
overall strength, will get lost.
The creepage flashover characteristics of oil-pressboard interfaces have been
analyzed and reported in a number of papers [39,40]. A permittivity mismatch of
two insulation materials usually assists flashover phenomenon at the interface
[41]. The electric field in the oil immediately adjacent to the pressboard gets
distorted due to the permittivity mismatch. Significant improvements can be
gained by matching permittivities of the oil and pressboard insulations [42]. Thus,
a pressboard having permittivity close to that of the oil not only reduces the oil
stress but also results in higher value of flashover voltage along the oil-pressboard
interface [43]. Hence, with a low permittivity pressboard, there is significant scope
for optimization of insulation content since the electric field distribution will
become more uniform in the oil-paper-pressboard insulation system of transformers.
A low permittivity pressboard, manufactured by blending polymethylpentene
fiber with cellulose fiber, has been used in a 765 kV, 500 MVA transformer [43].
8.3.7 Cumulative stress calculations
Using calculations based on SOV, the strength of an oil gap can be calculated as
discussed in section 8.3.5 (SOV based calculations are more relevant for larger oil
gaps). Another approach, in which cumulative stress calculations are done, is
commonly used for the design of the insulation system of transformers. The
approach is used for both creepage withstand assessment and oil gap design.
For estimating creepage withstand characteristics, the cumulative stress
distribution is determined along the oil-solid interface. For two electrode case,
finding the cumulative stress distribution is easy. The maximum stress is usually
at one of the electrodes, and it reduces as we go towards the other electrode. Hence,
the cumulative stress at any point is the difference between the electrode voltage
(which is maximum) and voltage at that point divided by its distance from the
electrode. For complex electrode configurations, with more than two electrodes,
the maximum stress may not be at one of the extremities of the path (interface)
under consideration, in which case the cumulative stress calculation starts from
this maximum stress point. The creepage stress distribution along a solid-oil
interface can be calculated by using the procedure described in [44]. Let us
consider a solid-oil interface shown in figure 8.10.
Figure 8.10 Cumulative stress calculation
Copyright © 2004 by Marcel Dekker, Inc.
Chapter 8344
Let us assume that the potential values, calculated by some method at points 1, 2,
3, 4 and 5, spaced at 2 mm distance, are as given in the figure. It is also assumed
that the stress is maximum at point 3 (having value 7 kVrms/mm). The creepage
stress is calculated for a unit length of 2 mm in either direction from point 3, and
the path is extended in the direction of higher stress. Next, the cumulative stress is
calculated for 4 mm length in either direction as shown in table 8.1. The
calculation procedure is continued till the entire path is traced. The calculated
cumulative stress values are plotted in figure 8.11. The withstand for each of these
creepage distances (for power frequency overvoltages) can be calculated by [45]
E
creep
=15d
2
-0.37
kVrms/mm (8.17)
where d
2
is the creepage path length in mm. The equation is valid for a degassed
oil and a good quality solid insulation with clean surface. The above equation for
creepage strength is in line with the curve arrived in [46,12] by considering
creepage field strengths for four different configurations.
It should be remembered that the calculated cumulative stress levels should be
lower than the value given by equation 8.17 by a margin depending on quality of
components and manufacturing processes, i.e., the margin between the creepage
withstand and creepage stress for any length should be more than a certain value
fixed by the transformer designer based on experience/established practices.
Usually, the creepage strength is considered about 30% lower than the bulk oil
(jump) strength [47,48]. The reference withstand curve for bulk oil (for power
frequency overvoltages) is described by the following equation [12],
E
oil
=18d
1
-0.38
kVrms/mm (8.18)
where d
1
is the oil gap distance in mm between covered electrodes, and the oil is
considered without gases.
Table 8.1 Cumulative stress calculation
Copyright © 2004 by Marcel Dekker, Inc.
Insulation Design 345
It is always advisable to cover the electrodes with some insulation as it
improves the strength by about 15 to 20% [12]. The creep withstand calculated by
equation 8.17 is about 17 to 13% lower than the bulk oil withstand given by
equation 8.18 (for a length of 1 to 100 mm), but as a conservative value it can be
taken 30% lower as mentioned earlier for any distance. The creep withstand has
been taken about 21% lower than the bulk oil strength in [49].
Thus, we have seen that there are two distinct approaches for determining
withstand for bulk oil breakdown phenomenon; one is based on distance
(equation 8.18 above) and other is based on stressed oil volume (equation 8.15 or
8.16). These two approaches are not contradicting each other, and the consistency
of strength given as a function of gap length with the well established theory of
stressed oil volume has been elaborated in [12].
8.3.8 Effect of oil velocity
Oil velocity has noticeable effect on its breakdown characteristics. It is reported in
[37] that the power frequency breakdown voltage of moving oil at a velocity of
about 25 cm/s is equal to that of stationary oil. It is higher than stationary oil by 10
to 15% at about 5 cm/s and lower than stationary oil when the velocity exceeds
100 cm/s. The explanation for this particular behavior is as follows. If oil
movement is more dominant than the force by which impurities are swept and
drawn in high stress zones as observed in the case of stationary oil, the breakdown
voltage tends to be higher with the increase in velocity. When the velocity
increases beyond a certain value, reduction of the breakdown voltage may be
linked to the stressed oil volume effect, wherein the probability of large number of
Figure 8.11 Plot of cumulative stress
Copyright © 2004 by Marcel Dekker, Inc.
Chapter 8346
impurities passing through a high stress zone between the electrodes increases.
This phenomenon is in line with the weak-link theory; the chances that weak-link
of the oil (particle/impurity) may initiate a discharge are higher due to the fact that
more volume of oil passes through the stressed zone of an insulation arrangement
[14]. Contrary to this theory, a higher velocity shortens the time for which
impurities will remain in high stress zones and the breakdown voltage should
increase as per volt-time characteristics. Hence, the breakdown voltage at higher
velocities will depend on which of the two effects, volt-time or oil volume effect,
is the deciding factor. For impulse conditions, the breakdown voltage does not
seem to be affected by the oil velocity.
8.3.9 Processing of insulation
Removal of moisture and impurities from the insulation is one of the most
important processes of transformer manufacture. With the increase in the size of
transformers, the time taken for processing of their insulation also increases. The
time taken by a conventional hot air—vacuum process is considerably higher for
large transformers with high voltage ratings, and it may be unacceptable to the
transformer manufacturer. The conventional drying method may take more than 7
days for a 220 kV class transformer. The method consists of heating core-windings
assembly with air as a medium and applying vacuum for extracting the moisture.
The moisture content of the insulation can be reduced by raising its temperature
and/or by reducing water vapour partial pressure, i.e. by vacuum. The application
of vacuum speeds up the moisture extraction process; heating alone will take
more time to remove a given amount of moisture from the solid insulation.
Depending on the rating and voltage class of the transformer, several cycles of
alternate heating and vacuum are required till the transformer insulation is dried.
A moisture content of less than 0.5% is usually taken as the acceptance criterion
for ending the process.
Requirement of a faster and more efficient process along with the need for
better insulation performance resulted in the development and use of kerosene
Vapour Phase Drying (VPD) method [50]. It is a fast and efficient method in which
kerosene vapour at a high temperature is used as the heating medium instead of
hot air (used in the conventional method). A special grade of kerosene, heated to
about 130°C in an evaporator and converted into vapour form, is injected into the
autoclave or transformer tank housing the core-windings assembly. As the process
of heating is done under vacuum, the moisture extraction starts taking place
during the heating period itself. When the insulation reaches a certain desired
temperature, a fine vacuum is applied to remove the remaining moisture. In the
VPD process, the windings and insulation are almost uniformly heated, whereas in
the conventional process the inner insulation may not get heated to the desired
temperature. The total process time in the VPD method is less than half the
conventional method. In the conventional method, as heating is done through the
Copyright © 2004 by Marcel Dekker, Inc.
Insulation Design 347
medium of air with the presence of oxygen, the temperature is limited to about
110°C. On the contrary, in the VPD process, the drying is done in an oxygen free
atmosphere (virtually in vacuum), and hence there are no harmful effects or loss of
insulation life even at 130°C. Thus, the uniform heating at higher temperature
under vacuum results in faster removal of moisture. The VPD process has the other
advantage of vapour condensing on colder winding and insulation parts, thus
washing out the impurities improving the dielectric properties. This aspect of VPD
is extremely useful when one wants to clean the windings of transformers which
come back to factory for repair or when windings are inspected to find a fault in a
transformer failed in a test. With the uniform heating of all insulation parts, the
shrinkage is also uniform and no further shrinkage is likely during the transformer
operation at site, ensuring the mechanical strength of the windings.
Presence of small cellulose particles in oil has pronounced effect on its
dielectric strength. Due to hygroscopic nature of cellulose, moisture in the oil
plays a decisive role as it gets absorbed into the cellulose. The cellulose particles
have deteriorating effect on the strength even when the ppm content of moisture
in the oil is well within limits; the water content (saturation) in cellulose
insulation is the deciding factor. Hence, it is absolutely essential to minimize
content of suspended cellulose particles and fibers in the oil. These particles
usually originate from the surface of paper/pressboard insulation. The major
sources of these particles are the edges of radial spacers (pressboard insulation
between disks) and axial spacers (pressboard strips in major insulation between
windings) if these components do not have a machined finish. Punching
operations required for making these components involve shearing of pressboard.
Burrs, micro-delaminations and subsequent formation of cellulose fibers will be
unavoidable if punching tools are not of good quality or their maintenance is
inadequate. Hence, it is always recommended to have an additional operation of
milling so that the edges of these pressboard components are smooth and free from
fibers.
Once properly processed and impregnated with dry oil, it is important to
prevent moisture from getting access to the oil impregnated solid/paper
insulation through the oil. Simple and widely followed method for small and
medium power transformers is to provide a breather with a dehydrating material
(like silica gel) and an oil seal. The oil seal provides isolation to the dehydrating
material from the atmosphere. Thus, the transformer breathes through the
dehydrating material, and hence the moisture from the atmosphere cannot get into
the transformer oil. Advanced breather systems (e.g., drycol breather) are also
popular in some countries.
Transformer oil deteriorates to some extent when exposed to the atmosphere.
The air acts as an oxidizing agent forming sludge in the oil. Hence, many of the
large transformers, nowadays, are equipped with an air bag fitted inside the
conservator, so that the transformer oil does not come in direct contact with the
outside atmosphere. The changes in oil volume on account of temperature
variations are absorbed by this flexible bag thus maintaining a constant pressure.
Copyright © 2004 by Marcel Dekker, Inc.
Chapter 8348
One side of this bag is in contact with the atmosphere through a dehydrating agent
so that if the bag ruptures, the oil does not get exposed to the atmosphere since the
dehydrating breather steps into the conventional mode of operation. Action can
be initiated to replace the ruptured bag in the mean time.
Once the transformer (insulation) is processed, it is filled with dry and degassed
oil (having dielectric characteristics within the acceptable limits) under vacuum.
Immediately after the oil filling, some air bubbles are formed in the insulation
which may lead to partial discharges. Hence, a certain hold/settling time needs to
be provided before the commencement of tests. During the settling period, heavier
particles/impurities settle down at the bottom and the air bubbles move up or get
absorbed. After the hold time, air bubbles should be released by bleeding (through
air release plugs) at the top so that the transformer is free of (trapped) air. With this,
dielectrically critical areas get cleared. The hold time increases with the increase
of voltage rating of transformers. For 132 kV class transformers it should be
minimum 24 to 36 hours, for 220 kV class it should be about 48 hours, and for
400–500 kV class transformers it is desirable to have the hold time of about 72
hours [51]. A lower hold time may be adopted by the transformer manufacturers
based on their experience.
8.4 Test Methods and Design Insulation Level (DIL)
In service, the transformer insulation is subjected continuously to operating
voltages and occasionally to overvoltages. The former decides the working
voltage stress on the insulation. The overvoltages can be broadly divided into
lightning overvoltages (aperiodic surges with duration of one to tens of
microseconds), switching overvoltages (oscillatory surges with duration up to
thousands of microseconds), and temporary overvoltages (lasting for few minutes)
at or close to the power frequency. The standards on transformers have defined
voltage test levels for various voltage classes of transformers. There are basically
four different types of tests, viz. lightning impulse test, switching impulse test,
short duration power frequency test and long duration power frequency test with
partial discharge measurement. While the first three tests check the insulation’s
overvoltage withstand capability, the long duration test is mainly intended for
checking the insulation behavior under the working voltage stress. The design of
insulation between various electrodes is decided by one or more of these test
levels. The inter-disk spacing is decided by impulse stresses, whereas the end
insulation (between windings and yoke) may get predominantly decided by the
power frequency test voltages. The conductor insulation is decided by either the
impulse stress or working voltage stress.
When oil and solid are stressed together, two kinds of failures can usually
occur. In one type, there could be a complete catastrophic failure between two
electrodes (can be jump breakdown, creepage breakdown or combination of
both). This kind of failure is quite uncommon if adequate clearances are provided
Copyright © 2004 by Marcel Dekker, Inc.
Insulation Design 349
and maintained. The second one is a local oil failure (partial discharge). At one
time, the partial discharge (PD) measurement test was not conducted due to non-
availability of proper instrumentation. Also, many partial discharges used to
result into undetected damages (since the solid insulation acted as a barrier to
propagation of discharges). With the development of instrumentation and
awareness of slow but damaging effect of discharges, the partial discharge test has
become one of the most important tests for high voltage transformers. The
international standards on transformers have defined the voltage levels and
corresponding PD limits. Some manufacturers set their internal norms much lower
than that specified in the standards in order to ensure long-term reliability of
transformers. In order to get very low PD levels, all the sharp electrodes inside the
transformer have to be rounded or electrostatically shielded. Processing and
impregnation procedures have to be excellent for minimizing impurities and air
voids. Also, the manufacturers should have proper instrumentation for the low PD
measurement. Ambient partial discharges in the test set-up area and surrounding
environment have to be minimized. The partial discharges lead to a progressive
damage of insulation resulting into eventual failure after a time period which
depends on their severity and location inside the transformer. Hence, it is
advisable to eliminate all the sources and causes of partial discharges, so that the
progressive deterioration of insulation becomes a remote possibility.
Aim of a transformer engineer should be to design and manufacture a partial
discharge free transformer. It should be noted that the impregnation of insulation
may not be perfect and also it may not be possible to control the dielectric field
uniformly at all locations. Hence, in practice some amounts of partial discharges
are always there; endeavor should be to minimize them. The electric stress values
below the PD inception levels do not result into ageing of the mechanical strength
of the pressboard. In such a case, the life of pressboard insulation is decided by the
mechanical strength as affected by thermal conditions [43]. The PD is usually
measured either in pico-coulombs or micro-volts. Detection and measurement of
PD at its origin is very difficult. The two major approaches of PD detection, viz.
acoustic and electrical signal based, are discussed in chapter 12.
Design Insulation Level: After calculating the voltages at critical places inside
a transformer (within the windings, at the ends of windings, on the surface of leads,
etc.) under all the test conditions, it is quite meaningful to convert these voltages
to one equivalent voltage, which is usually the (one-minute) short duration power
frequency voltage. This equivalent voltage level is called as Design Insulation
Level (DIL) which is expressed in kVrms. Thus, at any point inside the transformer,
there is only one DIL, which is the maximum of equivalent one-minute power
frequency voltage levels during the four different tests. This approach is widely
followed by transformer designers simplifying the insulation design process. The
conversion factors used by different manufacturers for converting the calculated
voltages (under various tests) to one-minute r.m.s. value may not be identical but
they fall in a narrow range.
Copyright © 2004 by Marcel Dekker, Inc.
Chapter 8350
The factors reported in [48] are given in table 8.2. The conversion factor for one
hour power frequency test voltage is in agreement with the following equation
given in [37],
V
t
=(1/t)
0.055
V
1
(8.19)
where V
1
and V
t
are the 50% breakdown probability voltages for 1 minute and t
minutes respectively. The equation gives V
60
/V
1
as 0.8, which is in line with that
given in table 8.2.
The multiplication factor for BIL in table 8.2 is in line with the impulse ratio
(the ratio of lightning impulse level to power frequency level) of about 2.3 as
evident from table 8.3 which gives commonly used BIL and power frequency test
levels for various voltage classes. An impulse ratio in the range of 2.3 to 2.5 is
being used in the industry [11,12] while calculating the equivalent DIL
corresponding to a BIL value. This value of impulse ratio represents an average
correction factor for the impulse voltage duration in the range of 10 to 100
microseconds. The overvoltages stressing the inter-disk or inter-turn insulation
during the impulse test may be shorter than 10 microseconds in which case the
correction factor seems conservative. The impulse ratio of 2.68 has been
suggested in [24] for 1.5/40 microsecond impulse waveform while designing
inter-winding and inter-disk insulation, giving the corresponding multiplication
factor of 0.37 for BIL in table 8.2 (in place of 0.44). A lower multiplication factor
may open avenues for insulation optimization since in that case the equivalent
DIL value is lower. On the other hand for impulse overvoltages of more than
hundreds of microseconds duration (close to switching transients), it is risky to
use the impulse ratio between 2.3 to 2.5 (it should be lower). Thus, the correction
factor should be judiciously selected based on detailed analysis and experimental
data. For AC voltages and non-oscillatory impulses having duration other than
that of lightning, switching and long duration power frequency voltages, an
interpolation may be done with caution for finding DIL [47].
Table 8.2 Factors for conversion to one-minute (r.m.s.) power frequency level
Test voltage Multiplication factor
Lightning Impulse Level (BIL) ~(1/2.30)=0.44
Switching Impulse Level (SIL) ~(1/1.80)=0.55
Long duration (one hour) power frequency voltage ~(1/0.80)=1.25
Table 8.3 Impulse ratio
Copyright © 2004 by Marcel Dekker, Inc.
Insulation Design 351
Having estimated the Design Insulation Level at critical electrodes inside the
transformer, one can proceed with the design of insulation system.
8.5 Insulation Between Two Windings
The gap between low voltage (LV) and high voltage (HV) windings is subdivided
into many oil ducts by means of solid insulating barriers (figure 8.12). The
insulation system of oil cooled power transformers consists of combination of oil
and solid insulations (paper and pre-compressed board). The oil and solid
insulations are cheaper than most other insulating materials, and as a combination
they give much higher dielectric strength than individually.
In an oil-pressboard insulation system, since the maximum admissible stress in
a good quality pressboard for one-minute power frequency overvoltage is about
40 kVrms/mm [47], the limiting design stress values are primarily due to stress in
oil. In a good quality system with degassed oil and near uniform field distribution
(e.g., between barriers in the HV-LV gap), typical PD inception field strength
(stress) value for a 8 mm oil duct is 10 kVrms/mm for insulated winding
conductors [46,52]. Since the stress is high at winding conductor corners, the PD
inception field strength of 8 mm oil duct next to windings for degassed oil is
lower, i.e., about 8.4 kVrms/mm. The allowed (design) stress values can be lower
than these PD inception strength values depending on the required safety margin
and quality of manufacturing processes. Thus, the dielectric strength of the solid
insulation is much higher than that of the oil. Since the electric stress (E) is
inversely proportional to the permittivity, the stress in the oil is significantly
higher than that in the solid insulation. The oil permittivity (≅ 2.2)is about half
that of the solid insulation, hence the oil stress is twice the solid insulation stress
in uniform fields. Since the oil has to bear higher stress, it is recommended to make
barriers as thin as possible and give more space for the oil ducts. In the oil-paper-
pressboard insulation system, the strength of the insulation arrangement is
Figure 8.12 Subdivided duct between LV and HV windings
Copyright © 2004 by Marcel Dekker, Inc.