Báo cáo lâm nghiệp: "Genetic structure and phylogeography of pine shoot beetle populations (Tomicus destruens and T. piniperda, Coleoptera Scolytidae) in Italy" pot
Bạn đang xem bản rút gọn của tài liệu. Xem và tải ngay bản đầy đủ của tài liệu tại đây (665.58 KB, 8 trang )
361
Ann. For. Sci. 62 (2005) 361–368
© INRA, EDP Sciences, 2005
DOI: 10.1051/forest:2005031
Original article
Genetic structure and phylogeography of pine shoot beetle populations
(Tomicus destruens and T. piniperda, Coleoptera Scolytidae) in Italy
Massimo FACCOLI*, Alessia PISCEDDA, Paola SALVATO, Mauro SIMONATO, Luigi MASUTTI,
Andrea BATTISTI
Department of Environmental Agronomy and Crop Productions – University of Padua, Agripolis – Viale dell’Università 16/a, 35020 Legnaro (PD), Italy
(Received 4 May 2004; accepted 15 December 2004)
Abstract – Tomicus are among the most dangerous pine pests. In this paper we assess the genetic structure of some Italian Tomicus populations,
and the possible sympatry of T. destruens and T. piniperda. A fragment 358 bp long of the mitochondrial DNA relative to the COI was
investigated in eight populations by SSCP analyses and sequencing. In the sampled populations T. destruens and T. piniperda were not found
to be sympatric. T. destruens populations of southern and central Italy strongly differ from a population of northern Italy. The phylogeographic
analysis of T. destruens populations in Europe is geographically structured, probably due to the fragmentation of the host pine ranges. The
populations of T. piniperda are polymorphic, with haplotypes occurring also in Europe and Asia. T. piniperda populations seem to be
genetically unstructured because of both the continuous distribution area of its main host (Pinus sylvestris) and the international trade of pine
timber.
mtDNA / SSCP / Scolytidae / pine / phylogeography
Résumé – Structure génétique et phylogéographie des populations de Tomicus destruens et T. piniperda (Coleoptera Scolytidae) en
Italie. Le genre Tomicus figure parmi les espèces les plus dangereuses pour les forêts de pins. La structure génétique de huit populations
italiennes de T. destruens et T. piniperda a été étudiée, ainsi que la sympatrie possible des deux espèces. Un fragment de 358 pb de l’ADN
mitochondrial relatif au COI a été amplifié, séquencé et soumis à une analyse par SSCP. Aucun cas de sympatrie n’a été observé entre
T. destruens et T. piniperda. Les populations de T. destruens d’Italie méridionale et centrale sont très différentes d’une population d’Italie du
Nord. T. destruens montre une structuration géographique probablement liée à la distribution fragmentée des pins hôtes. Par contre, les
populations de T. piniperda sont très polymorphes, sans doute à cause de la distribution continue de son principal hôte, le pin sylvestre, ainsi
qu’au commerce international de bois.
1. INTRODUCTION
The pine shoot beetles belonging to the genus Tomicus
Latreille (Coleoptera Scolytidae) are among the most dange-
rous insects living in Eurasian pine forests [23]. These bark
beetles have a major role in the decline of many pine forests
growing in both Europe and Mediterranean countries, inclu-
ding Northern Africa. Among the six species belonging to the
genus Tomicus, only T. piniperda (Linnaeus, 1758), T. des-
truens (Wollaston, 1865) and T. minor (Hartig, 1834) occur in
Europe [21]. Tomicus piniperda is widespread in Eurasia and
it has been recently introduced in North America [13]. Tomicus
destruens occurs in all circum-Mediterranean regions and
Madeira Islands, whereas Tomicus minor occurs in Europe and
Asia.
For a long-time T. piniperda and T. destruens were consi-
dered as synonyms [27], even if attempts to separate the two
species were done [18, 21]. However, recent papers reported
both morphological and genetic characters useful for the sepa-
ration of the two siblings [11, 15, 16]. Nevertheless, species
determination by morphological analysis is still extremely dif-
ficult, and the genetic support is needed. In addition, the sym-
patry of the two Tomicus in some Mediterranean countries [11,
15] makes the identification even more difficult.
The species confusion has made it possible that the largest
part of data published in Mediterranean region, where T. des-
truens is more common, reports T. piniperda as the investigated
species [3–5, 12, 19, 25, 26, 38]. From this point of view, data
concerning many populations of T. destruens are confused and
would need reconsideration. Finally, the lack of specificity of
* Correponding author:
Article published by EDP Sciences and available at or />362 M. Faccoli et al.
Tomicus species for a host plant does not allow to use host spe-
cies as a tool for insect identification, although T. destruens was
found only on Mediterranean pines so far, whereas T. piniperda
was collected from both continental (Pinus sylvestris and
P. nigra) and Mediterranean pines (P. pinaster) [11, 15].
Recently, Ritzerow et al. [24] have used a phylogeographic
approach to the analysis of mtDNA genetic data from several
Eurasian populations of T. piniperda. The study suggests that
only very long distances or important geographic barriers, like
the Pyrenees, are relevant to the separation of the populations
and the consequent differentiation of haplotypes. In this res-
pect, comparative phylogeography permits the investigation of
biogeographic questions on spatial and temporal scales that are
smaller than those typically addressed with other approaches
[2]. Moreover, the phylogeography is useful in elucidating con-
temporary patterns of evolutionary subdivision within species
and species complexes, providing novel insights into the
understanding of biotic diversification [1].
In this paper, we want to use this approach to study evolu-
tionary history and the origin of Italian populations of T. des-
truens and T. piniperda, by genetic markers of mtDNA. The
central geographic position of Italy in the Mediterranean could
be important for understanding the genetic structure of Tomicus
populations occurring in southern Europe. For example, during
the last glaciation Italian pine forests could have been a refuge
area for Tomicus populations, as suggested for other bark beetle
species [31]. In addition, we want to test the possible sympatry
of T. destruens and T. piniperda in Italian transition areas
between continental and Mediterranean pine forests.
2. MATERIALS AND METHODS
2.1. Sample collection and DNA isolation
Adults of Tomicus were collected from eight different populations
living in pine forests growing in Italy (Fig. 1 and Tab. I). The insects
were collected from recently infested pine logs, and firstly identified
by morphological characters [21]. The genomic DNA was extracted fol-
lowing a salting out protocol [20].
2.2. Mitochondrial DNA analysis
A fragment of about 490 bp of the Cytochrome Oxidase I (COI)
was amplified using the lepidopteran mitochondrial primers C1J2441
[29] for both the Tomicus species, and C1N2934, and C1N2937 for
T. destruens and T. piniperda, respectively [16]. Once sequenced, the
COI fragments were used to design a Tomicus specific primer TMC2
(5’-ATTGATGAAATAATATTTCATATAAAATATGC-3’).
The SSCP analysis was performed on a COI fragment 358 bp long,
which was amplified using the primers C1J2441 and TMC2. Template
DNA (4 µL) were used in 12.5 µL of PCR reaction mix, containing
0.5 U of Taq DNA polymerase (Promega
®
), 1× reaction buffer,
1.5 mM MgCl
2
, 0.2 mM of each dNTP’s and 0.5 µM of each primer.
The target region was amplified by 37 cycles of PCR on a Perkin Elmer
DNA Thermal Cycler 9600
®
. Following a pre-denaturation step of
3 min at 94 °C, the thermal profile included denaturation for 1 min at
94 °C, annealing for 1 min at 50 °C, and extension for 1 min at 72 °C.
A final elongation step (5 min at 72 °C) was also performed. Then,
3 µL of the PCR reaction were heat denatured and electrophoresed
through a 11% polyacrylamide gel (29:1 acrylamide:bisacrylamide).
The runs were performed at 10 °C for 10 000 V/h in a 23 cm long vertical
apparatus. The samples were classified into distinct mobility classes
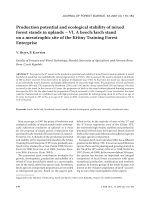
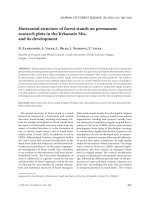
Figure 1. Sampling sites of Italian populations of T. destruens (ITA1-4) and locations of the populations used for the phylogeographic analysis.
The natural range of the potential host pine species P. pinea, P. pinaster, P. brutia and P. halepensis (modified from Critchfield and Little [7])
is given in the background. The actual range is wider for the artificial spread of pine in plantations, as it is evident for the population ITA1.
A three letters abbreviation corresponding to the country and a locality identification number indicates the sites where the populations were
sampled.
genetic structure of Tomicus in Italy 363
(haplotypes) according to their SSCP pattern. In addition, as two
mobility classes were difficult to distinguish, the attribution of indi-
viduals to each class was confirmed by digesting the amplified DNA
with the restriction enzyme Bst1107I, which cuts at a diagnostic site,
followed by an agarose gel electrophoresis.
All the rare haplotypes and a random sample of the more frequent
mobility classes, for a total of 40 individuals (16 of T. destruens, 24
of T. piniperda), were sequenced. The PCR products were then puri-
fied using a pre-sequencing kit (Amersham-Pharmacia Biotech
®
).
Finally, purified DNA was sequenced using a BygDye Terminators
3.0 Cycle Sequencing kit (Applied Biosystems
®
) and it was run in an
ABIPRISM 3700 DNA Analyser (Applied Biosystem
®
).
2.3. Analysis of the genetic data
The genetic sequences of each specimen were aligned using the
ClustalX
®
program [37] and then analysed by MEGA 2.1
®
[17]. We
also investigated genetic variation within single populations of the two
species. The degree of polymorphism of each population was deter-
mined using the program Arlequin 2.0
®
[28], and expressed as haplo-
type (h) and nucleotide diversity (π). The sequences were aligned with
those of T. destruens and T. piniperda available in GenBank.
In order to evaluate the neutrality and mutation/drift equilibrium
of the investigated sequences, i.e. the degree of homogeneity of the
population, we also tested the distance from the neutrality expectations
using both Tajima (D value) [32] and Ewens-Watterson tests (F value)
[10, 39], as implemented in Arlequin 2.0
®
. For mt DNA, high values
of F and negative values of D indicate the occurrence of few common
haplotypes [6]; low F values and positive D values may be expected
in the presence of subdivided populations or migration [30]. The hap-
lotype networks for the COI data was constructed using the software
TCS 1.18. The TCS program creates a haplotype network using Sta-
tistical Parsimony [34], which outputs the 95% plausible set of most
parsimonious linkages among haplotypes. Ambiguous linkages are
depicted by “loops” in the haplotype network.
To have a comparison in a wider phylogeographic context, the
T. destruens sequences were compared with those deposited in Gen-
Bank. Because the COI region sequenced in our analysis was not the
same of those deposited in GenBank, the alignment was reduced to
185 bp. Differently, the whole Italian sequences of 358 bp of T.
piniperda were compared with the corresponding part of those
reported by Ritzerow et al. [24].
The haplotype network was then nested into a series of clades fol-
lowing Templeton et al. [33] and Templeton and Sing [35] and used
for nested clade analysis using the GeoDis 2.0 program [22]. Nested
clade analysis provides an objective statistical framework for discrim-
inating among historical (e.g., range expansion and fragmentation)
and recurrent (e.g., gene flow and drift) processes that may explain the
observed distribution of genetic variation. The geographical data were
quantified as Dc (geographical spread of a particular clade) and Dn
(distribution of a given clade relative to the sister clades). This analysis
tested the association of clades with geographical locations, the sig-
nificance of the distances Dc and Dn, as well as the contrasts between
interior-tip subgroups. The statistical significance of these measures
was determined using random permutation tests, which simulate the
null hypothesis of a random geographical distribution for all clades
within a nesting category, given the marginal clade frequencies and
sample sizes per locality. The interpretation of the observed distances
was carried out using the revised inference key by Templeton [36]
(accessible at: />3. RESULTS
The morphological and genetic analysis of the eight Italian
populations allowed to attribute all the individuals within a
population to one of the two species, excluding the sympatric
occurrence of the two Tomicus in the study sites (Tab. I). The
investigated populations showed a polymorphism associated to
several classes of mobility, i.e. haplotypes. The SSCP analyses
carried out on 159 specimens clearly distinguished seven
haplotypes for T. destruens and eleven for T. piniperda
(Tab. II). The sequencing of all the variants confirmed the pre-
sence of at least one nucleotide substitution from one to ano-
ther. Moreover, the sequence analysis of five (T. destruens) and
eight (T. piniperda) individuals sharing the same haplotype in
different populations confirmed the accuracy of the SSCP
method. The sequence of each different haplotype has been
deposited in GenBank under accession numbers AY796318 -
AY796332. The analysed fragment of COI (358 bp) revealed
seven (7 transitions and 1 transversion) and thirteen variable
sites (13 transitions and no transversion) for T. destruens and
T. piniperda, respectively (Tab. III). For both species all the
mutations were synonymous.
The number of private haplotypes was 3 in T. destruens
(A, C, G) and 6 in T. piniperda (4, 5, 6, 8, 10, 11) (Tab. II).
Haplotype diversity (h) and nucleotide diversity (π) for each
population are showed in Table IV.
Table I. Characteristics of the Tomicus populations sampled in Italy. N: number of insects collected in each population; Host pine: P.P.: Pinus
pinaster, P.D.: Pinus pinea, P.H.: Pinus halepensis, P.N.: Pinus nigra, P.S.: Pinus sylvestris.
Species Code N Locality Lat. N Long. E
Altitude
m a.s.l.
Host pine Date
T. destruens
ITA1 19 Valle Vecchia (VE) 45° 54’ 12° 36’ 3 P.P. 03/2001
ITA2 17 Poggio Valicaia (FI) 43° 34’ 11° 13’ 370 P.P. 04/2002
ITA3 18 Alberese (GR) 42° 40’ 11° 06’ 42 P.D. 03/2002
ITA4 16 Ginosa (TA) 40° 34’ 16° 45’ 240 P.H. 03/2002
T. piniperda
ITA5 20 Villasantina (UD) 46° 25’ 12° 55’ 363 P.S. 04/2001
ITA6 16 Passo del Bocco (GE) 44° 20’ 9° 23’ 956 P.N. 04/2002
ITA7 12 Rocciamelone (TO) 45° 10’ 7° 08’ 1600 P.S. 05/2002
ITA8 20 Sonico (BS) 46° 11’ 10° 23’ 1010 P.S. 11/2002
364 M. Faccoli et al.
Table II. Mitochondrial haplotypes found in Tomicus destruens and Tomicus piniperda collected from different pine stands. N: total specimens
per population.
Species Population N Haplotypes
T. destruens
ABC DE F G
AY796318 AY796319 AY796320 AY796321 AY796322 AY796323 AY796324
ITA1 19 12 6 – – – 1 –
ITA2 17 – 13 1 1 1 1 –
ITA3 18 – 14 – 2 1 1 –
ITA4 16 – 10 – – – 4 2
T. piniperda
1234567891011
AY796325 AY796326 AY796327 AY796328 AY796329 AY796330 AY796331 AY796332
ITA5
20
18 1 1 – – – – – – – –
ITA6
16
96––––1––––
ITA7
12
6–1–1–––121
ITA8
20
10 – – 3 – 4 1 1 1 – –
Table III. Variable nucleotide sites in the 7 haplotypes of T. destruens and 11 haplotypes of T. piniperda defined on the basis of 358 bp of the
mitochondrial DNA Cytochrome Oxidase I. The numbers indicate variable positions corresponding to positions of haplotype B for T. des-
truens and haplotype 1 for T. piniperda.
T. destruens T. piniperda
Position Position
Haplotype 85 175 217 250 328 340 349 Haplotype 28 46 111 150 175 181 223 229 250 320 331 351 354
B CA G C C A C 1 TT G C A T C A C T G T C
G T 9 .T
D A 2 C. .
E T 3 . .C
F . . T . . 5 C G C
C .G T 7 C.ATG C
A T. . . TGT 11 G C
8 . . G . T G . C . . .
6 .C G CAC.
4 . .CA
10 CA.T
Table IV. Haplotype and nucleotide diversity with result of the Tajima and Ewens-Watterson neutrality tests on the analysed COI segment in
Tomicus Italian population. F
obs
– F
exp
is the difference between the observed and expected homozygosity (* P < 0.05, ** P < 0.01).
Populations Haplotype diversity (h) Nucleotide diversity (π)
Tajima’s
D statistic
F
obs
– F
exp
T. destruens ITA1 0.5263 (±0.0887) 0.005449 (±0.003609) 2.02065* –0.05421
ITA2 0.4265 (±0.1468) 0.001630 (±0.001542) –1.55781* 0.25791**
ITA3 0.3987 (±0.1379) 0.001172 (±0.001250) –0.68482 0.1927*
ITA4 0.5667 (±0.1090) 0.001775 (±0.001636) 0.12996 –0.07042
T. piniperda ITA5 0.1947 (±0.1145) 0.000560 (±0.000809) –1.51284* 0.25559**
ITA6 0.5750 (±0.0799) 0.003175 (±0.002433) –1.2933 –0.01183
ITA7 0.7576 (±0.1221) 0.004990 (±0.003487) –0.41098 0.06363
ITA8 0.7158 (±0.0875) 0.007681 (±0.004743) –0.44013 0.02585
genetic structure of Tomicus in Italy 365
For T. destruens the Tajima’s D value was lower than expec-
ted in two populations (ITA2 and ITA3), but statistical signi-
ficance was reached only in ITA2 (Tab. IV). However,
integrating the Tajima’s test with the Ewens-Watterson test
(F value), also the ITA3 population showed a homozygosity
degree significantly higher than in expected neutrality condi-
tions (Tab. IV). D value was significantly higher than expected
only for the ITA1 population (Tab. IV). Both tests indicated
that ITA4 was in equilibrium (F and D value close to zero).
Concerning T. piniperda all populations show Tajima’s
D values lower than expected, but only the ITA5 population
shows statistical significance (Tab. IV). In addition the popu-
lation ITA6 seems to be in equilibrium having both F and
D value close to zero.
The haplotypes B and F of T. destruens were the most com-
mon. The haplotype A was the most differentiated from the
haplotypes B and F (three and four mutational steps respecti-
vely) (Fig. 2a). The haplotype G was occurring only in the
southern population of T. destruens living on Pinus halepensis.
Haplotypes C, D and E were found only in central Italy. The
analysis of European sequences showed that the haplotypes B
and F were the most common found in populations of T. des-
truens sampled in western Mediterranean basin (Italy, France
and Spain) (Fig. 2b). The haplotype A was similar to a haplo-
type found in Greece (accession number AF356552) (Fig. 2b),
suggesting its probable eastern origin. The comparison with
sequences deposited in GenBank showed that the haplotype G
was already found in France on the same host tree [15]. Finally,
the haplotypes C and E were found only in Italy. Other four pri-
vate haplotypes occurred in continental France and Spain
(Fig. 2b).
The nested clade design included 11 haplotypes across two
nesting levels (Fig. 2b). At the total cladogram level the ana-
lysis showed that there was a restricted gene flow excepted for
the clade 1-4, which includes the haplotype A occurring only
in North Italy and Greece, showing a long-distance dispersal
(Fig. 2b).
In T. piniperda, the haplotype 1 was the most common, whe-
reas the other haplotypes occurred in very few individuals
(Fig. 3 and Tab. IIb). The populations sampled at the southern
edge of host’s range (ITA5 and ITA6) were much less hetero-
geneous than populations collected within the range (ITA7 and
ITA8), which shared most of the rare haplotypes. On a wider
scale, Italian haplotypes 1, 2 and 9 occurred also in Europe, in
particular as fragments of haplotypes I, II, VII for 1, IV for 2,
and VIII, IX for 9 [24]. The other eight haplotypes were found
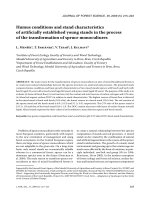
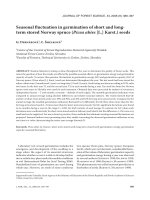
Figure 2. (a) Italian haplotype network of T. destruens based on 358bp. Each line represents a mutational step; small squares refer to missing
or theoretical haplotypes. Circles represent haplotypes with size proportional to relative frequencies; sectors of different colours refer to absolute
number of haplotype counts for each population. (b) Haplotype network based on mutational differences in the COI mtDNA sequences of
T. destruens populations. Italian haplotypes are reported as bold letters, whereas haplotypes from GenBank are indicated by their accession
numbers. The list below the figure reports the haplotypes of T. destruens deposited in GenBank and matching the Italian ones for the 185bp
allowed by the overlapping. The sites in which haplotypes were found are indicated with the country abbreviation and the locality identification
number (see Fig. 1). In addition, the nested clade analysis is reported: the clades are identified using a two numbers system with the first number
referring to the nesting hierarchy and the second is the clade identification number. “0” means a missing or theoretical haplotype.
366 M. Faccoli et al.
only in Italy. The nested clade analysis gave as result an incon-
clusive outcome, showing a low phylogeographic structure for
T. piniperda.
4. DISCUSSION
In this paper we show that the two sibling species of pine
shoot beetle, Tomicus destruens and Tomicus piniperda, differ
strongly in relation to the genetic structure of their populations
in Italy as well as in Europe. T. destruens is characterized by a
strong phylogeographic structure, whereas this was not obser-
ved for T. piniperda. As T. destruens has been shown to be asso-
ciated exclusively with Mediterranean pine species [21], the
high fragmentation of the hosts range seems to be the most
likely factor explaining the separation of the populations. Con-
versely, the continuous range of the main host of T. piniperda
(P. sylvestris), and the possibility for this species to colonize
other hosts and even Mediterranean pines [11, 15], appear to
be the main reason for the lack of genetic structure [24], in spite
of the very numerous private haplotypes found in Italy as well
as in other regions.
In this study Tomicus destruens and T. piniperda were not
found to be sympatric, not even in the transition areas from
coastal to alpine stands, such as in ITA1 and ITA5 populations.
T. destruens was found only on Mediterranean pine species
(Pinus pinea, P. pinaster and P. halepensis), whereas Tomicus
piniperda was collected only from continental pine species
such as P. nigra and P. sylvestris. The phylogeographic analy-
sis of T. destruens shows that the populations of France, Italy
and Spain are well structured, having their own haplotypes.
However, it was possible to verify that some Italian haplotypes
were already found in Europe. In particular, the haplotypes B
and F were the most common haplotypes found in all the inves-
tigated Italian populations, as well as in many French and Spa-
nish populations [11, 15, 16], suggesting their older origin.
Besides, the haplotype G found in insects sampled from Pinus
halepensis (ITA4), was found also in France from the same host
tree [15], indicating a possible differentiation in relation to this
host or its habitat, which is typical of warm and dry Mediter-
ranean areas.
The genetic structure of the northern population (ITA1) is
quite different from those of the other investigated populations
(Fig. 2b). The haplotype A was the only found in four speci-
mens of a Greek population [16], suggesting a Balkan origin
of the ITA1 population. In fact, this population originates from
a coastal plantation of Mediterranean pines about 50 years old,
belonging to a system of plantations created to protect the
Adriatic coasts since the Roman time, about 2000 years ago [8].
It appears that part of Tomicus population probably came from
the eastern coast of Adriatic sea (haplotype A), whereas a part
came from the south-western Adriatic coast, through the coas-
tal system of pine plantations (haplotypes B and F). In this res-
pect, the ITA1 population seems to occur in a contact area
between western and eastern parts of Mediterranean basin. This
hypothesis is confirmed by the high D value (Tab. IV), which
is usually expected either from populations affected by strong
immigration or divided in sub-populations having a high num-
ber of haplotypes and a heterogeneous genetic pool [30].
Finally, the haplotypes C and E (from ITA2 and ITA3) seem
to be characteristic of central Italy. In this respect, the results
obtained with Tajima’s test and the Ewens-Watterson test for
the ITA2 and ITA3 populations (Tab. IV) can be expected in
populations having had either a bottleneck [32] or a rapid
growth from a fewer number of individuals [30], as already sug-
gested by Kerdelhué et al. [15]. However, populations from
central and southern Italy share most haplotypes with French
populations [15], to which they are connected through the con-
tinuous distribution of pine stands along the coast.
The analysis of new populations from the eastern Mediter-
ranean and northern Africa could shed more light on the genetic
structure of T. destruens, as well as the analysis of populations
established in artificial plantations of pines along the Mediter-
ranean coasts could provide useful information on the insect
dispersal and associated gene flow.
Concerning T. piniperda, the high number of haplotypes
(11) found in the Italian populations can be explained by the
fact that many individuals were analysed for each population,
increasing the probability to find new haplotypes. Another pos-
sible explanation of the high number of isolated haplotypes
(8 out of 11) can be found in the role played by the Alps during
the last glaciation, as they were a refuge area for many Euro-
pean insect populations forced to move southward, looking for
more suitable climatic conditions [14]. This migration had the-
refore increased the genetic pool of T. piniperda in Italy, as it
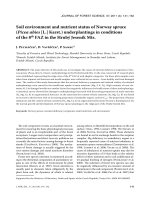
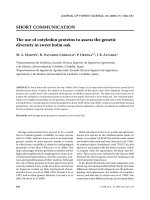
Figure 3. Italian haplotype network of T. piniperda based on 358 bp
(for figure explanation see Fig. 2).
genetic structure of Tomicus in Italy 367
has been observed also for the spruce bark beetle Ips typogra-
phus, which also has a large Palaearctic diffusion [31]. Similar
considerations were reported by Ritzerow et al. [24], who sug-
gest the high polymorphism of T. piniperda as due to the exis-
tence of several distinct refugial areas during the last ice age.
A fragmentation and prolonged genetic isolation of European
populations during the last glacial period could have led to the
origin of new haplotypes. The same authors identify the area
of Southern France, the Iberian Peninsula and the area south of
S. Petersburg as refugial areas. Based on our results, it seems
that Italy could have been a refuge area as well. The available
data did not allow to delineate a clear geographic characterisa-
tion of T. piniperda populations, as shown by Ritzerow et al.
[24]. This can be explained by both the lower number of bp used
in our analysis and by the addition of the new Italian haplotypes.
The only consideration deals with the haplotypes 1 and 2, which
are the most common in Europe and probably the most ancient
haplotypes of the taxon.
Little information exists about the migration routes of most
T. piniperda haplotypes. It has been suggested that a parallel
evolution occurred between T. piniperda and its main host,
P. sylvestris, which has a very large and continuous distribution
covering all Europe and Asia [9, 24]. That gives to the insect
the possibility to move along both east-west and north-south
directions. In addition, we suggest that the increase of the inter-
national trade of pine wood is responsible of insect movement
among countries and even continents. In this concern, Ritzerow
et al. [24] reported that the populations of T. piniperda found
in North America were introduced from Europe, based on
haplotype identity. Following the previous considerations, the
low genetic structure of T. piniperda seems to be due to both
the large and continuous range of its main host and to the inten-
sive trade of timber among different countries, which led to a
general mixing of haplotypes coming from different popula-
tions.
Acknowledgements: The work has been supported by a grant MIUR-
PRIN 2001 to L. Masutti. The authors are very grateful to Diego Gal-
lego, Christian Stauffer and two anonymous reviewers for the critical
revision of the manuscript and for their precious advise. A special
thank to Tomaso Patarnello and Lorenzo Zane for the use of labora-
tories and facilities.
REFERENCES
[1] Arbogast B.S., Kenagy G.J., Comparative phylogeography as an
integrative approach to historical biogeography, J. Biogeogr. 28
(2001) 819–825.
[2] Avise J.C., Phylogeography: the history and formation of species,
Harvard University Press, Cambridge, MA, USA, 2000.
[3] Balachowsky A., Faune de France: Coléoptères Scolytides, Faune
de France, 50, Libraire de la Faculté des Sciences, Paris, 1949.
[4] Carle P., Problèmes posés par les ravageurs xylophages des conifè-
res en forêt méditerranéenne, Rev. For. Fr. 27 (1975) 283–296.
[5] Chararas C., Étude biologique des scolytides des conifères, Enc.
Ent. 37, Lechevalier, Paris, 1962.
[6] Clark A.G., Neutrality tests of highly polymorphic restriction-frag-
ment-length polymorphisms, Am. J. Hum. Genet. 41 (1987) 948–
956.
[7] Critchfield W.B., Little E.L. Jr., Geographic distribution of the
pines of the World. USDA, For. Serv. Misc. Publ., 1966.
[8] Del Favero R., De Mas G., Ferrari C., Gerdol R., Lasen C., Masutti
L., De Battisti R., Paiero P., Colpi C., Urso T., Zanotto S., Le pinete
litorali nel Veneto, Regione del Veneto, Multigraf (VE), 1989.
[9] Duan Y., Kerdelhué C., Ye H., Lieutier F., Genetic study of the
forest pest Tomicus piniperda (Col., Scolytinae) in Yunnan pro-
vince (China) compared to Europe: new insights for the systematics
and evolution of the genus Tomicus, Heredity 93 (2004) 416–422.
[10] Ewens W.J., The sampling theory of selectively neutral alleles,
Theor. Popul. Biol. 3 (1972) 87–112.
[11] Gallego D., Galian J., The internal transcribed spacers (ITS1 and
ITS2) of the rDNA differentiates the bark beetle forest pests Tomi-
cus destruens and T. piniperda, Insect Mol. Biol. 10 (2001) 415–
420.
[12] Gil L., Pajares J.A., Los escolitidos de las coniferas en la Peninsula
Iberica, Publicaciones del Ministerio de Agricultura, Pesca y Ali-
mentacion – Secretaria General Tecnica, Madrid, 1986.
[13] Haack R.A., Kucera D., New introduction – Common pine shoot
beetle, Tomicus piniperda (L.), USDA For. Serv., north-eastern
area, pest alert, NA-TP-05-93, 1993.
[14] Hewitt G., The genetic legacy of the Quaternary ice ages, Nature
405 (2000) 907–913.
[15] Kerdelhué C., Roux-Morabito G., Forichon J., Chambon J M.,
Robert A., Lieutier F., Population genetic structure of Tomicus
piniperda (Curculionidae: Scolytinae) on different pine species and
validation of T. destruens (Woll.), Mol. Ecol. 11 (2002) 483–494.
[16] Kohlmayr B., Riegler M., Wegensteiner R., Stauffer C., Morpholo-
gical and genetic identification of the three pine pests of the genus
Tomicus (Coleoptera, Scolytidae) in Europe, Agric. For. Entomol.
4 (2002) 151–157.
[17] Kumar S., Tamura K., Jakobsen I.B., Nei M., MEGA 2.1, Molecu-
lar Evolutionary Genetics Analysis Software, Bioinformatics,
2001.
[18] Lekander B., On Blastophagus destruens Woll. and a description of
its larva (Col. Scolytidae), Entomol. Tidskr. 92 (1971) 271–276.
[19] Masutti L., Pinete dei litorali e Blastophagus piniperda L. – Una
difficile convivenza, Monti e Boschi 3 (1969) 15–27.
[20] Patwary M.U., Kenchington E.L., Bird C.J., Zouros E., The use of
random amplyfied polymorphic DNA markers in genetic studies of
the sea scallop Plactopecten magellanicus (Gmellin, 1791), J. Shell
Res. 13 (1994) 547–553.
[21] Pfeffer A., Zentral- und westpaläarktische Borken- und Kernkäfer
(Coleoptera: Scolytidae, Platypodidae), Pro Entomologica, Natu-
rhistorisches Museum Basel, 1995.
[22] Posada D., Crandall K.A., Templeton A.R., GeoDis: a program for
the cladistic nested analysis of the geographical distribution of
genetic haplotypes, Mol. Ecol. 9 (2000) 487–488.
[23] Postner M., Scolytidae Borkenkäfer, in: Schwenke W. (Ed.), Die
Forstschädlinge Europas, Bd. 2, Käfer, Verlag Paul Parey, Hamburg
und Berlin, 1974.
[24] Ritzerow S., Konrad H., Stauffer C., Phylogeography of the Eura-
sian pine shoot beetle Tomicus piniperda (Coleoptera: Scolytidae),
Eur. J. Entomol. 101 (2004) 13–19.
[25] Russo G., Il blastofago del pino (Blastophagus (Myelophilus) pini-
perda L. var. rubripennis Reitter), R. Lab. Entomol. Agr., Fac. di
Agraria di Portici 19 (1940) 1–13.
[26] Russo G., Scolitidi del Pino del litorale toscano, Boll. Ist. Entomol.
“G. Grandi”, Univ. Bologna 15 (1946) 297–314.
[27] Schedl K.E., Scolytidae, Platypodidae, in: Winkler A. (Ed.), Cata-
logus Coleopterorum Regionis Palaearctica, Wien, 1932, pp. 1632–
1647.
368 M. Faccoli et al.
[28] Schneider S., Roessli D., Excoffier L., Arlequin ver. 2.000: a soft-
ware for population genetic data analysis, University of Geneva,
Geneva, 2000.
[29] Simon C., Frati F., Beckenbach A., Evolution, weighting and phy-
logenetic utility of mitochondrial gene sequences and phylogenetic
utility of mitochondrial gene sequences and a compilation of con-
served polymerase chain reaction primers, Ann. Entomol. Soc. Am.
87 (1994) 651–701.
[30] Simonsen K.L., Churchill G.A., Aquadro C.F., Properties of Statis-
tical Tests of Neutrality for DNA Polymorphism Data, Genetics
141 (1995) 413–429.
[31] Stauffer C., Lakatos F., Hewitt G.M., Phylogeography and postgla-
cial colonization routes of Ips typographus L. (Coleoptera, Scolyti-
dae), Mol. Ecol. 8 (1999) 763–773.
[32] Tajima F., Statistical method for testing the neutral mutation hypo-
thesis by DNA polymorphism, Genetics 123 (1989) 585–595.
[33] Templeton A.R., Boerwinkle E., Sing C.F., A cladistic analysis of
phenotypic associations with haplotypes inferred from restriction
endonuclease mapping. I. Basic theory and an analysis of alcohol
dehydrogenase activity in Drosophila, Genetics 117 (1987) 343–
351.
[34] Templeton A.R., Crandall K.A., Sing C.F., A cladistic analysis of
phenotypic associations with haplotypes inferred from restriction
endonuclease mapping and DNA sequence data. III. Cladogram
estimation, Genetics 132 (1992) 619–633.
[35] Templeton A.R., Sing C.F., A cladistic analysis of phenotypic asso-
ciations with haplotypes inferred from restriction endonuclease
mapping. IV. Nested analyses with cladogram uncertainty and
recombination, Genetics 134 (1993) 659–669.
[36] Templeton A.R., Statistical phylogeography: methods of evalua-
ting and minimizing inference errors, Mol. Ecol. 13 (2004) 789–
809.
[37] Thompson J.D., Gibson T.J., Plewniak F., Jeanmougin F., Higgins
D.G., The Clustal X windows interface: flexible strategies for mul-
tiple sequence alignment aided by quality analysis tools, Nucleic
Acids Res. 24 (1997) 4876–4882.
[38] Triggiani O., Tomicus (Blastophagus) piniperda (Coleoptera, Sco-
lytidae, Hylesininae): biologia, danni e controllo nel litorale ionico,
Entomologica 19 (1984) 5–21.
[39] Watterson G.A., The homozygosity test of neutrality, Genetics 88
(1978) 405–417.
To access this journal online:
www.edpsciences.org