Báo cáo lâm nghiệp: " Quantitative trait loci mapping for vegetative propagation in pedunculate oak" docx
Bạn đang xem bản rút gọn của tài liệu. Xem và tải ngay bản đầy đủ của tài liệu tại đây (197.39 KB, 6 trang )
369
Ann. For. Sci. 62 (2005) 369–374
© INRA, EDP Sciences, 2005
DOI: 10.1051/forest:2005032
Original article
Quantitative trait loci mapping for vegetative propagation
in pedunculate oak
Caroline SCOTTI-SAINTAGNE, Evangelista BERTOCCHI, Teresa BARRENECHE, Antoine KREMER,
Christophe P
LOMION*
UMR 1202 BIOGECO, INRA, Équipe de Génétique, 69 route d’Arcachon, 33612 Cestas Cedex, France
(Received 23 September 2004; accepted 12 October 2004)
Abstract – Vegetative propagation is one of the main methods used for the deployment of improved genetic forest tree species. The objective
of this paper was to study the genetic architecture of vegetative propagation by detecting Quantitative Trait Loci (QTL) in pedunculate oak
(Quercus robur). The mapping population consisted on an F
1
family of 278 offspring. Assessment of rooting ability over three years permitted
the detection of 10 QTLs explaining between 4.4 and 13.8% of phenotypic variance, of which the two strongest were stable across years.
Ongoing genomics programs in trees and in Arabidopsis are starting to shed light on the nature of the underlying genes.
vegetative propagation / QTL / Quercus robur
Résumé – Détection de locus à effet quantitatif qui contrôlent l’aptitude au bouturage chez le chêne pédonculé. La multiplication
végétative est une des principales méthodes utilisée pour l’exploitation du matériel forestier amélioré. L’objectif de cet article était d’étudier
l’architecture génétique de la propagation végétative en détectant des QTL chez le chêne pédonculé (Quercus robur). La population de
cartographie consistait en une famille F
1
de 278 descendants. La mesure de l’aptitude à l’enracinement durant quatre années a permis de
détecter 10 QTL expliquant entre 4,4 et 13,8 % de la variance phénotypique, les deux plus forts étant stables à travers les années. L’avancée
des programmes de génomique chez les arbres et chez Arabidopsis permettra de déterminer la nature des gènes sous-jacents.
multiplication végétative / QTL / Quercus robur
1. INTRODUCTION
Most traits in forest trees do not display a discrete distribu-
tion but result from the collective action of multiple genes
which exhibit, in segregating populations, quantitative varia-
tion. Up to 1980, most studies on the genetic basis of quantita-
tive traits considered only the aggregate effects of all the genes
causing the variation [14]. In the 1980s, two developments
made it possible to study the individual genes controlling quan-
titative traits, known as Quantitative Trait Loci or QTL [16].
On the one hand, the advance of DNA marker-based technolo-
gies allowed the construction of genetic linkage maps, covering
the entire genome of many forest tree species [10]. On the other
hand, the development of dedicated statistical methods allowed
to link polymorphism in molecular markers with the phenoty-
pic variation of the quantitative traits [9]. Analysis of variance
and interval mapping approaches have been widely used by
forest geneticists [28] but the limited size of forest tree segre-
gating populations has often led to an over-estimation of QTL
effects (the so called Beavis effect, [1]) and contributed to the
large confidence intervals associated with QTL locations. More
recently, statistical approaches have been developed to increase
the statistical power of QTL detection and have received
increasing attention in QTL experiments [7, 27]. One of theses
approaches is the composite interval mapping developed by
Zeng [31] and Jansen and Stam [21], which combines interval
mapping with multiple regression. Like simple interval map-
ping, this method evaluates the possibility of a target QTL at
multiple analysis points across each interlocus interval. Moreo-
ver, at each point it also includes in the analysis the effect of
one or more markers elsewhere in the genome. Besides these
statistical procedures, it has been clearly shown that the power
of QTL detection largely depends on quality of the phenotypic
assessment. Without the possibility of developing F3 popula-
tions or even recombinant inbred lines to precisely estimate the
value of the traits, clonally propagated material has became the
material of choice for forest tree geneticists [6, 27].
Vegetative propagation ability varies between and within
species, and even within an individual, depending upon life
stage [20]. Very few QTL studies have made used of vegetatively
* Corresponding author:
Article published by EDP Sciences and available at or />370 C. Scotti-Saintagne et al.
propagated material: in poplar for bud phenology [15], in Salix
for growth [29] and in oak for leaf morphology [27]. Benefits
of vegetatively propagated material include the possibility of
detecting QTL × environment interactions and to perform des-
tructive testing of individual ramets for wood quality, biomass,
or disease resistance assessment, without loss of the genotype [6].
Considering the importance of vegetative propagation in the
breeding programs of some major tree species (e.g. Eucalyptus,
Populus, Salix, Cryptomeria), several investigations have been
conducted to understand the genetic basis of this trait. In Euca-
lyptus the heritability for vegetative-propagation traits was
found to be moderate (h
2
= 0.4) [4]. The genetic architecture
of adventitious rooting ability has been shown to be controlled
by a relatively small number of major-effect QTL [18]. Simi-
larly, in poplar, the heritability for in vitro adventitious root
regeneration was found to be very high (0.72) and controlled
by a major QTL explaining 37% of the phenotypic variance
[19]. In addition to a strong genetic control of adventitious roo-
ting ability, QTLs were found to be stable across environments.
Out of the 9 QTLs detected in Eucalyptus by Marques et al.
[24], five were found to be stable over two consecutive years.
The purpose of the present work was to investigate the gene-
tic basis of vegetative propagation ability in pedunculate oak
(Quercus robur L.). QTL detection was performed in an F
1
family. The assessment during four years made it possible to
study QTL stability over time.
2. MATERIALS AND METHODS
2.1. Plant material
A full-sib family of Quercus robur (278 individuals) was estab-
lished in the field as mother stock plants as described in Saintagne et al.
[27]. Since the age of five years, each stool-bed was hedged yearly at
the level of the ground in late-February. In late April, when sprouts
were fully elongated, cuttings were prepared for vegetative propaga-
tion. The cuttings consisted of stem segments about 10 to 12 cm long,
comprising at least two internodes. On average about 20 cuttings were
used for propagation of each stool bed. They were dipped in a rooting
hormone (Rhipozon AA 0.5) and transplanted in 80 cm
3
containers
with a 60/40 mixture of peat/ perlite. The cuttings were then transferred
to a fog system-watered greenhouse. The first rooting occurred after
five weeks, and more than 60% of the cuttings rooted within two
months. The rooted cuttings were further transplanted into 4 L con-
tainers (with a mixture of 2/1/2: peat/sand/pine bark) in September.
They over-wintered in a greenhouse and grew outdoors in the nursery
for an additional year. The procedure for vegetative propagation was
used recurrently over four successive years from 1997 to 2000 on 232
offspring among the 278. The measurements were as percent cuttings
able to root (Cutt).
2.2. Data analysis
A map was constructed for each parent of the cross following the
so called double-pseudo-testcross mapping strategy [17] as previously
described in Saintagne et al. [27]. The data originated from 128 mark-
ers recorded on each of the 278 full sibs and evenly distributed
throughout the genome. The female framework map was composed
of 75 markers and covered a distance of 902 cM, with an average spac-
ing between markers of 14 cM. The male framework map comprised
72 markers over a total distance of 933 cM, with an average marker
spacing of 15.5 cM. QTL detection was done separately for each
parental map. We used the Composite Interval Mapping method [21],
implemented in the MultiQtl software ([8]; />theor), to detect QTL and estimate their phenotypic effect [31]. Stand-
ard deviation was estimated for each QTL position by bootstrap with
1000 resamplings. Empirical statistical significance thresholds for
declaring the presence of a QTL was determined by permutation
(1000 replicates) of the data set [11]. Since the permutation tests were
performed separately on each chromosome, we further computed the
corresponding Type I error rate at the whole genome level as explained
in Saintagne et al. [27]. Epistatic interactions between pairs of markers
were investigated by a two-factor analysis of variance using the Q gene
software ( The detection threshold for epi-
static effect was fixed at 0.01 for the N tests, corresponding to a prob-
ability of 0.0001 for a single test using the Bonferroni correction.
Graphs of linkage maps and QTL were drawn using the MapChart soft-
ware version 2.0 [30]
2.3. Statistical significance of colocalisation between
QTL detected in two different years
To exclude that the overlap of QTL in two different years was due
by chance alone, we calculated the probability of the observed distri-
bution of QTL in two different years under the null hypothesis of ran-
dom distribution [22]. To do so, the genome was subdivided into N
intervals. Interval size corresponds to the mean distance between the
position of the highest LOD score from the composite interval map-
ping (P1) and the position of the mean value for maximum LOD score
after bootstrap analysis (P2). If L is the number of QTLs in a given
year exhibiting the largest number of QTLs, S the number of QTLs in
an other year, and M the number of QTLs shared by the two years,
then the probability of having M intervals in common between the two
years is given by the following ratio of combinations:
.
On average the distance between P1 and P2 was 7 cM. Since the
length of the female map and male were 902 cM and 933 cM, the number
of intervals which were compared was 129 and 133 in the female and
male maps, respectively.
3. RESULTS AND DISCUSSION
3.1. Phenotypic variation
The frequency distribution of vegetative propagation ability
(Cutt) is presented in Figure 1. Only measurements realised in
1998 were normally distributed, as shown by the Box and Cox
method [5]. A square root transformation was applied to nor-
malize the data for the other measurements.
Due to the difficulty to vegetatively propagate adult plant
material, ability for vegetative propagation had not been
recorded on the parents. On average, 40% of the cuttings rooted
over the four years (Tab. I). The coefficient of phenotypic var-
iation was 0.67 (averaged over the four years) with the strongest
value in 2000 (0.92). A significant year effect, as tested by a
one way ANOVA (data not shown) was detected, indicating a
significant environment effect on the ability to vegetative prop-
agation. Absence of replicates within year of assessment did not
permit to calculate repeatability (within family heritability),
neither to test the clone × year interaction. However, the highly
Pvalue
C
L
M
C
L
SM–
×
C
N
S
=
Genetics of rooting ability in oak 371
variable phenotypic correlations among pair of years (Tab. II)
suggest the presence of clone × year interaction. In other
words, the clone classification could vary between years. Nota-
bly, phenotypic correlations were very weak between the first
year of measurement (1997) and the following years (1998,
1999, 2000). As a result, QTL detection was performed on each
year separately rather than on the mean values.
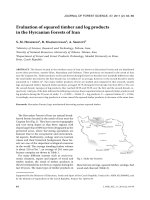
3.2. QTL detection
Ten QTLs significant at 5% at the genome level were detec-
ted (Tab. III). If we consider as the same QTL those detected
on the same region during several years, this number drops
down to 6 putatively unique QTLs (Fig. 2). The percent of phe-
notypic variance explained by each QTL was small to mode-
rate, varying from 4.3 to 13.8% (Tab. III). Again, absence of
replicates did not allow estimation of QTL genetic effect.
However, taking into account the weak to moderate inter-
annual correlations it could be assume a strong environment
effect and a weak heritability for this trait. Consequently the
part of genetic variation explained by each QTL could be very
high. The number of QTLs detected per year varied from zero
in 1997 to 4 in 1998. No epistatic effect was detected between
pairs of markers for any of the four years of assessment. Among
the 10 QTLs, 3 were specific to year 1998 (LG1m, 3m and 7f).
The other 7 QTLs were detected on the male map across at least
two years (LG6m and LG8m), with one being found for three
years on LG12m. The coincidence between the QTLs detected
on LG6m, LG8m LG12m in 1999 and 2000 was highly signi-
ficant (P =2.6×10
–6
), indicating that the genetic control of
vegetative propagation was not disrupted by environmental
variation in these particular genomic regions. The discrepancy
between the detection of stable QTLs across years on the one
hand, and the weak inter-annual phenotypic correlation on the
other hand, could be explained by the cumulated effect of year-
specific QTLs displaying a too small phenotypic effect to be
detected in the oak progeny. Stable QTLs across years have
been already found in Eucalyptus by Marques et al. [24]. These
authors identified 9 QTLs explaining between 2.79 and 8.11%
of the phenotypic variance of rooting ability, with 5 being
detected in two consecutive years and 4 being specific to only
one year. In maritime pine (C. Plomion, unpublished data), only
Table I. Mean and coefficient of phenotypic variation for percentage
of rooting (cutt).
Year 1997 1998 1999 2000
Mean 30.41 51.73 45.78 30.06
Standard deviation 20.61 22.94 28.43 27.51
CV
P
0.68 0.45 0.62 0.92
Figure 1. Frequency distribution for vegetative propagation. On the x axis is represented the percent of cutting that rooted, and on the y axis
the number of individuals.
Table II. Pearson correlations coefficient for percentage of rooting
(cutt) over 4 successive years. Values indicated in bold are signifi-
cant at the 5% level.
1997 1998 1999
1998 0.19
1999 0.14 0.36
2000 0.099 0.37 0.58
372 C. Scotti-Saintagne et al.
0
5
10
15
20
25
30
35
40
45
50 cM
ss rQrZAG74
E-AAG/M-CAC-314/ 1
R14- 500/3
E-AAC-/M-CCT-311/ 5
Cu tt-98
LG1M
E-AAC/M-CAT-61/5
P-CAG/M-GCA-38
ss rQrZAG102
E-AAC/M-CCT-140 /5
E-AAG/M-CAC-347/ 1
Cutt-98
LG3M
E-AAC/M-CAA-49/3
E-AAG/M-CTA-528
E-AAC/M-CTT-142/5
MSQ13
srQpZAG64
Cutt-00
Cutt-99
LG6M
N13-450/3
P14- 1200/ 3
ss rQpZAG1/5
E-AAC/M-CAC-137/5
P-CAG/M-GGA-196
ss rQpZAG9
Cutt-98
LG7F
E-AAC/M-CAA-66/ 2
E-AAG/M-CAC-174/4*
E-AAG/M-CTT-412/ 5
E-AAG/M-CTT-46/4
ss rQrZAG5a
E-AAG/M-CTT-195/ 4
ss rQpZAG110
Cutt-00
Cu tt-99
LG8M
E-AAG/M-CTT-306/ 5*
P-CCA/M-ATA-335/ 4
E-AAG/M-CAC-170/ 2
E-AAG/M-CTA-38 5
E-AAC/M-CTT-315/ 5
Cu tt-00
Cutt-99
Cu tt-98
LG12M
0
5
10
15
20
25
30
35
40
45
50 cM
0
5
10
15
20
25
30
35
40
45
50 cM
ss rQrZAG74
E-AAG/M-CAC-314/ 1
R14- 500/3
E-AAC-/M-CCT-311/ 5
Cu tt-98
LG1M
ss rQrZAG74
E-AAG/M-CAC-314/ 1
R14- 500/3
E-AAC-/M-CCT-311/ 5
Cu tt-98
LG1M
E-AAC/M-CAT-61/5
P-CAG/M-GCA-38
ss rQrZAG102
E-AAC/M-CCT-140 /5
E-AAG/M-CAC-347/ 1
Cutt-98
LG3M
E-AAC/M-CAT-61/5
P-CAG/M-GCA-38
ss rQrZAG102
E-AAC/M-CCT-140 /5
E-AAG/M-CAC-347/ 1
Cutt-98
LG3M
E-AAC/M-CAA-49/3
E-AAG/M-CTA-528
E-AAC/M-CTT-142/5
MSQ13
srQpZAG64
Cutt-00
Cutt-99
LG6M
E-AAC/M-CAA-49/3
E-AAG/M-CTA-528
E-AAC/M-CTT-142/5
MSQ13
srQpZAG64
Cutt-00
Cutt-99
LG6M
N13-450/3
P14- 1200/ 3
ss rQpZAG1/5
E-AAC/M-CAC-137/5
P-CAG/M-GGA-196
ss rQpZAG9
Cutt-98
LG7F
N13-450/3
P14- 1200/ 3
ss rQpZAG1/5
E-AAC/M-CAC-137/5
P-CAG/M-GGA-196
ss rQpZAG9
Cutt-98
LG7F
E-AAC/M-CAA-66/ 2
E-AAG/M-CAC-174/4*
E-AAG/M-CTT-412/ 5
E-AAG/M-CTT-46/4
ss rQrZAG5a
E-AAG/M-CTT-195/ 4
ss rQpZAG110
Cutt-00
Cu tt-99
LG8M
E-AAC/M-CAA-66/ 2
E-AAG/M-CAC-174/4*
E-AAG/M-CTT-412/ 5
E-AAG/M-CTT-46/4
ss rQrZAG5a
E-AAG/M-CTT-195/ 4
ss rQpZAG110
Cutt-00
Cu tt-99
LG8M
E-AAG/M-CTT-306/ 5*
P-CCA/M-ATA-335/ 4
E-AAG/M-CAC-170/ 2
E-AAG/M-CTA-38 5
E-AAC/M-CTT-315/ 5
Cu tt-00
Cutt-99
Cu tt-98
LG12M
E-AAG/M-CTT-306/ 5*
P-CCA/M-ATA-335/ 4
E-AAG/M-CAC-170/ 2
E-AAG/M-CTA-38 5
E-AAC/M-CTT-315/ 5
Cu tt-00
Cutt-99
Cu tt-98
E-AAG/M-CTT-306/ 5*
P-CCA/M-ATA-335/ 4
E-AAG/M-CAC-170/ 2
E-AAG/M-CTA-38 5
E-AAC/M-CTT-315/ 5
Cu tt-00
Cutt-99
Cu tt-98
LG12M
Figure 2. Location of significant QTLs for ability to vegetative propagation (Cutt). Each QTL is delineated by the position of the highest LOD score and the bootstrap mean
value of the highest LOD score. The confidence interval of its position is based on 1000 bootstrap samples and indicated as a line.
Genetics of rooting ability in oak 373
one strong QTL was detected on linkage group 6 of the map
described by Plomion et al. [25, 26], explaining a high percen-
tage (18.7%) of the phenotypic variance.
3.3. Molecular basis of adventitious root formation
Adventitious root formation is an essential step in the veg-
etative propagation of plants. It is a complex process, which is
affected by multiple factors including levels of growth regula-
tors [23] and of phenolic compounds [12], nutritional status,
associated stress responses such as wounding, and genetic char-
acteristics. In oak the ability for vegetative propagation was
found to be controlled by at least 6 unique QTLs, collectively
explaining 53.9% of the phenotypic variation; two individual
QTLs explaining more than 10% of the phenotypic variance
were found over consecutive years. This result agrees with
results obtained in forest tree species so far, and support the oli-
gogenic nature of adventitious rooting, where few QTLs con-
trol a major part of phenotypic variance. The mechanisms by
which adventitious roots are formed are not known in trees but
recent results obtained in the model plant species Arabidopsis
thaliana have started to shed light on the underlying molecular
mechanisms. In particular, three mutants have been identified,
that are altered in their aptitude to form adventitious roots. Two
mutants correspond to auxin over-producers [2, 13] sur1 and
sur2. In particular sur1 behaves like a “hairy root” induced by
Agrobacterium rhizogenes, as it spontaneously produces
adventitious roots from different organs. A third mutant “argo-
naute” (ago1) [3], is unable to develop adventitious roots from
the hypocotyl or other aerial organs in response to auxin, whe-
reas roots respond normally.
These genes are already mapped in the genome of Arabi-
dopsis; their sequences may represent the basis for a “candidate
gene” approach in pine and oak, and lead to the identification
of the genes involved in the control of rooting ability in trees;
mapping of these genes will possibly help to unveil the role and
molecular function of the detected QTLs.
REFERENCES
[1] Beavis W.D., The power and deceit of QTL experiments: lessons
from comparative studies, in: Proceedings of the 49th annual corn
and sorghum industry research conference, Chicago, IL, 1995,
pp. 250–266.
[2] Boerjan W., Cervera M.T., Delarue M., Beekman T., Dewitte W.,
Bellini C., Caboche M., Van Onckelen H., Van Montagu M., Inzé
D., SUPER ROOT, a recessive mutation in Arabidopsis, confers
auxin overproduction, Plant Cell 7 (1995) 1405–1419.
[3] Bohmert K., Camus I., Bellini C., Bouchez D., Caboche M., Benning
C., AGO1 defines a novel locus of Arabidopsis controlling leaf
development, EMBO J. 17 (1998) 170–180.
[4] Borralho N.M.G., Wilson P.J., Inheritance of initial survival and
rooting ability in Eucalyptus globulus Labill. stem cuttings, Silvae
Genet. 43 (1994) 238–242.
[5] Box G.E.P., Cox D.R., An analysis of transformation, J. Amer. Stat.
Assoc. 39 (1964) 357–365.
[6] Bradshaw H.D., Foster G.S., Marker-aided selection and propaga-
tion systems in trees: advantages of cloning for studying quantita-
tive inheritance, Can. J. For. Res. 22 (1992) 1044–1049.
[7] Brendel O., Pot D., Plomion C., Rozenberg P., Guehl J.M., Genetic
parameters an QTL analysis of d13C and ring width in maritime
pine, Plant Cell. Environ. 25 (2002) 945–953.
[8] Britvin E., Minkov D., Glikson L., Ronin Y., Korol A., MultiQtl,
an interactive package for genetic mapping of correlated quantita-
tive trait complexes in multiple environments, version 2.0 (Demo).
Plant & Animal Genome IX, San Diego, CA, Abstract
C01_01.html, 2001.
[9] Broman K.W., Review of statistical methods for QTL mapping in
experiment crosses, Lab. Animal 30 (2001) 44–52.
[10] Cervera M.T., Plomion C., Malpica C., Molecular markers and
genome mapping in woody plants, in: Jain S.M., Minocha S.C.
(Eds.), Molecular Biology of Woody Plants, Kluwer Academic
Publishers, The Netherlands, Forestry Sciences, Vol. 64, 1999,
pp. 375–394.
[11] Churchill G.A., Doerge R.W., Empirical threshold values for quan-
titative trait mapping, Genetics 138 (1994) 963–971.
[12] Curir P., Van Sumere C.F., Termini A., Barche P., Marchesini A.,
Dolci M., Flavonoid accumulation is correlated with adventitious
Table III. QTL detection parameters. LG, linkage group (m = male, f = female); N, number of individuals genotyped for the flanking markers;
Lod, highest LOD in the interval; α
chr
, type I error at the chromosome level obtained from 1000 permutations tests; α
gen
, type I error at the
genome level; PEV, percentage of phenotypic variance explained by the QTL; P1, position (in cM) relative to the top of the LG of the highest
LOD score from the Composite Interval Mapping; P2, position of the mean value for maximum LOD score after bootstrap analysis
(1000 bootstrap samples); CI, QTL confidence interval (95%) based on the 1000 bootstrap samples.
Trait LG N Lod α
chr
α
gen
PEV P
1
P
2
CI
Cutt-98 7f 138 3.0 0.002 5 10.6 87.6 84.9 24.1
Cutt-98 1m 148 2.7 0.002 5 6.4 61.6 58.6 15.4
Cutt-98 3m 213 2.7 0.002 5 4.3 22.1 23.8 16.8
Cutt-98 12m 196 4.1 0.001 5 9.9 55.6 54.9 15.9
Cutt-99 6m 199 5.0 0.001 5 8.9 14.8 18.0 20.0
Cutt-99 8m 179 4.8 0.001 5 10.7 17.3 16.7 18.4
Cutt-99 12m 175 3.0 0.002 5 5.5 38.1 41.6 24.7
Cutt-00 6m 185 3.2 0.001 5 6.6 9.8 21.5 32.9
Cutt-00 8m 173 6.2 0.001 5 13.8 3.3 12.2 25.3
Cutt-00 12m 196 5.0 0.001 5 8.8 65.3 59.8 22.7
374 C. Scotti-Saintagne et al.
root formation in Eucalyptus dunnii Hook micropagation through
axillary bud stimulation, Plant Physiol. 92 (1990) 1148–1153.
[13] Delarue M., Prinsen E., Van Onckelen H., Caboche M., Bellini C.,
Sur2 mutations of Arabidopsis thaliana define a new locus invol-
ved in the control of auxin homeostasis, Plant J. 14 (1998) 603–611.
[14] Falconer D.S., Mackay T.F.C., Introduction to Quantitative gene-
tics, 4th ed., Longman Scientific & Technical, New York, 1996.
[15] Frewen B.E., Chen T., Howe G.T., Davis J., Rohde A., Boerjan W.,
Bradshaw H.D., Quantitative trait loci and candidate gene mapping
of bud set and bud flush in Populus, Genetics 154 (2000) 837–845.
[16] Geldermann H., Investigations on inheritance of quantitative char-
acters in animals by gene markers. I. Methods, Theor. Appl. Genet.
46 (1975) 319–330.
[17] Grattapaglia D., Sederoff R., Genetic linkage maps of Eucalyptus
grandis and E. urophylla using a pseudo-testcross mapping strategy
and RAPD markers, Genetics 137 (1994) 1121–1137.
[18] Grattapaglia D., Bertolucci F.L., Sederoff R.R., Genetic mapping
of quantitative trait loci (QTLs) controlling vegetative propagation
in Eucalyptus grandis and E. urophylla, using the pseudo-testcross
mapping strategy and RAPD markers, Theor. Appl. Genet. 90
(1995) 933–947.
[19] Han K.H., Bradshaw H.D., Gordon M.P., Adventitious root and
shoot regeneration in vitro is under major gene control in an F
2
family of hybrid poplar (Populus trichocarpa × P. deltoides), For.
Genet. 1 (1994) 139–146.
[20] Hartmann H.T., Kester D.E., Davis F.T., Plant propagation: princi-
ples and practices, Prentice Hall, Englewood Cliffs, N.J, 1990.
[21] Jansen R.C., Stam P., High resolution of quantitative traits into
multiple loci via interval mapping, Genetics 136 (1994) 1447–
1455.
[22] Lin Y.R., Shertz K.F., Paterson A.H., Comparative analysis of
QTLs affecting plant height and maturity across the Poaceae, in
reference to an interspecific Sorghum population, Genetics 141
(1995) 391–411.
[23] Liu B.H., Reid D.M., Auxin and ethylene-stimulated adventitious
rooting in relation to tissue sensibility to auxin and ethylene produc-
tion in sunflower hypocotyls, J. Exp. Bot. 43 (1992) 1191–1198.
[24] Marques C.M., Vasquez K.J., Carocha V.J., Ferreira J.G., O’Malley
D.M., Liu B.H, Sederoff R.R., Genetic dissection of vegetative
propagation traits in Eucalyptus tereticornis and E. globules,
Theor. Appl. Genet. 99 (1999) 936–946.
[25] Plomion C., Durel C.E., O’Malley D., Genetic dissection of height
in maritime pine seedlings raised under accelerated growth condi-
tions, Theor. Appl. Genet. 93 (1996) 849–858.
[26] Plomion C., Bahrman N., Durel C.E., O’Malley D.M., Genomic
analysis in Pinus pinaster (maritime pine) using RAPD and protein
markers, Heredity 74 (1995) 661–668.
[27] Saintagne C., Bodénès C., Barreneche T., Pot D., Plomion C., Kremer
A., Distribution of genomic regions differentiating oak species
assessed by QTL detection, Heredity 92 (2004) 20–30.
[28] Sewell M.M., Neale D.B., Mapping quantitative traits in forest
trees, in: Jain S.M., Minocha S.C. (Eds.), Molecular Biology of
Woody Plants, Kluwer Academic Publishers, The Netherlands,
Forestry Sciences, Vol. 64, 1999, pp. 407–423
[29] Tsarouhas V., Gullberg U., Lagercrantz U., An AFLP and RFLP
linkage map and quantitative trait locus (QTL) analysis of growth
traits in Salix, Theor. Appl. Genet. 105 (2002) 277–288.
[30] Voorrips R.E., MapChart version 2.0: Windows software for the
graphical presentation of linkage maps and QTLs, Plant Research
International, Wageningen, The Netherlands, 2001.
[31] Zeng Z.B., Precise mapping of quantitative trait loci, Genetics 136
(1994) 1457–1468.
To access this journal online:
www.edpsciences.org