Báo cáo lâm nghiệp: "Carbon stock changes in a peaty gley soil profile after afforestation with Sitka spruce (Picea sitchensis)" potx
Bạn đang xem bản rút gọn của tài liệu. Xem và tải ngay bản đầy đủ của tài liệu tại đây (408.58 KB, 8 trang )
873
Ann. For. Sci. 62 (2005) 873–880
© INRA, EDP Sciences, 2005
DOI: 10.1051/forest:2005078
Original article
Carbon stock changes in a peaty gley soil profile
after afforestation with Sitka spruce (Picea sitchensis)
Argyro ZERVA, Maurizio MENCUCCINI*
School of GeoSciences (IERM), Edinburgh University, Darwin Building, Mayfield Rd, Edinburgh EH9 3JU, United Kingdom
(Received 13 April 2004; accepted 16 February 2005)
Abstract – We investigated the changes of carbon (C
org
) stocks in the litter (O
L
), organic (O
H
) and mineral (A) layer after afforestation and at
different stages after clearfelling of the first rotation, in a forest chronosequence of Sitka spruce (Picea sitchensis) on peaty gley soil, in
Harwood Forest (N.E. England). The sites chosen were: unplanted natural grassland, 40-yr-old first rotation, 18 months-old clearfelled, and 12,
20 and a 30 yr-old second rotation. A further comparison was carried out in three 40-yr-old stands between unplanted stripes of land (rides) and
adjacent forest. Measurements of soil C
org
were conducted with two methods, i.e., weight loss on ignition (L.O.I.) and dry combustion by C/N
analysis. The results from two methods were linearly related. Afforestation changed both the total amounts and the distribution of the C
org
stocks from the unplanted natural grassland. The total stocks of C
org
decreased during first rotation and increased during second rotation to
values similar to those found in the unplanted grassland. The vertical distribution of C
org
also changed, with proportionally more carbon stored
in the O
L
and inside the A layer and less in the organic layer after afforestation and two rotations.
soil carbon stocks / bulk density / C concentration / Sitka spruce / forest management / peaty gley soil
Résumé – Changement des stocks de carbone dans le profil des sols tourbeux à gley après boisement avec l’épicéa de Sitka (Picea
sitchensis (Bong.) Carr). Les variations de stocks de carbone (C
org
) dans la litière (O
L
), dans l’horizon organique (O
H
) et l’horizon minéral (A)
ont été étudiées après boisement et à différents stades après coupe rase de la première rotation, dans une chronoséquence forestière de l’Epicéa
de Sitka (Picea sitchensis) sur des sols tourbeux à gley en Forêt d’Hardwood (N.E. Angleterre). Les sites choisis étaient les suivants : prairie
naturelle, première rotation âgée de 40 ans, coupe rase depuis 18 mois, et 12, 20 et 30 ans de deuxième rotation. Une comparaison
supplémentaire a été faite dans trois peuplements âgés de 40 ans entre des bandes de terre non plantées et dans une forêt adjacente. Les mesures
de C
org
ont été menées en utilisant deux méthodes : pertes de poids par ignition (L.O.I.) et combustion sèche par analyse du C/N. Les résultats
des deux méthodes étaient linéairement liés. Le boisement change à la fois l’importance et la distribution des stocks de C
org
des prairies
naturelles. Les stocks totaux de C
org
décroissent pendant la première rotation et s’accroissent pendant la seconde rotation vers des valeurs
similaires à celles trouvées dans les prairies non plantées. La distribution verticale de C
org
change aussi avec proportionnellement plus de
carbone stocké dans la litière (OL) et dans l’horizon A et moins dans l’horizon organique après le boisement et deux rotations.
stocks de carbone dans le sol / densité volumique / concentration en C / épicéa de Sitka / aménagement forestier / sol tourbeux à gley
1. INTRODUCTION
Soils constitute a significant reservoir of carbon (C) in both
organic and mineral forms and can play an important global
role, by mitigating or contributing carbon to the atmosphere.
Globally, soils contain more than two thirds of the total C stored
in vegetation [9, 22] and almost twice the amount in the atmos-
phere [22], while forest soils (including peaty soils) contain
approximately 69% of the total forest C pool [4]. The soil C in
temperate forests is estimated to vary from 104 to 142 Pg [22,
30], while in Europe approximately 35% of the total C in the
soils is held within high organic matter soils (≥ 8% organic mat-
ter) [24].
The amount of C stored in the soil is the balance between
inputs of organic material from the biota, which depends on the
type of vegetation and its productivity at a particular site, and
losses, primarily through soil microbial respiration [18]. Forests
continuously recycle C through photosynthesis and respiration;
however, the net sequestration of C in vegetation and especially
in soil can range over time periods from years to centuries,
depending on the species, site conditions, disturbances regime
and management practices [4].
Currently, forest plantations globally occupy an area of
187 × 10
6
ha; however, they account for less than 5% of the glo-
bal forest cover [5]. Recent trends towards harvesting younger
stands raise concerns about how such forest management will
impact on soil processes and global carbon sequestration [15].
Forest plantations are often planted in areas that did not have
forest cover before (at least in temperate regions), such as grass-
lands or abandoned agricultural land. At establishment, site
* Corresponding author:
Article published by EDP Sciences and available at or />874 A. Zerva, M. Mencuccini
preparation may involve disturbing the soil, e.g. by the creation
of drainage ditches or ploughing. These practices may accel-
erate organic matter decomposition by disturbing soil structure
and breaking soil aggregates, leading to a loss of soil C [14, 31].
Substantial losses of C from vegetation and soils can also be
caused by harvesting [10]. Soil carbon storage is likely to ini-
tially decline after clear cutting, because C inputs from plant
production are too low to counteract losses by soil respiration.
Furthermore, intensive forest management may also lead to
long-term decreases in soil organic matter content [9]. On the
other hand, regenerating forests and plantations may represent
important carbon sinks as a result of carbon storage in both
plant biomass and soils [12]. Carbon accumulation rates during
afforestation depend on tree species, soil type and the length
of the rotation [29].
In Britain, about 315 000 ha of shallow peatlands (mainly
peaty gleys) have been planted with coniferous forests, mostly
Sitka spruce (Picea sitchensis (Bong.) Carr) [3]. Afforestation
on peaty soils may cause an increase in the rates of oxidation
of the peat due to improved aeration by the drainage and the
lowered water table under a maturing tree stand [16]. Growing
trees can sequester carbon in the aboveground biomass as well
as in the litter layer and soil; however, whether or not affores-
tation will give a net benefit of C sequestration depends on the
rate of peat oxidation.
Two commonly used methods for measuring soil C are: (a) the
weight by loss on ignition (L.O.I.) which measures organic
C(C
org
) content by measuring mass loss following high tem-
perature combustion at approximately 500 °C and (b) dry com-
bustion by C/N analysers where samples are oxidised at high
temperature (approximately 1 000 °C) and then the CO
2
gas
evolved is measured by infrared gas absorption analysis
(IRGA) or gas chromatography (GC). The use of C/N analysers
is expensive and the high temperature oxidation also liberates
C from carbonate minerals, thus a separate analysis for the sep-
aration of carbonate-C (C
min
) is sometimes required. The igni-
tion temperature used for L.O.I. is below that at which C
min
decomposes [11] and the use of L.O.I. has been suggested, as
long as it is checked against a dry-combustion method [25].
Soil carbon storage is an important factor for ecosystem sta-
bility in the long-term, but small changes in a large pool are dif-
ficult to detect, although even small changes in the soil carbon
pool can result in relatively large changes in fluxes of CO
2
to
the atmosphere. The vital role of soils as a sink or source for C
at the global scale in offsetting atmospheric CO
2
concentrations
[13] makes it important to accurately evaluate the effects of for-
est management on soil C storage.
The objective of the study was to examine the effects of
afforestation on peaty gley soils with Sitka spruce and forest
management on soil C stocks within the soil profile. The overall
aim was to gain some insight into the long-term effects of affor-
estation, forest harvesting and reforestation on soil C stocks.
2. MATERIALS AND METHODS
2.1. Site description
Measurements were made in various stands within Harwood forest
(55° 10’ N, 2° 3’ W), in Northamberland, England. Harwood forest
mostly consists of even aged stands of pure Sitka spruce (Picea sitch-
ensis (Bong.) Carr.). The area rises from 200 m in the South-East to 400 m
in the North-West. Average annual precipitation is 950 mm, mean
annual temperature is 7.6 °C. The dominant soil type is peaty gley, i.e.,
a seasonally waterlogged soil with a superficial organic-rich layer [19].
The establishment of the forest started in the 1930s with the plant-
ing of ericaceous moorland. The trees were planted on top of small
ridges following ploughing, i.e., a process that resulted in a peculiar
structure of the soil profile. In the furrows the organic horizon is often
absent. On the ridges there is often an inversion of the usual horizon
arrangement (O
L
, O
H
, A), with the A horizon above the O
H
, and the
O
L
horizon in deeper layers.
The forest is managed with rotations of about 40 years. At this age
a whole stand is clearfelled and the planting of trees takes place after
two or three years. Tree harvesting is conducted by mechanical har-
vesters with a mechanically operated harvesting head that fells a tree,
de-limbs it, and transfers the logs to a special extended rear frame and
carries them out of the forest. The slash is left on site to create the bed
over which the harvester moves. Subsequently, the brash is accumu-
lated into large heaps to make room for planting. Based on visual
observations, these processes created a surface layer of mixed organic
material, logging slash, twigs and roots.
2.2. Soil sampling
The detailed methodology for soil C sampling and analysis is
described in [31] and will only be outlined here. Soil sampling took
place during the summers of 2000 and 2001. The research was under-
taken in stands of different ages to represent the continuum of stand
development since initial afforestation, an area where a mature stand
had been clearfelled, and areas under natural moorland that were rep-
resentative of the land cover prior to forest establishment. All stands
were on peaty gley soils. The following stands were sampled: three
first-rotation 40-yr-old, three 30-yr-old, three 20-yr-old, and four
12-yr-old stands, all of which during second rotation. Two unplanted
(grassland) areas were also used, together with a single clearfelled area
(CF), for which no comparable replicate was available. The two
unplanted grassland sites were chosen inside the forest in areas left
unplanted for conservation reasons, but still on the same soil type.
For each stand, we sampled between 1 and 5 plots, with between
8 and 9 soil cores taken from each plot. In the summer 2000, five plots
were sampled from each stand, to determine the within- as well as the
among-plot variability. In 2001, given that most of the variability was
within, not among, plots, number of plots/stand was reduced to one.
Soil samples were taken using a manually driven soil corer with a slide
hammer attachment (Giddings Machine Company, Inc., USA) (5.5 cm
diameter) or a soil auger (2.5 cm diameter), to a depth of about 45 cm.
Tests were also carried out to compare the estimates obtained with the
auger with those obtained with the corer. Twenty-eight individual
cores were taken adjacent to one another with both corers in several
different plots. The cores were separated into three layers (see below)
and a t-test conducted to test whether significant differences existed
in the estimation of soil C stocks by the two instruments. The values
given by the two methods were not significantly different (P > 0.05)
and the data were pooled.
An additional study was conducted in three 40-yr-old stands to
compare soil C stocks inside the forest with soil C stocks in the
unplanted rides in between forest stands. Rides are unplanted stripes
of land (8 to 10 m wide) that separate blocks of forest 200 m wide. In
a ride, litterfall is largely reduced, but depth of the water table may be
as low as inside a block of forest, as two ditches border the ride on
both sides. In three separate areas, we selected three paired plots (one
in a ride, and one alongside in the forest) located as close to each other
as possible and nine samples were taken for each plot.
All samples were transferred to the lab, where the depth of the total
core was measured and then separated into three layers: the litter layer
(O
L
), organic layer (O
H
) and mineral layer (A). In the case of forest
Soil carbon changes after afforestation 875
stands and the clearfelled site, the O
F
layer was included with the O
H
layer. In the unplanted grassland the O
L
layer was considered as the
layer consisting of dead plant material and the layer of partly decom-
posed material (i.e., mostly O
F
).
The samples were kept in polythene bags in a freezer (–4 °C) till
further analyses. The samples were then oven-dried at 105 °C for 24 h
to constant weight [1]. Stone content was negligible. Any stones
present and coarse fragments were removed by hand and the soil was
ground to pass a 0.5 mm mesh [25].
2.3. Determination of C concentration
Thirty per cent of all samples from all layers were analysed both
in a C/N analyser (Carlo-Erba, NA 2500) and by loss on ignition
(L.O.I.). Finely ground sub-samples of about 4 mg for the litter and
the organic layer and 10 mg for the mineral layer were combusted in
the C/N analyser, and their C concentration (g kg
–1
) was determined.
Total C was assumed to equal organic C, as the samples did not come
from a calcareous soil. Other sub-samples of approximately 1 g [1]
were weighed and then ignited in a furnace at 500 °C, for 5 h (L.O.I.).
After burning the samples were weighed again and the percentage
mass loss (L%) was calculated, to determine the relationship between
C and L%.
2.4. Soil bulk density
Soil bulk density was calculated for the samples from the 2001
study only, because no layer depths had been measured during the
2000 study. Bulk density was calculated with the following formula:
P
b
= M/V (1)
where P
b
is the bulk density (g cm
–3
), M is the dry mass of a given
soil sample (g) and V its fresh volume (cm
3
). Only few small stones
were found in the cores.
2.5. Statistical analysis
The slopes of the regression equations for the relationship between
the C (g kg
–1
) obtained from C/N analyser and the % mass loss from
L.O.I. methods for each of three layers (O
L
, O
H
, A) was tested by
ANCOVA (Analysis of Covariance) in SPSS [26].
The data from both study years were first analysed separately to
determine whether significantly different patterns emerged as a result
of the different methodologies employed. Because the patterns were
similar, the data were combined and the mean was used as the soil C
stock for each site. Differences among age classes were tested using
one-way ANOVA (Analysis of Variance), using plot averages as the
unit for analysis. Because of the lack of site replication in the case of
the CF, the site was not included in the ANOVA analysis.
A Mann-Whitney test was employed for the comparison between
the 40-yr stands and the ride plots, as the ride values did not follow a
normal distribution. One-way ANOVA was performed using SAS
[20] and equations were fitted using Sigma Plot. All the probabilities
were tested at the 5% significance level.
3. RESULTS
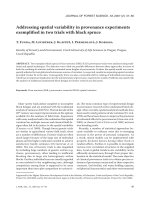
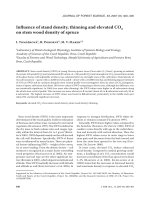
3.1. Equation for predicting soil C using the L.O.I.
method
When the mass loss (%) by L.O.I was plotted against the C
concentration (%) obtained by the C/N analyser, a significant
linear relationship was obtained (R
2
= 0.98, Fig. 1). ANCOVA
revealed significant differences in the slopes of the regression
equations among the 3 layers (P < 0.05). Thus, separate regres-
sion equations were fitted for each layer [31]:
C (g kg
–1
) = 0.513 L(%) – 0.092 , R
2
= 0.99 for O
L
(2)
C (g kg
–1
) = 0.542 L(%) + 0.184, R
2
= 0.99 for O
H
(3)
C (g kg
–1
) = 0.533 L(%) – 0.700, R
2
= 0.99 for A. (4)
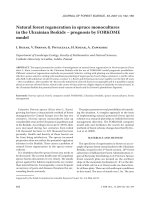
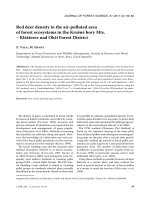
3.2. Soil C stocks in the litter, organic and mineral
layers along the chronosequence
Soil C
org
stocks in litter, organic and mineral layer down to
45 cm depth at each site are presented in Figure 2. The change
of total soil C stocks along the chronosequence can be found
in Zerva et al. [31]. C
org
in the O
L
layer in the UN site (also
inclusive of O
F
) was 18.2 ± 4.5 t C ha
–1
, i.e., significantly lower
than 29.5 ± 6.3 t C ha
–1
in the O
L
in the 40-yr stands in first
rotation (P < 0.05). The O
L
in the CF site contained 7.4 ± 1.8 t
C ha
–1
, i.e., considerably less than the 40-yr stand, although this
could not be tested statistically because of lack of inter-stand
replication (the standard error given above refers to intra-stand
variability). In second-rotation stands, C
org
in the O
L
signifi-
cantly increased from 16.4 ± 0.8 t C ha
–1
in the 12-yr stands to
20.4 ± 1.8 t C ha
–1
in the 20-yr stands and 27.7 ± 1.5 t C ha
–1
in the 30-yr stands (P < 0.05). The changes in C
org
in the O
L
were accompanied by changes in the thickness of the O
L
as well
(Tab. I). The depth of the litter layer in the UN site was similar
to the 40-yr stands. The O
L
layer in the single CF site was much
thinner than the 40-yr, while during the second rotation O
L
thickness significantly increased with age from the 12-yr to the
30-yr stands. The thickness data refer to the 2001 sampling
only.
C
org
in the O
H
layer in the UN site was 243.2 ± 60.3 t C ha
–1
,
i.e., significantly higher than the 65.8 ± 9.3 t C ha
–1
in the 40-yr
stands at the end of the first rotation (P < 0.001). The single CF
site had considerably lower C
org
than the 40-yr stands, although
again this could not be tested. Soil C started increasing again
as the stands grew in second rotation, from 108.6 ± 34.3 t C ha
–1
in the 12-yr stands to 115.1 ± 6.1 t C ha
–1
in the 20-yr stands
(although P > 0.05), but the increase became significant in the
30-yr stands, with values of 173.3 ± 26.3 t C ha
–1
(P < 0.05).
The thickness of the O
H
was reduced after the planting of trees
(compare UN with the 40-yr stands), despite O
F
being bulked
with O
L
for UN and with O
H
for 40-yr. The 12-yr and 20-yr
stands were not significantly different for the thickness of their
O
H
, although the 30-yr stands had significantly deeper O
H
than
the 12-yr stands.
The UN site contained 20.3 ± 1.1 t C ha
–1
in the A layer,
while significantly higher amounts were found in the same
layer of the 40-yr stands (44.8 ± 8.1 t C ha
–1
, P < 0.0001). The
A layer in the single CF site contained 64.4 ± 15 t C ha
–1
. In
the 12-yr in second rotation, soil C
org
in the A layer was 22 ±
15.5 t C ha
–1
, in the 20-yr stands in 45.3 ± 16.9 t C ha
–1
and
48.4 ± 11.9 t C ha
–1
in the 30-yr stands, i.e., the values showed
an increasing trend, although the differences were not signifi-
cant (P >0.05).
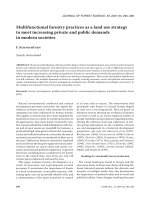
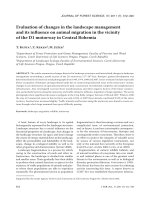
The average total soil C
org
stocks in the rides next to 40-yr
stands were 129.7 ± 14 t C ha
–1
, while the average for the
876 A. Zerva, M. Mencuccini
40-yr forest plots was 127.0 ± 17 t C ha
–1
. Figure 3 shows the
three pairs of study plots in rides and adjacent 40-yr stands.
Although no significant difference (P > 0.05) was found for
total C
org
between rides and 40-yr stands, there were different
patterns in the vertical distribution of C. The C in the litter layer
of the 40-yr stand was significantly higher than the C contained
in the litter layer of the ride (19.6 ± 3.6 and 6.7 ±1.1 t C ha
–1
respectively, P < 0.001), while soil C stocks in the organic layer
of the 40-yr stands were lower but not significantly different
(73.4 ± 5.8 vs. 92.1 ± 10.8 t C ha
–1
, in the 40-yr stands and rides
respectively, P > 0.05). No significant differences were
observed for the mineral layer (38 ± 3.3 and 31.8 ± 6.0 t C ha
–1
,
respectively, P > 0.05).
Bulk densities and C concentration for each soil layer are
shown in Table I for the 2001 samples. Bulk density in the O
L
had varied between 0.1 and 0.2 g cm
–3
at all sites, whereas the
bulk density in the O
H
ranged between 0.34 and 0.86 g cm
–3
.
Afforestation increased bulk density in the O
H
from UN to
40-yr stands. For the stands growing in second rotation, bulk
density in the O
H
decreased from the 12-yr stand to the 30-yr
stand (P < 0.05). The bulk density in the mineral layer was very
similar at all sites, with values ranging between 1.30 and
1.52 g cm
–3
.
C concentration in the O
L
did not significantly vary across
the chronosequence and ranged between 339 and 453 g kg
–1
,
increasing slightly in the second-rotation stands. UN had a high
C concentration in the O
H
, while afforestation resulted in a sig-
nificantly lower C concentration in the first-rotation 40-yr
stands (P < 0.001). C concentration increased significantly
with stand age in the second rotation (P < 0.001). The C con-
centration in the mineral layer ranged from 18 to 29 g kg
–1
and
there were no significant differences between sites (P >0.05).
Figure 1. Linear regressions between mass loss L (%) from L.O.I and C (g kg
–1
) by C/N analyser for 230 samples from O
L
, O
H
and A layers
and from different sites within Harwood forest.
Figure 2. Soil C stocks (t ha
–1
)
along the Sitka spruce chronosequence
in O
L
, O
H
and A layers. The vertical bars indicate the standard error
of the mean across stands, except for CF where they indicate the stan-
dard error of the mean across plots.
Soil carbon changes after afforestation 877
4. DISCUSSION
4.1. Equation for predicting soil C using the L.O.I.
method
The strong linear relationships between the mass loss
obtained by L.O.I. and the C (%) by C/N analyser for the three
layers, O
L
, O
H
and A, indicates that L.O.I can be used as a pre-
cise method for estimating organic C from peaty gley soils, with
the significant advantage of the low cost of the method. We
found significantly different slopes for each layer, probably
because of the different amounts of organic matter present in
each layer, with the litter and organic layers containing more
C per unit of mass loss than the mineral layer. Additionally, clay
content and clay mineralogy have also been reported as signif-
icant factors in affecting these relationships. Konen et al. [17]
developed equations for predicting organic C content (as deter-
mined by C/N analyser) from L.O.I for 255 non-calcareous
samples from selected major land resource areas in the North
Central USA. They found significant differences in the slopes
of equations among each major land resource area. The strong
predictive equations found here indicate that L.O.I can be a pre-
cise method that can be used successfully to predict accurately
C (g kg
–1
) in peaty gley soils in the Harwood forest area. L.O.I.
may not be a true measure of organic matter, because at the temper-
ature of ashing some bound water is lost from the clay minerals.
This error is more serious in soils low in organic matter [1].
4.2. Soil C stocks in the litter, organic and mineral
layers
Afforestation on previous grasslands on peaty gley soil
caused changes in the C content in the O
L
, O
H
and A. Soil C
org
in the O
L
layer of UN was not significantly different from the
Table I. Bulk density (g cm
–3
), thickness (cm) and C
org
concentration (g kg
–1
) for each layer of the chronosequence. Numbers in brackets
indicate the standard error of the mean (across stands), except for CF, where it indicates the standard error of the mean (across plots); n. d.: not
determined. Different letters for each site indicate significant differences (at least P < 0.05): capital letters refer to O
L
, smaller letters to O
H
.
None of the differences among mineral layers were significant (P > 0.05).
Site Layer Bulk density
(g cm
–3
)
Thickness
(cm)
C concentration
(g k
–1
)
UN O
L
0.11 (0.01)
A
3.8 (0.9)
A
453 (12)
ns
O
H
0.55 (0.1)
a
20.3 (1.3)
A
399 (34)
A
A 1.42 (0.04)
ns
n. d. 16 (5)
A
40-yr O
L
0.15 (0.02)
A
4.6 (0.5)
A
339 (32)
ns
O
H
0.86 (0.2)
b
12.8 (0.7)
C
155 (29)
B
A 1.52 (0.03)
ns
n. d. 17 (4)
A
Rides O
L
0.18 (0.03) 1.8 (0.3) 311 (76)
O
H
0.75 (0.05) 16.1 (0.8) 98 (17)
A 1.48 (0.04) n. d. 18 (4.4)
CF O
L
0.14 (0.03) 2.7 (0.4) 337 (08)
O
H
0.49 (0.04) 6.3 (1.4) 138 (21)
A 1.35 (0.08) n. d. 25 (7)
12-yr O
L
0.16 (0.01)
B
3.6 (0.2)
A
339 (38)
ns
O
H
0.62 (0.06)
a
16.9 (1.8)
B
152 (51)
B
A 1.39 (0.05)
ns
n. d. 18 (0.4)
A
20-yr O
L
0.14 (0.02)
A
4.7 (0.6)
A
368 (14)
ns
O
H
0.40 (0.04)
c
16.4 (1.8)
BC
306 (19)
A
A 1.36 (0.05)
ns
n. d. 17 (0.2)
A
30-yr O
L
0.11 (0.01)
A
7.0 (0.3)
B
402 (35)
ns
O
H
0.34 (0.03)
c
20.9 (1.4)
A
413 (13)
A
A 1.30 (0.04)
ns
n. d. 29 (2)
B
878 A. Zerva, M. Mencuccini
40-yr stands, but the C stock in the O
H
layer was considerably
higher in UN. This decrease could be due to the accelerated
decomposition caused by the site preparation for drainage and
for the planting of trees [3].
When soil C
org
in the 40-yr stands was compared with the
C stocks in adjacent unplanted rides, no significant difference
was found, though one may have expected that the ride would
resemble the unplanted grassland, since no site preparation or
tree planting took place there (although each 8-m ride is bor-
dered with one ditch on either side). The O
L
layer had signifi-
cantly less C content in the rides. The extra C
org
in the O
L
in
the forest is a characteristic feature of this system. The decrease
in C
org
in the O
H
layer in the forest was not significant at the
5% significance level, although the trend was in the same direc-
tion as for the comparison between the UN sites and the 40-yr
stands.
The considerably lower C
org
content in the O
L
layer of the
single CF compared to the 40-yr stands could be attributed to
the cessation of litter input from harvested trees. The O
H
layer
had also considerably lower C than the 40-yr stands, probably
as a result of increased losses through organic matter decom-
position, but the A layer had considerably higher amount of C.
That could be attributed to the re-distribution of organic mate-
rial after harvesting operation and the incorporation of slash in
the soil. Johnson et al. [14] investigated the effects of clearfell-
ing on soil carbon dynamics in a northern hardwood forest. A
decrease of 20 t C ha
–1
, eight years after logging, was estimated,
as well as a redistribution of carbon within the mineral soil, with
an increase in C in the A and E horizons. Gholz et al. [7] found
that the A horizon of a 2 yr-old stand of slash pine contained
approximately twice as much soil C as the other stands of the
chronosequence (up to the age of 34). This was attributed to
bedded slash. The effect of slash was short lived, so by the age
of 5 years, the soil C decreased to 50% of pre-harvest levels.
In the CF slash was left behind, however the extent to which
slash contributed C to the soil and prevented a greater loss of
C from the site is not known.
In second-rotation stands, the amount of C
org
in the O
L
, as
well as the thickness of O
L
and O
H
layers, increased as the
amount of litterfall increased [31]. A linear accumulation of
organic matter with stand age in the forest floor (O
L
and O
F+H
layers) was found in slash pine plantations in Florida [7].
In the 30-yr stands, the amount of C
org
in the O
L
was sig-
nificantly higher than in the grassland and the amount of C
org
in the O
H
layer was not significantly different than the one in UN.
Changes in the soil C
org
stocks across the chronosequence
were accompanied by changes in the concentration of C
org
in
the soil. C concentration in the litter layer was not significant
different across the chronosequence (P = 0.5). Schiffman et al.
[21] also found no significant differences in the C concentra-
tions with stand age in the O
L
layer in a chronosequence of
lobolly pine plantations, between 1 and 47 years old and estab-
lished on previous agricultural land or cleared land.
However, afforestation caused a significant decrease in C
concentration in the O
H
in the 40-yr stands at the end of the first
rotation compared to UN, while C concentration significantly
increased again with stand age during the second rotation. The
same pattern was observed in red pine plantations in Wisconsin
[30] where, soil organic matter concentration (%) increased lin-
early with stand age (13 to 48 years). However, [8] found no
significant differences in the C concentration down to a soil
depth of 10 cm in harvested stands of 5-yr, 15-yr, 40-yr old and
old-growth Douglas fir stands in Canada. Smethurst et al. [23]
Figure 3. Soil C (t ha
–1
) in litter, organic and mineral layers of three paired plots in 40-yr stands and rides. The vertical bars represent the
standard error of the mean.
Soil carbon changes after afforestation 879
observed that clearfelling decreased C concentration in the
0–15 cm depth from an initial value of 2.7% to 1.9%, 3 years
after replanting a Pinus radiata plantation, in South Australia.
C concentrations in the mineral layer were not significantly
different across the chronosequence in Harwood; however, the
C concentration in the mineral layer of the single CF site was
slightly higher, compared with the corresponding one of the
40-yr stands, indicating that mixing of the soil during/after
clearfelling may result in some transfer of organic material
deeper into the soil. Gholz et al. [7] also found no significant
differences (or trend) in the organic matter concentrations in the
mineral horizons of a slash pine chronosequence (stand ages
between 2 and 34 years old) in Florida.
Afforestation on natural grassland, clearfelling and replant-
ing also caused changes in the soil bulk densities, mainly in the
organic layer. Bulk densities in the litter layer of all sites ranged
between 0.1 and 0.2 g cm
–3
and increased with increasing depth.
Afforestation increased bulk density in the O
H
of the 40-yr
stand at the end of the first rotation (P < 0.001), which was
accompanied by a decrease in total soil C. Soil bulk density is
strongly inversely related to organic matter concentration [28]
and decreases in organic matter result in increases in bulk den-
sity. The O
L
in the 40-yr stand did not differ in bulk density
from the O
L
of the ride, but appeared to have higher bulk density
than the single CF, although the opposite would be expected.
Bock and Van Rees [2] studied the effects of clearfelling on soil
physical properties in white spruce forests in Canada. They
found that, three years after harvesting, soil bulk densities in
the LFH and the mineral layers were higher by 12 and 7%,
respectively compared with the bulk density in the respective
layers of an uncut stand. This was due to the accelerated decom-
position of organic matter. Johnson et al. [14] also found that
clearfelling of hardwood and spruce forests in USA caused an
increase of between 5 and 14% in bulk density in the top 20 cm
of mineral soil. The increase depended on the severity of the
disturbance. In our clearfelled site, the low bulk density was
either a result of lack of replication or represented a small effect
of the harvesting practices on soil compaction, or recovery
since clearfelling (which had taken place 18 months before).
Frazer et al. [6] also found similar bulk densities between clear-
felled and uncut mixed conifer stands (0.8 and 0.9 t m
–3
respec-
tively) in Sierra Nevada. They attributed it to cumulative action
of frost and incorporation of residues into the soil, which was
indicated by higher C concentration at the clearfelled site.
Soil bulk density in the organic layer decreased with stand
age during second rotation reflecting increases in the soil C.
Switzer et al. [27] also found that soil bulk density decreased
with stand age and organic matter concentration increased in
oak-hickory-pine forest growing on abandoned agricultural
land, in the South-eastern USA.
As mentioned before, bulk density increased with increasing
depth, and the mineral layers had the highest bulk densities.
These values were similar across stands indicating that the min-
eral layer was not directly affected by land use changes and
stand growth. Bulk density also reflects the distribution of
organic matter with depth as well as soil compaction [28]. Tam-
minen et al. [28] also found that soil bulk density increased with
depth and remained uniform at depths of more than 20 cm. Bock
and Van Rees [2] found no significant differences in soil bulk
densities of mineral layers between the clearfelled and uncut white
spruce stands in Canada. Gholz et al. [7] also observed no sig-
nificant differences in soil bulk densities in a slash pine chron-
osequence (stand ages between 2 and 34 years old) in Florida.
5. CONCLUSIONS
The establishment of Sitka spruce (Picea sitchensis) forests
on previous grasslands on peaty gley soils have changed soil
C
org
content, concentration and bulk density. During the first
rotation after afforestation C
org
in the O
H
layer declined and the
vertical distribution of the stocks changed, with more C
org
stored in the O
L
and A layers. Clearfelling seemed to cause a
further decline in C
org
in the O
L
and O
H
but increased C
org
in
the A layer. Because of lack of replication, this finding will need
to be confirmed. During second rotation, C
org
progressively
accumulated in O
L
and O
H
. It is estimated that by the age of
clearfelling of second rotation stands soil C
org
stocks will have
equalled those of the former unplanted grassland [31].
Acknowledgements: We wish to thank Henrike Gabler and Leonie
FitzGerald who helped collecting and analysing the soil samples, and
two anonymous referees for their helpful comments. Argyro Zerva
was partly supported from the Greek State Scholarship Foundation
(I.K.Y.). Additional resources were provided through EU CARBO-
AGE contract No EVK2-CT-1999-00045 and NERC grant No. GR9/
4806.
REFERENCES
[1] Allen S., Chemical Analysis of Ecological Materials, 2nd ed., Blac-
kwell Scientific Publications, Oxford, 1989.
[2] Bock M.D., Van Rees K.C.J., Forest harvesting impacts on soil pro-
perties and vegetation communities in the Northwest Territories,
Can. J. For. Res. 32 (2002) 713–724.
[3] Cannell M.G.R., Dewar R.C., Pyatt D.G., Conifer plantations on
drained peatlands in Britain: a net gain or loss of carbon? Forestry
66 (1993) 353–369.
[4] Dixon R.K., Brown S., Houghton R.A., Solomon A.M., Trexler
M.C., Wisniewsk J., Carbon pools and fluxes of global forest eco-
systems, Science 263 (1994) 185–190.
[5] FRA (Global Forest Resources Assessment), Food and Agriculture
Organisation of the United Nations, 2000.
[6] Frazer D.W., McColl J.G., Powers R.F., Soil nitrogen mineraliza-
tion in a clearcutting chronosequence in a northern California
forest, Soil Sci. Soc. Am. J. 54 (1990) 1145–1152.
[7] Gholz H.L., Fisher R.F., Organic matter production and distribution
in slash pine (Pinus elliottii) plantations, Ecology 63 (1982) 1827–
1839.
[8] Griffiths R.P., Swanson A.K., Forest soil characteristics in a chro-
nosequence of harvested Douglas-fir forests, Can. J. For. Res. 31
(2001) 1871–1879.
[9] Harmon M.E., Ferrell W.K., Franklin J.F., Effects on Carbon Sto-
rage of Conversion of Old-Growth Forests to Young Forests,
Science 247 (1990) 699–702.
[10] Houghton R.A., Revised estimates of the annual net flux of carbon
to the atmosphere from changes in land use and land management
1850–2000, Tellus B (55) (2003) 378–390.
[11] Howard P.J.A., The carbon-organic matter factor in various soil
types, Oikos 15 (1965) 229–236.
880 A. Zerva, M. Mencuccini
[12] IPPC, Land use, Land use change and Forestry, Special report of
the Intergovernmental Panel on Climate Change, Watson R.T.,
Noble I.R., Bolin B., Ravindranath N.H., Verando D.J., Dokken
D.J. (Eds.), Cambridge University Press, 2000.
[13] Johnson D.W., Curtis P.S., Effects of forest management on soil C
and N storage: meta analysis, For. Ecol. Manage. 140 (2001) 227–
238.
[14] Johnson C.E., Driscoll C.T., Faley T.J., Siccama T.G., Hughes
J.W., Carbon dynamics following clear–cutting of a northern hard-
wood forest, in: McFee W.W., Kelly M.J. (Eds.), Carbon Forms
and Functions in Forest Soils, Soil Sci. Soc. Am., Madison Wiscon-
sin, 1995, pp. 463–487.
[15] Keith H., Jacobsen K.L., Raison R.J., Effects of soil phosphorus
availability, temperature and moisture on soil respiration in Euca-
lyptus pauciflora forest, Plant Soil 190 (1997) 127–141.
[16] King J.A., Smith K.A., Pyatt D.G., Water and oxygen regimes
under conifer plantations and native vegetation on upland peaty
gley soil and deep peat soils, J. Soil Sci. 37 (1986) 485–497.
[17] Konen M.E., Jacobs P.M., Burras C.L., Talaga B.J., Mason J.A.,
Equations for predicting soil organic carbon using loss-on-ignition
for North Central USA soils, Soil Sci. Soc. Amer. J. 66 (2002)
1878–1881.
[18] Post W.M., Emanuel W.R., Zinke P.J., Stangenberger A.G., Soil
Carbon pools and world life zones, Nature 298 (1982) 156–159.
[19] Pyat D.G., Soil Classification, Forestry Commission research
Information Note 68/62/SSN, Forestry Commission, Edinburgh,
1982.
[20] SAS Institute, SAS/STAT User’s Guide Release 6.03 Edition,
SAS Institute, Cary, NC, USA, 1988.
[21] Schiffman P.M., Johnson W.C., Phytomass and detrital carbon sto-
rage during forest regrowth in the southeastern United States Pied-
mont, Can. J. For. Res. 19 (1989) 69–78.
[22] Schimel D., Terrestrial ecosystems and the carbon cycle, Glob.
Change Biol. 1 (1995) 77–99.
[23] Smethurst P.J., Nambiar E.K.S., Changes in soil carbon and nitro-
gen during the establishment of a second crop of Pinus radiata, For.
Ecol. Manage. 73 (1995) 145–155.
[24] Smith P., Powlson D.S., Glendining M., Smith J.U.O., Potential for
carbon sequestration in European soils: preliminary estimates for
five scenarios using results from long term experiments, Glob.
Change Biol. 3 (1997) 67–69.
[25] Sollins P., Glassman C., Paul A.E., Swanston C., Lajtha K., Heil
J.W., Elliott E.T., Soil Carbon and Nitrogen, Pools and Fractions,
in: Robertson G.P., Coleman D.C., Bledsoe C.S., Sollins P. (Eds.),
Standard Soil Methods for Long-Term Ecological Research,
Oxford University Press, 1999, pp. 89–114.
[26] SPSS Inc., SPSS for Windows, Professional statistics, Release 9.0,
1998.
[27] Switzer G.L., Shelton M.G., Nelson L.E., Successional develop-
ment of the forest floor and soil surface on upland sites of the East
Gulf Coastal Plain, Ecology 60 (1979) 1162–1171.
[28] Tamminen P., Starr M., Bulk density of forested mineral soils, Silva
Fenn. 28 (1994) 53–60.
[29] Thuille A., Buchmann N., Schulze E D., Carbon stocks and soil
respiration rates during deforestation, grassland use and subsequent
Norway spruce afforestation in the Southern Alps, Italy, Tree
Physiol. 20 (2000) 849–857.
[30] Wilde S.A., Changes in soil productivity induced by pine planta-
tions, Soil Sci. 97 (1964) 276–278.
[31] Zerva A., Ball T., Smith K.A., Mencuccini M., Soil carbon dyna-
mics in a Sitka spruce (Picea sitchensis (Bong.) Carr.) chronose-
quence on a peaty gley, For. Ecol. Manage. 205 (2005) 227–240.
To access this journal online:
www.edpsciences.org