Báo cáo lâm nghiệp: "Carbon pool and substitution effects of an increased use of wood in buildings in Switzerland: first estimates" pdf
Bạn đang xem bản rút gọn của tài liệu. Xem và tải ngay bản đầy đủ của tài liệu tại đây (1.19 MB, 14 trang )
889
Ann. For. Sci. 62 (2005) 889–902
© INRA, EDP Sciences, 2005
DOI: 10.1051/forest:2005080
Original article
Carbon pool and substitution effects of an increased use
of wood in buildings in Switzerland: first estimates
Frank WERNER
a
*, Ruedi TAVERNA
b
, Peter HOFER
b
, Klaus RICHTER
c
a
Environment and Development, Waffenplatzstrasse 89, 8002 Zurich, Switzerland
b
GEO Partner AG, Baumacherstrasse 24, 8050 Zurich, Switzerland
c
Swiss Federal Laboratories for Materials Testing and Research (Empa), Ueberlandstrasse 129, 8600 Duebendorf, Switzerland
(Received 13 April 2004; accepted 6 October 2005)
Abstract – Long-living wood products can contribute to the mitigation of climate change in many ways. On the one hand, they act as a carbon
pool during their service life, as they withdraw CO
2
from its natural cycle. After their service life, they can substitute for fossil fuels if they are
incinerated in adequate furnaces. On the other hand, wood products can substitute for more energy intense products made of ‘conventional’
materials. This paper quantifies the substitution and carbon pool effects of an increased use of wood in the building sector in Switzerland for
the years 2000–2130. For this purpose, life cycle data on greenhouse gas (GHG) emissions of 12 wood products and their substitutes is used as
proxies for the most important groups of building products used in construction and in interior works; this data is linked to the forecasted wood
flows for each group of building products in a cohort-model. For the political assessment, GHG effects occurring abroad are distinguished from
GHG effects occurring in Switzerland. The results show that the C-pool effect of an increased use of wood products with long service life is of
minor importance; the substitution effects associated with the thermal use of industrial and post-consumer waste wood as well as with the
substitution of ‘conventional’ materials are much more relevant, especially on a long-term. For construction materials, the Swiss share of the
GHG effect related to the material substitution is relatively high, as mainly nationally produced concrete, mineral wool, and bricks are
substituted for. For products used in interior works, the Swiss share of the GHG effect related to the material substitution is rather small (or
even negative for single products) because mainly imports are substituted, such as ceramic tiles or steel produced in the EU. The results are
rough estimates. Nonetheless, these calculations show that an increased use of wood in the building sector is a valid and valuable option for the
mitigation of greenhouse gas emissions and for reaching GHG emission targets on a mid- to long-term basis. Still, the carbon storage and
substitution capacity of an increased use of wood is relatively small compared to the overall greenhouse gas emissions of Switzerland.
wood products / substitution / sink / climate change / Kyoto protocol / life cycle assessment / GHG / CO
2
Résumé – Effets de puits de carbone et de substitution par l’utilisation augmentée de bois dans les bâtiments en Suisse. Les produits en
bois avec une longue durée de vie en service peuvent contribuer de manière diverse à la diminution des émissions de gaz à effet de serre. D’une
part, ils forment un puits de carbone issu du CO
2
retiré de l’atmosphère par l’arbre au cours de sa croissance. Après leur utilisation, ils peuvent
se substituer aux combustibles fossiles s’ils sont incinérés dans des chaudières adéquates. D’autre part, le matériau bois peuvent se substituer à
des matériaux « conventionnels » plus coûteux en énergie. Cet article quantifie les effets de la substitution et de puits de carbone qui résultent
d’une utilisation augmentée de bois dans les bâtiments en Suisse de 2000 à 2130. Dans ce but, les valeurs de rejets de gaz à effet de serre de
12 produits de bois et de ses substituts sont utilisées comme approximations pour les ensembles de produits de construction et d’aménagement
les plus importants. Ces valeurs sont combinées avec une prévision des flux de chaque ensemble de produits dans un modèle de cohortes. Pour
l’évaluation politique des résultats, les émissions des gaz à effet de serre en Suisse sont distinguées des émissions à l’étranger. Les résultats
indiquent que l’effet de puits d’une plus grande utilisation de bois à durée de vie longue est d’une moindre importance; les effets de substitution
associés à la valorisation énergétique des déchets de bois industriel et des produits en fin de vie ainsi que les effets de substitution de matériaux
« conventionnels » sont beaucoup plus significatifs, particulièrement dans une perspective à long terme. Concernant les produits de
construction, les effets de substitution de matériaux sont relativement importants en Suisse, parce que dans la majorité des cas, se son les
éléments construits en Suisse en béton ou en briques qui sont remplacés. En ce que concerne l’aménagement, les effets de substitution de
matériaux en Suisse sont relativement petits (ou même négatif dans certains cas), parce que dans la majorité des cas, ce son des produits importés
qui sont remplacés, par exemple des carreaux de céramique ou des éléments en acier fabriqués dans la CE. Les résultats de ces calculs doivent
être considérés comme estimations. Cependant, ces calculs montrent qu’une plus grande utilisation de bois dans les bâtiments est une option
valable visant à diminuer les émissions de gaz à effet de serre à moyen et long terme. Mais la capacité de puits et de substitution d’une utilisation
augmentée de bois est relativement petite, si on la compare avec le total des rejets de gaz à effet de serre en Suisse.
produits en bois / substitution / puits / changement climatique / protocole de Kyoto / analyse de cycle de vie / gaz à effet de serre / CO
2
* Corresponding author:
Article published by EDP Sciences and available at or />890 F. Werner et al.
1. INTRODUCTION
Wood as a CO
2
-neutral natural resource and energy carrier
plays an important role in the discussion on the mitigation of
climate change. Long-living wood products in particular can
contribute to the mitigation of climate change in many ways [6,
13, 15, 25, 26, 30, 31, 34]. On the one hand, wood products with
long service life act as a carbon pool during their lifetime, as
they withdraw CO
2
from its natural cycle. After service life,
they can substitute for fossil fuels if they are incinerated in ade-
quate installations; on the other hand, wood products can sub-
stitute for more energy intense products made out of
‘conventional’ materials.
The Swiss Federal Council and the Swiss Parliament have
committed to an active climate policy by signing and ratifying
the Kyoto protocol. Knowledge about the effectiveness of
measures to mitigate climate change is an important basis to
achieve this commitment.
Much work has been done on international level to develop
an adequate procedure for the accounting of long-living wood
products in national greenhouse gas (GHG) inventories [4, 9,
14, 22, 29–32, 43]. Only estimates exist about the relevance of
an increased use of wood products and the different ways this
increased use impacts climate change [25].
The study emphasises the increased use of wood in the build-
ing sector, as this usage induces the most significant GHG
effects compared to the GHG flows related to the use of paper
or other wooden products [10]. The calculations are based on
a ‘realistic’ scenario of future wood consumption in the build-
ing sector in Switzerland. For the calculations of the product-
group-specific GHG effects, life cycle data on GHG emissions
of 12 wood products and their functionally equivalent substi-
tutes is used as proxies for the most important groups of build-
ing products used for construction and for interior works. This
data is linked to the forecasted wood flows for each group of
building products in a cohort-model on a spreadsheet basis.
The model accounts for carbon flows when they occur in
time. As no wood flows are crossing national frontiers, the dis-
cussion of different accounting principles (stock-change,
atmospheric flow or production approach) is obsolete [36].
The investigation concentrates on the product-specific
effects within technosphere, where especially the substitution
effects are hardly quantified [25]; it disregards the well-inves-
tigated carbon cycle in the forest (see, e.g., [17, 23, 25, 33, 35]).
Nonetheless, some theses are presented about the relationship
between the two pools forest and long-living wood products.
Further, the results of this study will be used in a further
research project where the data of the two subsystems will be
combined to depict the GHG effects of the complete wood
chain.
2. MODEL STRUCTURE, DATA, ASSUMPTIONS
2.1. System boundaries
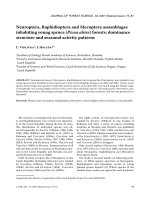
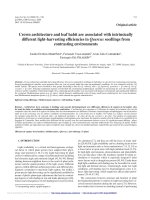
Figure 1 illustrates the investigated system with its GHG effects.
It covers the building stock as a carbon pool, production and disposal
emissions of ‘fossil’ CO
2
, substitution effects when substituting for
‘conventional’ products in the construction or interior works, and the
energetic substitution effects of a consequent energetic use of residual
and (post-consumer) waste wood.
For the political assessment, GHG effects occurring abroad and
GHG effects in Switzerland are distinguished.
Figure 1. System boundaries of the building stock and its respective GHG effects.
C-pool and substitution effects of wood products 891
A time frame from the year 2000 until 2130 is looked at, as only
shortly before the year 2130, the wood flows will be in a steady state
flow equilibrium and no more additional carbon will be stored.
2.2. Scenario development of the future use of wood
The modelling of the consequences of a future increased use of
wood in the building sector is based on the following assumptions:
– Growth rate of the building sector economy of 1% per year;
– Increase of the market share of wood products of 2% every
10 years;
– Constantly high use of wood of + 0.81 Mio. m
3
additional wood
after the year 2030;
– Logistic growth curve of the annual wood flows to show a more
realistic behaviour.
Calculations are based on an average wood density of 500 kg/m
3
and a carbon content of 50%.
Table I shows the wood use in the year 2030 that results from the
above assumptions compared to the current wood use. Total annual
wood consumption in constructions and buildings rises from 2.73 Mio. m
3
/
year in the year 2000 up to 3.54 Mio. m
3
/year in the year 2030 and
onward. This means an increased wood consumption of 0.81 Mio. m
3
or +12.5% compared to the wood consumption in the year 2000.
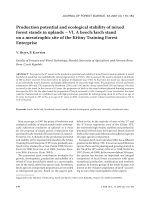
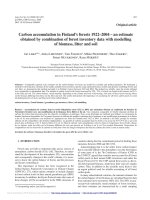
Figure 2 illustrates the increased use of wood for the years 2000 to
2130, cumulating construction wood, wood for interior works and
industrial residual wood, which is caused during industrial wood
processing. These wood quantities are attributed to the most relevant
building elements such as roofs, exterior walls, interior walls, ceilings,
floorings, etc. based on a Swiss market study on the current wood
application potential in buildings [3]. Table II shows the distribution
of the 0.81 Mio. m
3
to the different wood products. For the years
between 2000 and 2030, the input wood is distributed to the different
wood products according to this relative share stated in Table II.
With these wood quantities, the potential for wood used for roofing
or for furnishing is almost reached with a market share of about 80%
(own calculations based on [3]).
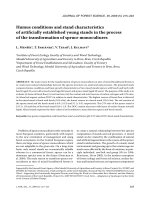
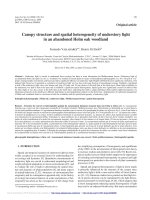
Figure 3 shows the respective cumulated waste wood flows, assum-
ing an average service life of 80 years for constructive wood products
and 25 years for wood used for interior works.
For the modelling, no distinction is made between domestic and
foreign wood. Thus, it is interesting to see if Swiss forests would be
able to supply the required wood quantities. According to the National
Inventory of Forests [2], annual growth lies around 10 Mio. m
3
of
wood. About ¾ or 7.5 Mio. m
3
are considered as usable wood. If one
compares the actual and projected future wood consumption, Swiss
forests would thus be able to satisfy the additional wood demand with-
out any imports ([11] based on [2]).
2.3. Life cycle data as the basis of the substitution
calculations
Substitution is considered as the use of wood products instead of
‘conventional’ (solid) building products or fossil fuels.
Table I. Assumed wood flows in the year 2030.
Wood consumption Current use
Optimistic scenario
Differences
Total quantity
(Mio. m
3
)
Quantity per capita
(kg/cap. per y.)
Total quantity
(Mio. m
3
)
Quantity per capita
(kg/cap. per y.)
Total quantity
(Mio. m
3
)
Quantity per capita
(kg/cap. per y.)
Construction wood 1.05 75 1.36 97 0.31 22
Wood for interior works 0.77 55 1.06 76 0.29 21
Residual wood 0.91 65 1.12 80 0.21 15
Total 2.73 195.0 3.54 253 0.81 58
Figure 2. Increased use of wood flows in the years 2000 to 2130.
892 F. Werner et al.
For the determination of products that will be affected by an
increased use of wood, assumptions must be made on the substitution
mechanism. Different substitution mechanisms are conceivable and
can depend on the type of decision maker, the type of building or the
type of intervention (new construction, renovation, etc.) [11]. For this
study, the results of an extensive survey on wood and its applicability
in buildings among builder-owners, architects and engineers are used
to determine the ‘conventional’ products to be substituted for [27, 41,
42]. Table III provides an overview of the substituting products.
For the determination of the GHG emissions associated with pro-
duction, use and disposal of the above-mentioned products, data gen-
erated by Life Cycle Assessment (LCA) according to the series of
standards ISO 14040ff is used [12] based on [18–21, 28, 37–40]. In
comparative LCA, all life cycle stages of the competing products from
raw material extraction, production to their use phase and disposal are
accounted for and assessed, including energy generation and trans-
ports.
The GHG effects are indicated in CO
2
-equivalent. This means that
all GHG emissions are weighted by the greenhouse gas potential in
relation to CO
2
[13]. For the products made out of wood, the CO
2
sequestered during photosynthesis enters the calculations as a negative
data. This CO
2
is released again during incineration or biological
decomposition at the end of the product life cycle.
It is assumed that by using an additional wood product, the pro-
duction, use and disposal of a substitute is avoided (– substitute + wood
product). A negative sign means that by using a wood product instead
of its substitute, GHG emissions are avoided; a positive sign indicates
that the (fossil) GHG emissions during the life cycle of the wood prod-
uct are higher than the ones of the substitute (for product-specific data,
see Annex).
For the determination of the substitution effect, the current import/
export shares are taken into account [12].
The above-mentioned calculations are rather sensitive with regard
to several assumptions: (a) the selected wood product representing a
group of similar wood products, (b) the selected substitute represent-
ing a group of similar ‘conventional’ products, (c) the assumption that
exactly this ‘conventional’ product substitutes for wood products, and
(d) the system boundaries and allocation procedures used in the indi-
vidual LCAs [19, 20, 38–40]. Nonetheless, attention was paid that the
compared products are functionally equivalent and have the same
service life.
Table II. Distribution of the 0.81 Mio. m
3
additional wood to the different wood products, including residual wood.
Construction m
3
Interior works m
3
Laminated timber board 70 298 Profiled board spruce 92 868
Gluelam pillar 1 054 Staircase oak 2 955
Ceiling out of wooden beams 154 145 3-layered parquet 62 989
Wood fiber insulation panel 10 783 Wood panels, rough, + supporting bars 37 382
Unlined joist construction 53 275 Doorframe, particleboard 52 322
Wood palisade 15 423 Furniture, particleboard 33 930
Total construction 304 977
Total interior works 282 446
Residual wood 222 577
Total 810 000
Figure 3. Increased waste wood flows in the years 2000 to 2130.
C-pool and substitution effects of wood products 893
3. RESULTING GHG DYNAMICS
3.1. Long-living wood products as carbon pool
If the wood pool in the building stock is enlarged, the carbon
pool is enlarged.
The average service life of construction wood of 80 years is
assumed. This implies that with an increase of wood consump-
tion until the year 2030, the wood pool in buildings will have
reached a steady state flow equilibrium in the year 2110. From
then on, the annual wood input is equal to the wood output. The
dynamics of the building stock as C-pool due to an increased
use of wood are illustrated in Figure 4.
According to the assumed development of an increased use
of wood, an enlargement of the carbon pool takes place from the
year 2010 to the year 2030 (–0.55 Mio. t CO
2
/year as a maximum).
Table III. Overview on the building products made out of wood and their substitutes.
Building element Wood elements/products Competing product/substitute
Construction
Exterior wall Laminated timber board 2-layered brick wall
Pillar Gluelam pillar Steel pillar
Ceiling Ceiling of wood beams Ceiling of reinforced concrete
Insulation Wood fibre insulation panel
1
Mineral wool
2
Roofing Unlined joist construction Porous concrete pitched roof
Underground engineering Wood palisade Concrete palisade
Interior works
Coverings of ceilings and walls Profiled board, spruce Interior plasterwork
Staircase Wooden staircase, oak Ready-made concrete staircase
Flooring 3-layered parquet flooring Ceramic tiles, enamelled
Facade Wood panels rough incl. supporting bars
1
Exterior plasterwork
2
Furnishing Doorframe, particleboard Doorframe, steel
Furniture Wood furniture, particleboard Steel furniture
1
In a laminated timber board construction.
2
In a 2-layered brick wall.
Figure 4. Dynamics of the building stock as carbon pool 2000 to 2130 (annual flows).
894 F. Werner et al.
From then on, the thermal use of the first products of interior
works at the end of their service life reduces the annual enlarge-
ment of the C-pool. From the year 2050 onward, the annual
enlargement stabilises at –0.28 Mio. t CO
2
/year until the moment
when the thermal use of the additionally used construction
wood starts. From the year 2110 onward, the wood outputs
equal the wood inputs to the system: inputs and outputs are in
a steady-state flow equilibrium. As a consequence, no more carbon
is additionally stored. The wood pool stabilises at –30 Mio. t CO
2
,
which corresponds to an additional wood volume of 32 Mio. m
3
in the building stock. This carbon pool potential corresponds
to about 60% of the GHG emissions of Switzerland in one year;
this potential will be reached by the year 2110.
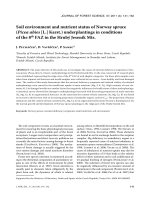
3.2. Production emissions and substitution effects
The relation between production emissions, the possible C-
pool effect and possible substitution effects are product-depend-
ent, as Figure 5 shows on an exemplary basis (for detailed data,
see Annex).
Figure 5 demonstrates that the (fossil) GHG emissions
related to production and disposal can surpass the carbon con-
tent of a finished wood product (example doorframes), but can
also be considerably lower. Generally, the fossil GHG emis-
sions from disposal are neglectable compared to the production
emissions, except the ones for solid exterior walls (weight!).
The production and disposal emissions of ‘conventional’
products tend to be higher than the ones caused by wood prod-
ucts [1, 13]; the exception of the insulation material confirms
this rule.
Also the locations of the relevant GHG emissions can differ.
If ‘conventional’ products are produced abroad, an additional
wood consumption in Switzerland will increase the national
GHG inventory, as emissions occurring abroad will be substi-
tuted for (example floorings). A similar mechanism can be
observed with the products for interior works, as ‘conventional’
products are often made of GHG-intense but imported steel; the
associated emissions in Switzerland are relatively low. For con-
struction materials on the contrary, the substitution for gener-
ally GHG-intense, heavy and thus nationally produced,
Figure 5. Selected product-specific potential carbon pool capacities, production emissions and substitution effects, in Switzerland (CH) and
abroad.
C-pool and substitution effects of wood products 895
‘conventional’ products of concrete or bricks will lead to a
reduction of the GHG emissions in Switzerland.
Figure 6 illustrates that an increased use of wood for ceilings
will develop the highest substitution effects in a global perspec-
tive as well as in Switzerland. Given the currently low market
share, wooden ceilings constitute a high potential for a GHG
reducing use of wood. Further, a consequent and efficient ther-
mal use of the additional residual wood in suited adequate fur-
naces to substitute for fossil fuels is of utmost importance.
This result confirms the insight gained during the product-
specific considerations: the substitution of GHG-intense ‘con-
ventional’ (semi-finished) products for interior works provides
a considerable GHG effect but the emissions are mainly sub-
stituted abroad. Contrary to that, the substitution of ‘conven-
tional’ construction products provides a certain GHG emissions
reduction potential in Switzerland, besides the ceilings also for
exterior wood walls. Table IV gives a summary of the produc-
tion and disposal emissions as well as of the substitution effects
of an increased use of wood of 0.81 Mio. m
3
/year.
3.3. Energetic substitution effects
The substitution capacity described in the previous section
does not take into account the thermal utilisation of the residual
and post-consumer waste wood. To calculate this effect, two
100 kW incineration facilities fired with fuel oil and logs are
compared. The difference shown in Table V is used to calculate
the energetic substitution effects of an increased use of wood.
Around 0.21 Mio. m
3
/year of the additionally used 0.81 Mio.
m
3
/year wood (from the year 2030 onward) end up as industrial
residual wood and are used for the production of thermal
energy. According to the calculations based on Table V, about
0.096 Mio. t CO
2
-equiv./year can be avoided because of the
substitution of fossil fuels with the additional residual wood.
The remaining 0.6 Mio. m
3
/year or 300 000 t of wood/year
enter the building stock and can be used thermally at the end
of the service life of the building elements. If all the wood that
is additionally used in the building stock will be used thermally
in specialised wood incinerators, an additional energetic sub-
stitution effect of 0.265 Mio. t CO
2
-equiv./year can be
Table IV. GHG emissions related to wood product production and disposal, and substitution effects related to an increased use of wood of
0.81 Mio. m
3
/year.
Production emissions (+ disposal) Material substitution
CH
(Mio. t CO
2
-equiv.)
abroad
(Mio. t CO
2
-equiv.)
CH
(Mio. t CO
2
-equiv.)
abroad
(Mio. t CO
2
-equiv.)
0.152 0.166 –0.261 –0.335
Figure 6. Substitution effects of different wood products due to an increased use of wood, in Switzerland (CH) and abroad (+ 0.81 Mio. m
3
of
wood).
896 F. Werner et al.
achieved. This substitution effect is composed of the incinera-
tion of the products used for interior works (after a service life
of 25 years) as well as of the products used for construction
(after a service life of 80 years).
In total and over the whole life cycle of the wood products,
emission reductions of 0.36 Mio. t CO
2
-equiv. can be achieved
with a consequent and efficient thermal utilisation of the gen-
erated residual and post-consumer waste wood as consequence
of an additional use of 0.81 Mio. m
3
wood. In these calcula-
tions, a CO
2
-neutral decomposition (or incineration without
energy recovery) of waste wood is assumed as the reference
scenario; also avoided methane emissions or carbon storage
effects in landfills of wood are disregarded, as the dumping of
waste wood is prohibited in Switzerland.
3.4. GHG emissions dynamics of an increased use
of wood
The GHG emissions dynamics of an increased use of wood
are relatively complex, as different effects with different tem-
poral dynamics overlap. Figure 7 summarises the effects of a
steadily increased use of wood up to 0.81 Mio. m
3
/year from
the year 2030 onward (see Sect. 2.2).
Several points can be observed:
– The net GHG effects of the material substitution (emis-
sions avoidance of 0.6 Mio. t CO
2
) are more important than
the (fossil) GHG emissions related to the production and dis-
posal of the wood products (emissions of 0.3 Mio. t CO
2
);
– The avoided (fossil) GHG emissions due to the thermal
use of construction waste wood become more important than
the thermal use of residual wood as soon as the thermal use of
the construction waste wood reaches a constant level (2050);
– The substitution of fossil fuels as a consequence of the
thermal use of residual and waste wood as well as the effects
of the material substitution compensate by far the (fossil)
GHG emissions from the production and disposal of the wood
products. They are also more important than the effect on the
carbon pool, especially on long-term (this reconfirms findings
of [1, 13, 23]);
– The stabilisation of the carbon pool is not compensated
by the additional thermal use of waste wood and its substitu-
tion effect from the year 2090 onward;
Table V. Fuel inputs and GHG emissions of different installations for the generation of 1 TJ usable energy (278 MWh) [8].
Fuel Size of the installation
(kW)
Fuel quantity
(kg)
Fossil GHG emissions
(kg CO
2
-equiv.)
Difference
(kg CO
2
-equiv.)
Fuel oil 100 27 200 91 100 88 090
Logs 100 100 000 3 010
1
1
Emissions from chainsaws, transports, etc.
Figure 7. GHG emissions dynamics of an increased use of wood (2000–2130).
C-pool and substitution effects of wood products 897
– In the first years (2010 to the year 2035), the enlargement
of the C-pool contributes around 60% to the total GHG effect.
The relative contribution of the C-pool diminishes over the
years from the year 2030 onward;
– The largest GHG effect over the shortest time will be
reached until the year 2020.
3.5. Influence of Swiss national boundaries
Political decisions to increase the use of wood are made on
national level, as well as the inventorisation of the GHG emis-
sions of Switzerland. Thus, the GHG effects of an increased use
of wood within Switzerland are of particular interest. The con-
tributions of the different GHG-relevant mechanisms of an
increased use of wood over time are depicted in Figure 8 (see
also Fig. 7 for comparison).
Figure 9 illustrates the cumulated GHG flows for the same
period.
One can conclude that:
– The mayor part of the GHG effect as a consequence of an
increased use of wood occurs in Switzerland;
– The dynamics of the GHG emissions in Switzerland cor-
respond to the dynamics of the total flows (see Fig. 9);
– In the steady state flow equilibrium (in the year 2110), the
thermal use of waste wood is as relevant as the material sub-
stitution in Switzerland;
– During the first years, the fossil production emissions of
the wood products are smaller than the C-pool effect; the rele-
vance of the C-pool effect decreases in later years compared to
the steadily increasing cumulated production emissions as
well as compared to the total GHG effect;
– A consequent and efficient use of post-consumer waste
wood in adequate incinerators is a key strategy for the mitiga-
tion of the GHG relevance of Switzerland – given the relation
of residual wood and waste wood flows even more relevant
than the thermal use of the residual wood.
An in-depth analysis of the (fossil) GHG emissions related
to production and disposal as of the effects of the material sub-
stitution reveals that:
– About the same amount of GHG emissions related to pro-
duction and disposal is released abroad and in Switzerland;
– The effect of the material substitution abroad corresponds
more or less to the GHG effect achieved in Switzerland.
As one can see in the above figures, the relevance of the
described effects changes over time. Table VI summarises the
cumulated effects as well as their relative share of the total GHG
effect in Switzerland for some (politically relevant) years.
Note for the interpretation of this table that emissions stated
for earlier years cannot be added up with the stated emissions
from later periods (cumulative data). The tendencies of the rel-
ative importance of single effects compared to the over-all
effect in Switzerland can easily be figured out by looking at the
percentages in a horizontal way.
Particular political relevance has the data for the year 2012,
as this is the final year of the first commitment period of the
Kyoto protocol. The relevance of the C-pool with a contribution
Figure 8. Annual GHG flows in Switzerland due to an increased use of wood (2000–2130).
898 F. Werner et al.
of –62% of the total effect in Switzerland is particularly note-
worthy, followed by the net effect of the material substitution
with a relative effect of –27%. Of lower importance at this point
in time is the effect of the thermal use of residual wood with
–11%; post-consumer waste wood of the increased use of wood
is still not available at that moment. These ‘positive’ effects go
along with product emissions of around 18% of the total effect
of an increased use of wood in Switzerland.
If one considers the effect of an increased use of wood in
the mirror of the reduction commitment in absolute terms, the
following picture arise. Assuming annual national average
GHG emissions of around 53 Mio. t CO
2
-equivalents, the
reduction commitment of 8% over 5 years adds up to around
21 Mio. t CO
2
-equivalents. If this data is compared with the
cumulated effect of an increased use of wood for the years
2008–2012, the total effect of 0.49 Mio. t CO
2
is equivalent of
Figure 9. Cumulated GHG effects of an increased use of wood in Switzerland (2000–2130).
Table VI. Cumulated GHG
effect and relative share of the total GHG effect of an increased use of wood in Switzerland.
Year C-pool Production emissions
of wood products
(fossil) CH
Material substitution
(net effect) CH
Energetic substitution
residual wood
Energetic substitution
waste wood
Total CH Total
(Mio. t CO
2
)(Mio. t CO
2
)(Mio. t CO
2
)(Mio. t CO
2
)(Mio. t CO
2
)(Mio. t CO
2
)(Mio. t CO
2
)
2000 0.00 0.00 0.00 0.00 0.00 0.00 0.00
2010 –0.13 0.04 –0.05 –0.02 0.00 –0.20 –0.29
62.5% –17.2% 26.7% 10.8% 0.0% 100.0% 141.0%
2012 –0.31 0.08 –0.14 –0.05 0.00 –0.49 –0.69
61.9% –17.1% 27.4% 10.7% 0.0% 100.0% 139.7%
2030 –8.54 2.36 –4.05 –1.48 0.00 –14.08 –19.26
60.7% –16.8% 28.8% 10.5% 0.0% 100.0% 136.9%
2050 –16.73 5.40 –9.28 –3.39 –1.36 –30.77 –42.64
54.4% –17.6% 30.2% 11.0% 4.4% 100.0% 138.6%
2100 –29.25 13.00 –22.34 –8.16 –8.60 –68.36 –96.96
42.8% –19.0% 32.7% 11.9% 12.6% 100.0% 141.8%
2130 –29.28 17.56 –30.18 –11.03 –16.54 –87.03 –125.67
33.7% –20.2% 34.7% 12.7% 19.0% 100.0% 144.4%
C-pool and substitution effects of wood products 899
about 2% of the reduction commitment. This low value is the
consequence of the fact, that the increased use of wood starts
to become significant not earlier than the year 2010; the greatest
effect of this wood use scenario develops between 2020 and
2030 (Fig. 8).
This low relevance for the first commitment period should
not be misinterpreted: an increased use of wood constitutes a
reasonable measure to mitigate climate change – but only on a
medium to long-term. This illustrates Figure 10, which shows
how the GHG emissions of Switzerland would develop if the
building elements were built of ‘conventional’ materials
instead of wood.
In such a scenario, cumulated additional emissions of
0.22 Mio. t CO
2
-equivalents in Switzerland related to the use
of ‘conventional’ products are facing cumulated emissions
reductions and C-pool effects of around –0.5 Mio. t CO
2
-equiv-
alents because of an increased use of wood.
3.6. Theses on the interplay of forests and wood
products as carbon pool
The principal aim of the investigation described above is to
investigate the importance and dynamics of different GHG-
related effects of an increased use of wood within technosphere.
One important effect of an increased use of wood was
neglected: the decline of the carbon storage in the forests
because of an increased wood extraction.
This interplay will be investigated in a future project where
these results will be coupled to an investigation of the GHG
effects of different forest management practices. Nonetheless,
some general considerations on the pool dynamics of forests
and wood products should be presented here.
The success to enlarge the pool of long-living wood products
in technosphere and to achieve a major GHG abatement effect
will depend on various variables:
– Up to twice as much biomass will be cut in the forests
compared to the wood quantities that enter the building stock
(conifers about + 25% [1]). The forests will thus lose up to
twice as much carbon than will be potentially stored in long-
living wood products (excluding potential effects on the
organic carbon soil content);
– The way in which the remaining wood is used will be a
key factor with regard to the source effect of cutting trees.
Substituting for fossil fuels with the surplus organic material
seems the most promising strategy from a climate change per-
spective [1, 5, 24]. Nonetheless, site productivity should not
be affected [25];
– Mathematically, the results will depend much on the use
of the forests in the scenario where only additional ‘conven-
tional’ materials are used [1, 7, 16, 24];
– The over-all C-pool effect will basically depend on the
ratio between the growth rate of new trees and the service life
of products [6];
– Negative overall pool effects (‘source’ effects) cannot be
excluded from an increased use of wood–at least in a short to
medium-term. Still, the size of the energetic and material sub-
stitution effects will justify an increased use of wood in any
case.
Figure 10. Scenario ‘conventional’ products instead of wood products 2000–2012 (cumulated flows).
900 F. Werner et al.
4. CONCLUSIONS
An increased use of wood in the building sector can have
relevant effects in terms of GHG emissions reductions on a
medium term. Substitution effects related to the thermal use of
residual and post-consumer waste wood as well as effects
related to the substitution of wood products for products made
of ‘conventional’ materials contribute the most to the over-all
GHG effect. The C-pool effect due to the enlargement of the
pool of wood products should not be overestimated and might
in fact be rather low. This effect is linked to a far larger decrease
of the standing volume of trees (and thus carbon) in the forests
and of soil carbon because of the harvesting, an effect that is
compensated only very slowly by the re-growth of the forest.
Understanding the linkage between forest carbon pools and
flows and the building carbon pools and flows in detail is an
urgent research need.
Given the relative importance of the energetic substitution
effects, it is not surprising to see that the mayor part of the GHG
effects occur in Switzerland. Still, a Swiss national strategy to
mitigate climate change by an increased use of wood products
should target at wood products used for construction. Only for
this group of wood products, the related material substitution
effects occur within Switzerland, as energy-intense, locally
produced, heavy products such as concrete or bricks are sub-
stituted for. On the contrary, wood products used for interior
works mostly substitute for imported products such as steel or
ceramic tile; the related substitution effect in Switzerland is
low, or even negative.
Concluding, three key elements of a Swiss strategy to miti-
gate climate change by an increased use of wood in buildings
are summarized:
1. Efficient and effective thermal use of residual and post-
consumer waste wood to substitute for fossil fuels;
2. Increased use of wood in the construction;
3. Avoidance of collateral carbon emissions in the forests
during harvesting (decrease of the carbon pool in trees and for-
est soil), i.e. the thermal utilisation of harvesting residues to
substitute for fossil fuels.
Finally, it has to be stated that the GHG effects related to an
increased use of wood in buildings are not sufficient to compensate
the high GHG emissions in other sectors of the economy. Addi-
tional measures in those sectors – traffic for example – are nec-
essary to meet the (future) Kyoto commitment of Switzerland.
Acknowledgements: We gratefully acknowledge the careful revi-
sions of the manuscript by two anonymous reviewers.
REFERENCES
[1] Börjesson P., Gustavsson L., Greenhouse gas balances in building
construction: wood versus concrete from life-cycle and forest land-
use perspectives, Energy Policy 28 (2000) 575–588.
[2] Brassel P., Brändli U.B., Swiss national forest inventory; results of
the second sampling 1993–1995, Haupt, Bern, Stuttgart, Wien,
1999 (in German).
[3] BUWAL, Final consumption of wood in Switzerland 1996, Bunde-
samt für Umwelt, Wald und Landschaft (BUWAL), Bern, 1996 (in
German).
[4] Dias A.C., Louro M., Arroja L., Capela I., The contribution of
wood products to carbon sequestration in Portugal, Ann. For. Sci.
62 (2005) 903–909.
[5] Eldag H., Wood and wood products, in: Altenpohl D.G. (Ed.),
Materials in world perspective; assessment of resources, technolo-
gies and trends for key materials industries, Springer-Verlag, Ber-
lin, Heidelberg, New York, 1980, pp. 105–117.
[6] Fischlin A., Conflicting objectives while maximising carbon
sequestration by forests, in: Apps M.J., Price D.T. (Eds.), Forest
ecosystems, forest management and the global carbon cycle, Sprin-
ger-Verlag, Berlin, Heidelberg, 1996, pp. 163–172.
[7] Fleischer G., Schmidt W P., Functional unit for systems using
natural raw materials, Int. J. LCA 1 (1996) 23–27.
[8] Frischknecht R., Knechtle N., Heating energy out of fuel oil, natural
gas or wood? Bundesamt für Bundesamt für Umwelt, Wald und
Landschaft (BUWAL), Bern, 2000 (in German).
[9] Hashimoto S., Nose M., Obara T., Moriguchi Y., Wood products:
potential carbon sequestration and impact on net carbon emissions
of industrialized countries, Environ. Sci. Policy 5 (2002) 183–193.
[10] Hofer P., Morf L., Taverna R., Richter K., CO
2
sequestration in
wood pools in the civilisatoric circle and emission effects of subs-
titution of an increased use of wood, GEO Partner, Zürich, 2001
(in German).
[11] Hofer P., Taverna R., Richter K., Werner F., Buildings as wood
pool, GEO Partner, Zürich, 2002 (in German).
[12] Hofer P., Taverna R., Richter K., Werner F., Sink capacity and
material substitution of the Swiss buildings with regard to the natio-
nal greenhouse gas inventory, GEO Partner, Zürich, 2002,
(in German).
[13] IPCC, Climate change 1995; the science of climate change, Cam-
bridge University Press, published for the International Panel on
Climate Change (IPCC), Cambridge, 1996.
[14] IPCC, Evaluating approaches for estimating net emissions of car-
bon dioxide from forest harvesting and wood products; meeting
report, Dakar, Senegal, 5–7 May 1998, in: Brown S., Lim B.,
Schlamadinger B. (Eds.), IPCC/OECD/IEA Programme on Natio-
nal Greenhouse Gas Inventories, Geneva, 1998.
[15] IPCC, Land use, land-use change, and forestry; a special report of
the IPCC, Cambridge University Press, Cambridge, 2000.
[16] Jungmeier G., Werner F., Jarnehammer A., Hohenthal C., Richter
K., Allocation in LCA of wood-based products, experiences of Cost
Action E9, part I. Methodology, Int. J. LCA 7 (2002) 290–294.
[17] Karjalainen T., Model computations on sequestration of carbon in
managed forests and wood products under changing climatic con-
ditions in Finland, J. Environ. Manage. 47 (1996) 311–328.
[18] Künniger T., Richter K., Environmental comparison of electricity
mains made from impregnated wood, reinforced concrete and cor-
rosion-protected steel, Eidg. Materialprüfungs- und Forschung-
sanstalt (EMPA), Dübendorf, 1997 (in German).
[19] Künniger T., Richter K., Environmental assessment of railway slee-
pers in Switzerland; sleepers made of prestressed concrete, profiled
steel and creosote-treated beech wood, Forschungs- und Arbeitsbe-
richt 115/38, Eidg. Materialprüfungs- und Forschungsanstalt
(EMPA), Dübendorf, 1998 (in German).
[20] Künniger T., Richter K., Environmental assessment of construc-
tions of garden and landscape architecture, Eidg. Materialprüfungs-
und Forschungsanstalt (EMPA), Dübendorf, 2000 (in German).
[21] Künniger T., Richter K., Werner F., Life cycle inventory data of
gravel, cement and concrete, Eidg. Materialprüfungs- und Fors-
chungsanstalt (EMPA), Dübendorf, 2000 (in German).
C-pool and substitution effects of wood products 901
[22] Marland E., Marland G., The treatment of long-lived, carbon-con-
taining products in inventories of carbon dioxide emissions to the
atmosphere, Environ. Sci. Policy 6 (2003) 139–152.
[23] Marland G., Marland S., Should we store carbon in trees, Water Air
Soil Pollut. Special issue on Natural sinks of CO
2
, 64 (1992) 181–
195.
[24] Marland G., Schlamadinger B., Forests for carbon sequestration or
fossil fuel substitution? A sensitivity analysis, Biomass Bioenergy
13 (1998) 389–397.
[25] Matthews R.W., Nabuurs G J., Alexeyev V., Birdsey R.A., Fischlin
A., Maclaren J.P., Marland G., Price D.T., WG3 summary: evalua-
tion of the role of forest management and forest products in the car-
bon cycle, in: Apps M.J., Price D.T. (Eds.), Forest ecosystems,
forest management and the global carbon cycle, Springer-Verlag,
Berlin, Heidelberg, 1996, pp. 293–301.
[26] Niles J., Schwarze R., The value of careful carbon accounting in
wood products, Clim. Change 49 (2001) 371–376.
[27] Quetting M., Wiegand J., Sell J., Indepth investigation on decision
motives and on the image of wood for building construction in
Switzerland, Eidg. Materialprüfungs- und Forschungsanstalt
(EMPA), Dübendorf, 1999 (in German).
[28] Richter K., Gugerli H., Wood and wood products in comparative
life cycle assessment, Holz Roh- Werks. 54 (1996) 225–231 (in
German).
[29] SBSTA/UNFCCC, FCCC/SBSTA/2001/Misc.1: Issues related to
emissions from forest harvesting and wood products; submission
from Parties, in Subsidiary Body for Scientific and Technological
Advice (Ed.), 2001.
[30] SBSTA/UNFCCC, FCCC/SBSTA/2003/Misc.1: Good practice
guidance and other information on land use, land-use change and
forestry; implications of harvested wood products accounting; sub-
mission from Parties, in Subsidiary Body for Scientific and Tech-
nological Advice (SBSTA) (Ed.), 2003.
[31] SBSTA/UNFCCC, FCCC/SBSTA/2003/Misc.1/Add.1: Good practice
guidance and other information on land use, land-use change and
forestry; implications of harvested wood products accounting; sub-
mission from Parties; addendum, in Subsidiary Body for Scientific
and Technological Advice (SBSTA) (Ed.), 2003.
[32] SBSTA/UNFCCC, FCCC/SBSTA/2003/Misc.1/Add.2: Good prac-
tice guidance and other information on land use, land-use change
and forestry; implications of harvested wood products accounting;
submission from Parties; addendum, in Subsidiary Body for Scien-
tific and Technological Advice (Ed.), 2003.
[33] Sedjo R.A., Forests to offset the greenhouse effect, J. For. 87 (1989)
12–15.
[34] Skog K.E., Nicholson G.A., Carbon cycling through wood pro-
ducts: the role of wood and paper products in carbon sequestration,
For. Prod. J. 48 (1998) 75–83.
[35] Thompson D.A., Matthews R.W., The storage of carbon in trees
and timber, Forestry Commission Research information note 160,
Edinburgh, 1989.
[36] UNFCCC/TP, FCCC/TP/2003/7: Estimation, reporting and
accounting of harvested wood products, 2003.
[37] Werner F., Richter K., Life cycle assessment of parquet floorings,
Holz-Zbl. 123 (1997) 1759 (in German).
[38] Werner F., Richter K., Bosshart S., Frischknecht R., Environmental
comparison of interior works on the example of doorframes out of
solid wood, particle board and steel, EMPA/ETH-Forschungsbe-
richt, Dübendorf, Zürich, 1997 (in German).
[39] Werner F., Richter K., Life cycle assessment of facades, Innovative
Fassaden; Tagung Baden-Baden, 7. und 8. November 2001, VDI-
Bericht 1642, VDI-Gesellschaft Bautechnik, Düsseldorf, 2001,
pp. 243–253 (in German).
[40] Werner F., Künniger T., Althaus H J., Richter K., Life cycle inven-
tories of wood as fuel and construction material, Dübendorf,
November 2002, Centre for life cycle inventories in the ETH
domain, Dübendorf, 2003.
[41] Wiegand J., Quetting M., Results for building construction; inves-
tigation on the decision motives and knowledge on wood, SAH
Bull. CSRB 3 (1999) 13–29 (in German).
[42] Wiegand J., Quetting M., Results in the remaining building sector
and for furniture; investigation on the decision motives and
knowledge on wood, SAH bulletin CSRB 3 (1999) 30–35 (in
German).
[43] Winjum J.K., Brown S., Schlamadinger B., Forest harvests and
wood products: sources and sinks of atmospheric carbon dioxide,
For. Sci. 44 (1997) 271–284.
Annex. Product-specific GHG emissions (excluding renewable CO
2
-emissions), carbon pool capacity and weight of the wood products and
their substitutes under study, taking into account national boundaries; import/export relations of final or semi-finished products are considered.
Fossil fuel
emissions CH
kg CO
2
-equiv.
Fossil fuel
emissions abroad
kg CO
2
-equiv.
Total fossil fuel
emissions
kg CO
2
-equiv.
Wood as
C-pool
kg CO
2
-equiv.
Weight product
(+ repair)
kg
Weight wood
(u = 12%)
kg
Weight wood
(u = 0%)
kg
Laminated timber board (m
2
) Production 16.27 13.72 30.00 –121.03 95.9 74.0 66.1
Disposal 1.15 0.96 2.11 121.03
Total 17.42 14.68 32.11
2-layered brick wall (m
2
) Production 90.04 30.41
Disposal 12.49 4.72
Total 102.53 35.13
Glualam pillar (piece) Production 2.66 27.45 30.11 –44.16 34.6 27.0 24.1
Disposal 0.40 0.32 0.72 44.16
Total 3.07 27.76 30.83
Steel pillar (piece) Production 0.70 84.76 37.1
Disposal
Total 0.70 84.76
902 F. Werner et al.
Annex. Continued.
Fossil fuel
emissions CH
kg CO
2
-equiv.
Fossil fuel
emissions abroad
kg CO
2
-equiv.
Total fossil fuel
emissions
kg CO
2
-equiv.
Wood as
C-pool
kg CO
2
-equiv.
Weight product
(+ repair)
kg
Weight wood
(u = 12%)
kg
Weight wood
(u = 0%)
kg
Ceiling of wood beams (m
2
) Production 23.58 26.22 49.80 –92.24 188.3 56.4 50.4
Disposal 4.07 1.88 5.94 92.24
Total 27.64 28.10 55.74
Ceiling of reinforced concrete (m
2
) Production 76.85 30.66 640.1
Disposal 67.30 18.83
Total 144.15 49.49
Wood fibre insulation panel (m
2
) Production 12.04 3.81 15.85 –52.50 32.1 32.1 28.7
Disposal 0.47 0.37 0.85 52.50
Total 12.51 4.18 16.69
Mineral wool (m
2
) Production 3.41 1.33 4.5
Disposal 0.21 0.07
Total 3.61 1.40
Unlined joist construction (m
2
) Production 33.24 9.55 42.78 –68.69 99.1 42.0 37.5
Disposal 2.64 1.07 3.71 68.69
Total 35.88 10.62 46.50
Porous concrete pitched roof (m
2
) Production 34.65 55.23 89.88 –15.37 170.4 9.4 8.4
Disposal 3.90 1.54 5.44 15.37
Total 38.55 56.77 95.32
Wood palisade (m
2
) Production 18.78 102.27 121.05 –699.75 443.7 427.8 382.0
Disposal 4.27 0.44 4.72 699.75
Total 23.05 102.71 125.77
Wooden staircase, oak (m
2
) Production 1.35 5.35 6.70 –105.15 77.1 64.3 57.4
Disposal 0.84 0.66 1.50 105.15
Total 2.19 6.01 8.20
Ready-made concrete staircase (piece) Production 29.24 50.11
Disposal 21.50 6.07
Total 50.74 56.18
3-layered parquet flooring (m
2
) Production 3.15 3.45 6.60 –15.03 12.5 9.2 8.2
Disposal 0.22 0.15 0.37 15.03
Total 3.38 3.59 6.97
Ceramic tiles, enamelled (m
2
) Production 0.82 21.72 18(+18)
Disposal 0.97 0.37
Total 1.79 22.09
Wood panels, rough, + supporting
strips (m
2
)
Production 0.44 –0.33 0.11 –18.81 11.6 11.5 10.3
Disposal 0.20 0.22 0.42 18.81
Total 0.64 –0.11 0.53
Exterior plasterwork (m
2
) Production 7.96 14.07 45(+45)
Disposal 2.39 0.96
Total 10.35 15.03
Doorframe, particleboard (piece) Production 21.22 33.38 54.60 –26.84 20(+20) 16.4 14.7
Disposal 0.98 0.85 1.83 26.84
Total 22.20 34.23 56.43
Doorframe, steel (piece) Production 19.66 74.02 90.0
Disposal 3.40 0.00
Total 23.06 74.02
Wood furniture, particleboard (piece) Production 16.25 24.93 41.18 –26.84 20(+20) 16.4 14.7
Disposal 0.98 0.85 1.83 26.84
Total 17.23 25.78 43.01
Steel furniture (piece) Production 7.54 63.45 18.0
Disposal 0.00 0.00
Total 7.54 63.45