Báo cáo lâm nghiệp: "Tension wood occurrence in three cultivars of Populus × euramericana. Part I: Inter-clonal and intra-tree variability of tension wood" ppsx
Bạn đang xem bản rút gọn của tài liệu. Xem và tải ngay bản đầy đủ của tài liệu tại đây (1.03 MB, 8 trang )
23
Ann. For. Sci. 63 (2006) 23–30
© INRA, EDP Sciences, 2006
DOI: 10.1051/forest:2005095
Original article
Tension wood occurrence in three cultivars of Populus × euramericana.
Part I: Inter-clonal and intra-tree variability of tension wood
Miguel Angel BADIA, Thiéry CONSTANT, Frédéric MOTHE, Gérard NEPVEU
LERFOB, UMR INRA-ENGREF, Wood Quality Research Team, Research Centre of Nancy, 54280 Champenoux, France
(Received 25 September 2004; accepted 31 May 2005)
Abstract – The main wood quality problem affecting poplar trees is tension wood occurrence associated to end-splits after felling, distortions
of products, woolly wood, etc. The objective of this study was to estimate the occurrence of tension wood by using the external shape of the
stem and the 3D distribution of annual growth rings. This paper is the first of two papers and presents the inter-clonal and intra-tree tension
wood variability. A clear clonal-effect was observed on tension wood area percentage (I-MC>I214>Luisa Avanzo). The clone with the best tree
morphology (I-MC) showed the highest percentage of tension wood (15.3%). Concerning the intra-tree variability, tension wood extent
increased significantly at the tree base (< 30–50 cm). In the radial direction of the stem, the percentage of tension wood showed an U-shape
distribution. The first peak, close to the pith, corresponds to the “establishment growth period” during the open growth and the second peak,
close to the bark corresponds to the “competition growth period”.
tension wood / poplar / variability / cultivar / secondary growth
Résumé – Présence de bois de tension dans trois variétés de Populus × euramericana. Partie I : Variabilité inter-clonale et intra-arbre
du bois de tension. Le principal problème de qualité affectant les peupliers est la présence de bois de tension associée aux fentes à l’abattage,
aux déformations des sciages, ou au bois pelucheux… L’objectif principal de ce travail est d’estimer la distribution du bois de tension à partir
de la forme détaillée de l’arbre et de son empilement de cernes en 3D. Cet article est le premier d’une série de deux, où nous présentons la
variabilité inter-clonale et intra-arbre du bois de tension. L’analyse de la variabilité du pourcentage surfacique de bois de tension met en
évidence un fort effet clone (I-MC>I214>Luisa Avanzo) et montre aussi que le clone avec la meilleure conformation morphologique (I-MC)
présente la proportion de bois de tension plus élevée (15.3 %). En ce qui concerne la variabilité intra-arbre, la proportion de bois de tension
présente une augmentation significative à la base de l’arbre (< 30–50 cm). Dans la direction radiale, la distribution du bois de tension présente
une structure bi-modale en forme de « U ». Le premier mode du côté de la moelle correspondrait à une phase de croissance libre, dite phase
« d’établissement » et le second du côté de l’écorce à une phase de recherche de la lumière dite « phase de compétition ».
bois de tension / peuplier / variabilité / cultivar / croissance secondaire
1. INTRODUCTION
The choice of cultivars in a plantation management depends
mainly on the environmental conditions, but also on their resist-
ance to pathogens, growth rate, tree form and of course wood
quality. One of the most important wood properties for the tra-
ditional use of poplar wood is the low percentage of tension
wood. However, due to the complexity of tension wood meas-
urements, this defect is not always considered in the clonal
selection process. Different methods of macroscopic detection
are reported in the literature: staining [11, 18, 20], longitudinal
and tangential shrinkage [12, 35], naked eye [3, 23, 28, 29], etc.
However, all these techniques allowed the authors to observe
a strong inter-clonal effect on tension wood variability. Sacré
and Leclercq showed that tension wood proportion varies from
7.1 to 40% according to the clone [24, 31].
The complexity of techniques for tension wood identifica-
tion have often led the authors to restrict them to only one posi-
tion within the stem in order to compare several clones without
considering the intra-tree variability. Researchers interested in
the internal distribution of tension wood through the whole tree,
and who consider the active function of reaction wood in the
straight part of the tree [4, 36], have tried to connect the longi-
tudinal and radial distribution of reaction wood with the tree
form (lean, curves, eccentricity, etc.) [1, 7, 9, 13, 34, 37] and
the architectural structure (effect of lateral branch develop-
ment, etc.) [10, 15, 25]. In both types of studies, the main dif-
ficulty encountered in the analysis of mature trees was that the
past of the trees was unknown: only the current form can be
observed, but the history responsible for the final form is not
accessible. The internal distribution of reaction wood can vary
considerably according to this history. However, beyond the
* Corresponding auteur:
Article published by EDP Sciences and available at or />24 M.A. Badia et al.
behaviour of each specimen in response to its individual envi-
ronment certain constraints will be found in all specimens lead-
ing to the same response. Thus we can observe a structured
pattern in the reaction wood distribution in response to control-
led environmental factors such as silviculture.
In this study, we observed the tension wood variability
between three of the most planted cultivars in Valley of Cinca
(Spain): I214, Luisa Avanzo and I-MC, as well as the intra-tree
variability. We present here the distribution of tension wood in
nine stems of poplar rapidly grown under plantation management.
2. MATERIALS AND METHODS
Nine poplar trees were sampled in Valle del Cinca (Spain). A pre-
liminary inventory was carried out to define the most representative
typology of tree shape. A rather good homogeneity of the growth con-
ditions (wind direction, soil, exposure, watering by flooding) was
ensured by selecting the plots close to each other, and by selecting the
individuals of the same cultivar in the same plantation. The plantation
density was 277 stems per hectare (6 m spacing). The dendrometrical
characteristics of these nine trees are illustrated in Table I.
The tree shape of the nine trees was digitised using an experimental
method developed during a Ph.D. work [2]. In order to connect the
occurrence of tension wood (TW) to the standing trunk shape it was
necessary to find a method to calculate the tree shape, the log shape,
the discs and the ring properties in the same system of coordinate. In
this case, a chain of devices combining laser distancers and image anal-
ysis systems was used [14]. The result was a precise location of the
characteristics measured on each disc in the standing tree. Using this
information, the local lean per disc or per growth ring could be calcu-
lated as the angle between the vertical axis and a line joining the centre
of gravity of the disc below and above the disc studied [14]. Then the
mean local lean per tree, was calculated as the average of the different
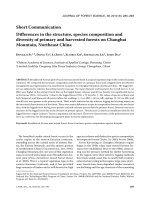
local lean per disc analysed in the stem. Figure 1 shows the three levels
of shape analysis: (A) shape of the standing tree, (B) location of each
disc and wood properties inside the tree, (C) disc level with growth
rings and TW (dark grey).
Table I. Main dendrometric characteristics of the trees sampled with respect to shape indices (Ht = total height, DBH = diameter at breast
height).
Shape index Name Cultivars Age (year) Ht (m) DBH (cm) Ht/DBH Crown surface (m
2
)
Straight
I_1
Populus × euramericana
cv. I214
16 30.5 38 80.5 63.3
Leaning
I_2 17 28.9 43 66.5 44.2
Flexuous
I_3 16 28.5 36 79.9 52.5
Straight
LA1
Populus × euramericana
cv. Luisa Avanzo
16 30.2 43 69.8 62.8
Leaning
LA2 16 29.7 38 77.1 74.9
Flexuous
LA3 16 27.4 41 65.7 70.7
Straight
MC1
Populus × euramericana cv. MC
16 35.9 41 87.1 58.8
Leaning
MC2 16 30.2 40 74.7 39.0
Flexuous
MC3 16 29.4 39 74.8 41.7
Tension wood variability in three cultivars 25
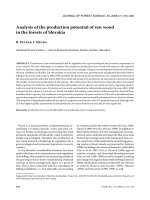
The macroscopic identification of TW was done by the naked eye
[3, 23, 28, 29]. It was performed by using the highest reflection of some
areas under a low-angle natural light (Fig. 2). These areas with a shiny
and silky appearance were composed of gelatinous fibres (TW). A
microscopic validation by 80 thin sections (15 µm thick) double
stained with safranine and astra blue, verified the relevancy of results
[3]. Figure 1B shows the TW distribution inside the stem and a clear
longitudinal continuity along several discs.
The height of the analysed stems was between 15–17.5 m, includ-
ing a “trunk zone” which corresponds to the pruned length, up to 8m
and the “crown zone” to the non-pruned length, and the total number
of discs and growth rings were 298 and 3801, respectively. Table II
sums up for each tree the number of growth units, discs, growth rings,
stem height and the position of the first green branch and dead branch
(pruned height). For each growth unit we sampled several discs, to cal-
culate the proportion of TW per growth unit and per growth ring. The
results presented in this paper were generally confirmed by statistical
analysis (SAS
®
GLM procedure) and the comparisons of means were
based on the Student-Newman-Keuls (SNK) test. Nevertheless, the
authors draw the attention of the reader to the risk of generalisation
of statistical results based on such a small number of trees.
3. RESULTS
3.1. Inter-clonal variability of tension wood
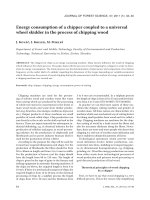
Figure 3 shows in a bar chart the mean values per cultivar
and for each of the nine trees analysed. The TW percentage var-
ied considerably between the different cultivars. Luisa Avanzo
Figure 1. Illustration of the three levels of shape analysis for poplar
tree I_3: (A) skeleton of the standing tree, (B) reconstruction of the
tree shape and of the sampled discs, (C) disc measurements: growth
rings and tension wood.
Figure 2. Tension wood areas from the cultivars MC viewed under
a low angle natural light.
Table II. Number of growth units, discs, growth rings and height analyzed. The height of the green branch (H1bg) and the height of the first
dead branch (H1bd) are also shown.
Clone Nb growth units Nb discs Nb growth rings Height (m) H1bg (m) H1bd (m)
I1 8 34 416 16.8 10.7 8
I2 8 32 425 15.5 11.4 9.1
I3 8 34 396 16.6 11.3 8.4
LA1 6 31 420 15.4 12.2 7.6
LA2 7 32 425 15.6 12.4 10.3
LA3 7 34 447 16.7 8.2 7.5
MC1 7 36 436 17.5 14.7 9
MC2 7 33 426 16.7 13.6 10.1
MC3 8 33 410 17.6 14.9 8.9
26 M.A. Badia et al.
and I214 presented a small proportion of TW, 7.6% and 8.2%
respectively, while it was much higher in I-MC cultivars
(15.3%). These substantial differences between cultivars cor-
roborate the observations carried out by other authors: Sacré
[31] observed in some 3-year-old stems, very strong differ-
ences between I214 (16%) and Robusta (40%); Leclercq [24]
classified ten other cultivars between 7 and 16 years of age, in
three levels: 8%, 15% and 40%.
The TW percentage obtained in our study for the I214 cul-
tivars was weaker than that reported by Sacré [31]. This differ-
ence can be explained by the age difference between the two
samples (3 and 16 years respectively). A comparison at equal
age (3 years) showed that I214 cultivars of our sampling had
an average proportion of TW equal to that observed by Sacré
(16.4% versus 16% in Sacré sampling). Concerning Luisa
Avanzo and I-MC cultivars, there is no data in the literature on
TW percentage. Considering our data, the differences between
the average TW percentages were statistically significant (p-
value > 0.0001) for the clone I-MC. LA and I214 cannot be dis-
tinguished except for some of the first growth units.
I-MC cultivars had the narrowest crown area (46.5 m
2
) and
the highest TW content. By contrast, Luiza Avanzo exhibited
a low TW percentage and large crown areas (69.5 m
2
). The I214
cultivar was between these two extremes. Because of the low
number of trees involved in our study, a negative correlation
between crown areas and TW percentage could not be estab-
lished, nevertheless these results are in agreement with the
observations made on the beech by Ferrand [17] and the Euro-
pean Project “Stress in Beech” [16]. However, they are in dis-
agreement with Berlyn [7], who found a weak but positive
relationship between crown projection area and tension wood
percentage in 84 Populus deltoides (Correlation Coefficient,
r = 0.19).
The mean local lean (Fig. 3B) shows that the straighter
cultivar was I-MC (3.4°), followed by Luisa Avanzo (4.1°) and
I214 (5.8°). This classification does not have a general
significance, considering that the strategy used for selecting the
trees was based on shape index. Compared to TW percentage
(Fig. 3A), the cultivars with the best tree morphology (I-MC)
presented the highest percentage of TW (15.3%). This result
underlines the importance of knowing the wood quality for
selection. In this case, morphological factors are not the best
criterion to take into account in poplar plantations in order to
produce wood with lower values of TW. Similar results have
often been observed by other authors in the genus Populus [19,
22, 23] Isebrands and Bensend [19] put forth the assumption
that the cambium of this species would be particularly sensitive
to the stimuli involved in the formation of TW.
3.2. Intra-tree variability of tension wood
3.2.1. Longitudinal distribution
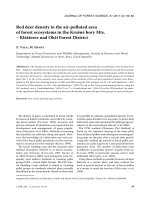
Figure 4 presents the longitudinal distribution of TW. One
tree per cultivar and per shape-index are illustrated: straight
I214, leaning Luisa Avanzo and flexuous I-MC. In addition to
TW distribution, a line was added to indicate the height position
for each branch measured in the field. In this way, we can see
the different behaviour of TW distribution between “trunk
zone” (pruned stem) and “crown zone”. In the “crown zone”,
the occurrence of TW was quite irregular. In the “trunk zone”,
TW percentage was rather continuous and regular except in the
bottom of the stem. In seven of the nine trees studied, the
percentage of TW at the bottom of the stem (below 50 cm) was
higher than in the discs located just above. The same
characteristic was observed by Washusen et al. [35] in 10–
11 year-old Eucalyptus globulus Labill. and by Jourez [21] and
Delavault et al. [15] in young stems of poplar and Eperua
falcata respectively. In six out of nine trees, if the first 50 cm
were not considered, the proportion of TW tended to increase
slightly with the height. In the litterature both situations have
been reported, TW increasing with the height in: poplar [19, 23,
Figure 3. Mean values per tree (bar height) and mean values per cultivar (number): (A) Tension wood percentage (%); (B) Local lean (°) and
(C) Crown projection area (m
2
). The shape-index correspond to: (1) straight tree; (2) leaning tree and (3) flexuous tree. The cultivars are abbre-
viated by: i_ for I214; la for Luisa Avanzo; mc for I-MC.
Tension wood variability in three cultivars 27
26, 32] or beech [13] and TW decreasing with height [21, 30,
34]. The different results from the literature would be explained
by the position of the samples analysed by the authors. In fact,
according to the position of the discs sampled, closer to the butt
portion of the tree or to the top, the trend could be reversed.
3.2.2. Radial distribution
Figure 5 illustrates the distribution of TW percentage observed
in each growth ring according to their radial position. The data
were divided per cultivar (I214, Luisa Avanzo and I-MC) and
per stem zone according to the longitudinal position of the discs
(“trunk zone” or “crown zone”). The plots coming from the
“trunk zone” and from any cultivar showed a clear bimodal dis-
tribution (two peaks). On the other hand, the discs sampled in
the “crown zone” did not follow a bimodal distribution. In fact,
this bimodality indicates that the phenomenon of TW appear-
ance is not homogenous during the tree growth and the obser-
vations result from two “overlapping” distributions. One is
composed by the first growth rings that are close to the pith and
the other one by the growth rings formed the last years of the
tree life, i.e. close to the bark.
In the first distribution, the high TW percentage decreases
strongly with the tree growth. This reduction in TW occurrence
could be linked to the increase of stiffness due to larger diam-
eter. This stage was called “establishment growth period”. The
proportion of TW reaches a minimum, which is, for the three
cultivars, situated in a similar radius between 90 and 100 mm.
Field observations showed that until this diameter (between 8
and 10 years) the trees were in open growth with no competition
for light. The second peak corresponds to the moment when
crowns begin to touch and interact, i.e. to the canopy closure.
If it is considered that following the canopy closure the photo-
tropic response of the trees forces them to increase their surface
exposed to the light, and thus to change the position of the
branches and even of the stem, this process must be inevitably
accompanied by a production of TW. This second growth stage
was called “competition growth period”. Coming back to the
“crown zone”, a radial decrease of TW percentage is visible
close to the pith especially for I214 and LA. The reasons of the
decrease had the same origin than in the “trunk zone”. The min-
imum value seems to be closest to the pith than in the trunk zone
as it could be expected according to the hypothesis of the coin-
cidence with canopy closure. The second peaks are less visible.
Several reasons could be put forward: the local distribution of
tension wood could be disturbed by branches at this level, and
there was not enough radial increment recording through TW
the change in competition.
This kind of radial reaction wood distribution has been
reported in several poplars and coniferous, and called “waves
of reaction wood” [8, 10, 15, 25, 27, 33]. The authors consider
that part of the first wave corresponds to the reorientation of
the stem and the second wave, elaborated in mature age, to the
stabilisation of the tree. In addition, these waves are explained
also by a thinning effect or by the death of the apical meristem.
However, the effet of the canopy closure in the production of
TW has never been observed before.
3.2.3. 2D Tension Wood map
Figure 6 shows in a 2D map the radial (growth rings) and
longitudinal (growth units) distribution of TW for the nine sam-
pled trees. The longitudinal data was limited in order to homog-
enize the nine pictures, we mapped for all trees up to the sixth
growth unit. The average of TW percentage was represented
in a grey scale where each step was 2.5%.
We can notice the longitudinal increase in TW between the
“trunk zone” (up to the fourth growth unit for Luisa Avanzo
and I-MC and fifth growth unit for I214) and the “crown zone”,
especially for the growth rings close to the pith. An ANOVA
was carried on this set of data for testing the effects of cultivar,
shape, and age from the pith for each growth unit. The statistical
analysis showed that the shape effect on TW percentage was
very significant for the first growth units (GU ≤ 4, p-value <
0.0001) and the degree of significance decreased towards the
crown (
p-value = 0.0209 for GU5, p-value = 0.5591 for GU6).
A variation of TW distribution was also observed in the radial
direction. We found that the bimodal distribution of TW was
clearer in the first growth units than in the crown. Regarding
the basal effect observed in Figure 4, it is not visible in Figure 6
because it is hidden by the average of several discs per growth
unit.
Figure 4. Height distribution of TW percentage for three trees: (A) straight I214; (B) leaning Luisa Avanzo and (C) flexuous I-MC. Each symbol
corresponds to a disc and the horizontal lines show the position of branches measured in standing trees.
28 M.A. Badia et al.
4. CONCLUSIONS
The main characteristics of I-MC cultivar were: strong api-
cal dominance, fast growth and very good morphological char-
acter. However, it had a proportion of TW (15.3%) higher than
the other clones which can result in many technological prob-
lems during the industrial wood processing [6]. Luisa Avanzo
and I214 produced only 7.6% and 8.2% of TW respectively, but
the main disadvantage of Luisa Avanzo is the huge quantity of
wetwood (up to 40%, [5]) and the flexuosity for I214.
Thus the choice of the cultivar to be planted cannot be only
based on morphological characters and fast growth, since wood
properties, like TW, associated to each cultivar are essential.
We have seen that the crown projection area could be a good
inter-cultivar indicator of TW occurrence. Cultivars with nar-
row crowns correspond to the trees with highest values of TW
and the widest crowns correspond to cultivars with the lowest
percentages of TW.
The spatial distribution of TW showed that it was located
predominantly below 30–50 cm. If this basal part is eliminated,
Figure 5. Radial distribution of tension wood per cultivar and stem zone. Each symbol represents the tension wood percentage observed in a
growth ring. The three shape-indices per cultivar are mapped in the same data set and divided according to their longitudinal position (“trunk
zone” or “crown zone”).
Tension wood variability in three cultivars 29
the production of TW increased slightly towards tree height.
This longitudinal distribution suggests that TW content estimated
through sampled cores taken below 50 cm in the stem lead to
overestimate the real proportion of TW in the whole stem.
In the pruned stem (up to 8 m), the radial distribution of the
percentage of TW (calculated per growth ring) presented a clear
bimodal structure. During the first peak, “establishment growth
period”, the trees were in open growth and the high proportion
of TW was probably due to a high sensitivity to environmental
stimuli as wind or non uniform crown development added to a
slight stiffness of the stem. During the first stages of the tree
growth, TW occurrence decreased strongly until the canopy
closure, which appeared when the trees were between 18 and
20 cm in diameter. After this event, the phototropic response
of the trees was inevitably accompanied by a major production
of TW, a stage called “competition growth period”.
Figure 6. Tension wood distribution for the nine poplars up to the sixth growth unit (UC) and for each growth ring. The grey level legend shows
the percentage of tension wood inside one growth ring and one growth unit.
30 M.A. Badia et al.
The effect of canopy closure on the distribution of TW shows
the relevance for the selection process of the plantation density,
which must be in accordance with the growth rate and
phototropic response of the different cultivars available.
REFERENCES
[1] Arganbright D.G., Bensend D.T., Relationship of gelatinous fiber
development to tree lean in soft maple, Wood Sci. 1 (1968) 37–40.
[2] Badia M., Modélisation de la distribution du bois de tension dans
une grume de peuplier à partir de l’empilement tridimensionnel des
cernes. Cas des cultivars I214, Luisa Avanzo et I-MC, Thèse de
doctorat en Sciences du Bois, ENGREF, 2003, p. 215.
[3] Badia M., Mothe F., Constant T., Nepveu G., Assessment of ten-
sion wood detection based on shiny appearance on three poplar cul-
tivars, Ann. For. Sci. 62 (2005) 43–49.
[4] Bamber R.K., A general theory for the origin of growth stresses in
reaction wood: how trees stay upright, IAWA J. 22 (2001) 205–212.
[5] Baonza V., Gutiérrez A., Variación de algunas características den-
drométricas y físicas, según su posición en el tronco. Caso de Popu-
lus × euramericana (Dode) Guinier cv. “LUISA AVANZO”, in:
Rivas M. (Ed.), II Congreso Forestal Español, Pamplona, 1997,
pp. 69–74.
[6] Baonza V., Gutiérrez A., Rendimiento y calidades de chapa en los
clones de chopo a diferentes alturas del fuste, Investig. Agrar. Sist.
Recur. For. 11 (2002) 311–323.
[7] Berlyn G.P., Factors affecting the incidence of reaction tissue in
Populus deltoides Bartr, IOWA State J. Sci. 35 (1961) 367–424.
[8] Boury S., Estimation quantitative de la répartition du bois de ten-
sion chez le peuplier (Populus × euramericana cv. I214) à partir de
l’hétérogénéité circonférencielle de la densité du bois, Internal
document Équipe Qualité des Bois du LERFoB, INRA-Nancy,
1993, p. 34.
[9] Cano-Capri J., Burkart L.F., Distribution of gelatinous fibers as
related to lean in southern red oak (Quercus falcata Michx.), Wood
Sci. 7 (1974) 135–136.
[10] Chanson B., Hétérogénéités angulaires des déformations de matu-
ration : Interprétation basée sur le concept de Plan d’Organisation
des Arbres, in: Thibaut B. (Ed.), IV
e
Séminaire Architecture, Struc-
ture, Mécanique de l’Arbre, LMGC, Université de Montpellier II,
Montpellier, 1992, pp. 121–131.
[11] Chantre G., Le bois de tension dans le genre Populus : effet clonal
à un stade juvénile ; conséquences d’une sélection précoce sur quel-
ques paramètres technologiques, in: Thibaut B. (Ed.), V
e
Séminaire
Architecture, Structure, Mécanique de l’Arbre, LMGC, Université
de Montpellier II, Montpellier, 1993, pp. 139–162.
[12] Clair B., Thibaut B., Shrinkage of the gelatinous layer of poplar and
beech tension wood, IAWA J. 22 (2001) 121–131.
[13] Clarke H., The distribution, structure, and properties of tension
wood in beech (Fagus sylvatica L.), J. For. XI (1937) 85–93.
[14] Constant T., Mothe F., Badia M., Saint-André L., How to relate the
standing tree shape to internal wood characteristics: Proposal of an
experimental method applied to poplar trees, Ann. For. Sci. 60
(2003) 371–378.
[15] Delavault O., Chanson B., Fournier M., Interprétation de la réparti-
tion longitudinale du bois de tension dans de jeunes tiges d’Eperua
falcata Aubl. (Caesalpiniaceae), in: Thibaut B. (Ed.), IV
e
Sémi-
naire Architecture, Structure, Mécanique de l’Arbre, LMGC, Uni-
versité de Montpellier II, Montpellier, 1992, pp. 66–83.
[16] EU-FAIR Project. Occurrence and Relevance of Growth Stresses in
Beech (Fagus sylvatica L.) in Central Europe, Institut für Fost-
benutzung und Forstliche Arbeitswissenschaft Albert-Ludwigs-
Universität Freiburg (Germany), 2002, p. 323.
[17] Ferrand J.C., Étude des contraintes de croissance. Deuxième partie:
variabilité en forêt des contraintes de croissance du hêtre (Fagus
sylvatica L.), Ann. Sci. For. 39 (1982) 187–217.
[18] Grzeskowiak V., Sassus F., Fournier M., Coloration macroscopi-
que, retraits longitudinaux de maturation et de séchage du bois de
tension du peuplier (Populus × euramericana cv. I214), Ann. Sci.
For. 53 (1996) 1083–1097.
[19] Isebrands J.G., Bensend D.W., Incidence and structure of
gelatinous fibers within rapid-growing Eastern Cottonwood, Wood
Fiber 4 (1972) 61–71.
[20] Jourez B., Technique de détection du bois de tension du peuplier sur
échantillon massif, in: Thibaut B. (Ed.), V
e
Séminaire Architecture,
Structure, Mécanique de l’Arbre, LMGC, Université de Montpel-
lier II, Montpellier, 1993, pp. 121–137.
[21] Jourez B., Distribution and quantification of tension wood in poplar
shoots, in: IPC (Ed.), 20th International Poplar Commission, Buda-
pest, Hungary, 1996, pp. 1–7.
[22] Kaeiser M., Boyce S.G., The relationship of gelatinous fibers to
wood structure in eastern cottonwood (Populus deltoides), Am. J.
Bot. 52 (1965) 711–715.
[23] Kroll R.E., Ritter D.C., Gertjejansen R.O., Au K.C., Anatomical
and physical properties of balsam poplar (Populus balsamifera L.)
in Minnesota, Wood Fiber Sci. 24 (1992) 13–24.
[24] Leclercq A., La qualité du bois de quelques nouveaux cultivars bel-
ges de peuplier, Document interne Station de Technologie Fores-
tière de Gembloux, 1989, p. 19.
[25] Loup C., Relations entre Architecture, Mécanique et Anatomie de
l’arbre: Cas d’un pin maritime (Pinus pinaster Soland), in: Thibaut
B. (Ed.), II
e
Séminaire Architecture, Structure, Mécanique de
l’Arbre, LMGC, Université de Montpellier II, pp. 55–68.
[26] Müller-Stoll W.R., Zenker R., Abbau der Wandsubstanz von
Zugholzfasern der Pappel durch holzzerstorende Pilze und die
Besonderheiten der G-Schicht, Drevarsky Vyskum 110 (1986) 1–12.
[27] Radi M., Castéra P., Qualification de la forme de deux pins mariti-
mes en liaison avec la structure de leur bois, Ann. Sci. For. 49
(1992) 185–200.
[28] Ritter D.C., Kroll R.E., Gertjejansen R.O., Zones of gelatinous
fibers in Populus balsamifera, Wood Fiber Sci. 25 (1993) 198–208.
[29] Sacré E., Le bois de tension des peupliers, Bull. Inst. Agron. Stat.
Rech. Gembloux XXVII (1959) 435–444.
[30] Sacré E., Étude du bois des peupliers euraméricains d’origine belge
et étrangère, Revue Agricole 4 (1964) 531–534.
[31] Sacré E., Proportion de faux cœur et de bois de tension dans les peu-
pliers « Robusta » élagués et non élagués, Document Station de
Technologie Forestière, Gembloux, 1974, p. 6.
[32] Sacré E., Caractéristiques anatomiques et physiques du bois des
peupliers “I. 214”, “robusta” and “gelrica” aux stades précoce et
adulte, Bull. Soc. Roy. For. Belg. 84 (1977) 321–338.
[33] Thomas R., Analyse des formes de troncs par photogrammétrie
pour caractériser la qualité des bois. Application au pin sylvestre de
Lozère, Thèse de doctorat en Sciences du Bois, ENGREF, 2000,
p. 204.
[34] Washusen R., Tension wood occurrence in Eucalyptus globulus
Labill. II. The spatial distribution of tension wood and its associa-
tion with stem form, Aust. For. 65 (2002) 127–134.
[35] Washusen R., Ilic J., Waugh G., The relationship between
longitudinal growth strain, tree form and tension wood at the stem
periphery of ten-to eleven-year-old Eucalyptus globulus Labill.,
Holzforschung 57 (2002) 308–316.
[36] Wilson B.F., Response to stem bending in forest shrubs: stem or
shoot reorientation and shoot release, Can. J. Bot. 75 (1997) 1643–
1648.
[37] Wilson B.F., Gartner B.L., Lean in red alder (Alnus rubra): growth
stress, tension wood, and righting response, Can. J. For. Res. 26
(1996) 1951–1956.