Báo cáo lâm nghiệp: "Classifying xylophone bar materials by perceptual, signal processing and wood anatomy analysis" pdf
Bạn đang xem bản rút gọn của tài liệu. Xem và tải ngay bản đầy đủ của tài liệu tại đây (558.49 KB, 9 trang )
73
Ann. For. Sci. 63 (2006) 73–81
© INRA, EDP Sciences, 2006
DOI: 10.1051/forest:2005099
Original article
Classifying xylophone bar materials by perceptual, signal processing
and wood anatomy analysis
Loïc BRANCHERIAU
a
*, Henri BAILLÈRES
a
, Pierre DÉTIENNE
a
, Richard KRONLAND
b
, Bloen METZGER
b
a
CIRAD - Forêt, TA10/16, avenue Agropolis, 34398 Montpellier Cedex 5, France
b
CNRS – LMA, 31 chemin Joseph-Aiguier, 13402 Marseille Cedex 20, France
(Received 10 December 2004; accepted 18 May 2005)
Abstract – Several different areas of expertise are required to analyse the acoustic qualities of wood. The practical experience of musical
instrument makers is extremely valuable, especially with respect to selecting the most suitable wood species for different applications.
Knowledge on the mechanics and anatomy of wood is also essential to determine the factors underlying the acoustic qualities of woods. In
addition, music synthesis research on psychoacoustic issues can highlight perceptual attributes that account for the acoustic qualities of different
woods. The present study was focused on 58 tropical wood species used in xylophone-type percussion instruments. Each wood was classified
by an xylophone maker and on the basis of an analysis of radiated sound signals and these separate classifications were compared with the aim
of determining key signal parameters that have an impact on the acoustic quality of wood. Relationships between perceptual classifications,
signal parameters and wood anatomical characteristics were analyzed.
wood musical quality / acoustic properties / vibration / wood anatomy
Résumé – Classifications de lames de xylophone par analyse perceptive, traitement du signal et anatomie des bois. Le bois est un matériau
essentiel pour la fabrication de nombreux instruments de musique. En évaluer les qualités acoustiques relève de la mise en commun de plusieurs
domaines de compétence. D’une part, les luthiers apportent un savoir empirique très précieux qui permet le choix des meilleures essences.
D’autre part, les connaissances en mécanique et en anatomie du bois permettent une meilleure compréhension de l’origine de ces qualités.
Parallèlement, les recherches en synthèse musicale associées aux problématiques de la psychoacoustique donnent un éclairage sur les attributs
perceptifs à l’origine de la qualité acoustique d’une essence. L’étude porte sur une soixantaine d’essences tropicales et se limite aux instruments
percussifs de type xylophone. Deux classifications sont réalisées et mises en parallèle, celle du luthier et celle donnée par l’analyse des signaux
sonores rayonnés, dans le but d’identifier les paramètres déterminants du signal du point de vue de la qualité acoustique du matériau. Les
relations entre une classification perceptive, les paramètres du signal, et des caractéristiques anatomiques sont analysées. Elles permettent de
mettre en évidence des critères objectifs et pertinents utilisables pour évaluer la qualité des bois de lutherie.
qualité musicale du bois / propriété acoustique / vibration / anatomie du bois
1. INTRODUCTION
Wood is used in making many musical instruments because
of the indispensable physical and mechanical properties of this
material. The sound quality of wood is perceptually assessed
by musical instrument makers and musicians. Analyzing the
acoustic qualities of wood is highly complex, and this issue has
only been partially dealt with to date. Holz [7] focused on key
qualities of wood used for making xylophone bars and pro-
posed a map of around 20 species classified on the basis of their
modulus of elasticity, density and damping features. Ono and
Norimoto [15] demonstrated that samples of spruce wood
(Picea excelsa, P. glehnii, P. sitchensis) – which is considered
to be a suitable material for soundboards – all had a high sound
velocity and low longitudinal damping coefficient as compared
to other softwoods. The cell-wall structure could account for
this phenomenon. Internal friction and the longitudinal modu-
lus of elasticity are markedly affected by the microfibril angle
in the S2 tracheid cell layer, but this general trend does not apply
to all species. For instance, pernambuco (Guilandina echinata
Spreng.), which is traditionally used for making violin bows,
has an exceptionally low damping coefficient relative to other
hardwoods and softwoods with the same specific modulus [10,
21]. This feature has been explained by the abundance of
extractives in this species [11]. Obataya et al. [14] confirmed
the importance of extractives for the rigidity and damping qual-
ities of reed materials. Matsunaga et al. [12] reduced the damp-
ing coefficient of spruce wood by impregnating samples with
extractives of pernambuco (Guilandina echinata Spreng.).
It is essential to know what musical instrument or compo-
nent is involved when assessing the “acoustic quality” of a
* Corresponding author:
Article published by EDP Sciences and available at or />74 L. Brancheriau et al.
wood specimen. Our scientific study was thus designed to gain
further insight into the relationship between the physical prop-
erties, anatomical characteristics and the perceptual classifica-
tion of woods to be used in xylophone and marimba type
percussion instruments. Hence, a xylophone maker perceptu-
ally classified 58 tropical wood species and, based on this clas-
sification, key signal parameters pertaining to the acoustic
quality of the material were identified. These parameters were
then correlated with the physical and anatomical properties of
each wood. Finally, we propose a nondestructive method for
assessing the quality of woods earmarked for making musical
instruments.
2. MATERIALS AND METHODS
The study focused on 58 tropical wood species belonging to the
tropical wood collection of CIRAD (Tab. I). They were selected in
order to cover a wide range of density going from 206 to 1277 kg/m
3
.
The xylophone maker recommended the following test sample dimen-
sions: 350 mm long, 45 mm wide, 20 mm thick, which was in line with
the rough size of the samples and sawing constraints. When possible,
the specimens were prismatic, straight grained, knot-free, and without
defects. The specimens were cut to minimize the curve of the growth
rings, with the ring parallel to the tangential grain of the wood. The
longitudinal direction was colinear to the longitudinal axis of the spec-
imens. The specimens were stabilized in a climatic chamber at 65%
ambient humidity and 20 °C ambient temperature, with a theoretical
wood moisture content of 12% at equilibrium.
2.1. Classification test of the xylophone maker
The acoustic space, minus the pitch (mainly linked to frequency),
loudness (intensity) and duration, is called the “timbre”. Any dimen-
sion can be assessed on the basis of perceptual features (as in the
present case), described on the basis of semantic attributes, or acoustic
features and thus quantified according to signal parameters or
“descriptors”, or physical features whereby sound source properties
are used to describe sound. The differential semantic approach was
described by Bismarck [1], a method that involves assessing a set of
sounds on digital scales. Grey contributed to the analysis of timbre by
using multidimensional statistical analysis methods [6]. In most mul-
tidimensional analyses of timbre, the spectral center of gravity and
acoustic “assault” (rise time) are the main dimensions of the perceptual
space [13]. The third dimension seems to be less stable and varies
between studies. Note that these studies were conducted on a broad
range of instruments with resonating structures (tubes, balls, strings,
etc.) and different excitation modes (rubbing, plucking and percus-
sion).
A xylophone maker conducted a first classification with the wood
specimens at hand (multisensory classification) and then, secondly,
indirectly on the basis of recorded sounds (acoustic classification). The
xylophone maker had access to the wood specimens for 1 week for
the multisensory classification. A computer interface was designed for
the acoustic classification. All sounds, represented by identical icons,
were randomly distributed on the computer screen. The xylophone
maker could click on an icon to listen to a sound as many times as he
wished, and then he classified the sounds by sorting the icons in order
of acoustic quality on the screen. The classification method was
described by Bismarck [1], with the wood specimens classified in
terms of their “musical suitability” for xylophone bar material.
2.2. Dynamic test
2.2.1. Test procedure
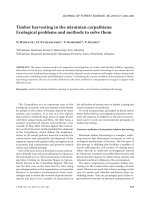
The system for measuring the acoustic signal radiated via the wood
specimens was designed to obtain an accurate analysis of the mechan-
ical and acoustic properties of the material, while also enabling the
xylophone maker to classify the species (Fig. 1). It was thus important
to conduct the analyses in conditions resembling those in which a
musician would play a xylophone. The prismatic-shaped wood sam-
ples were set on two elastic supports with a very low vibration fre-
quency (< 10 Hz). A pendulum, consisting of a nylon cord (30 cm
long) and a metal ball (14 mm diameter, 12 g weight), was set in motion
to trigger a vibration in the wood specimen by hitting the end with the
metal ball. An omnidirectional microphone was placed at the other end
to measure the acoustic pressure radiated at impact.
The data acquisition system included a NEUMAN KM183 MT
microphone, a DIGIDESIGN 001 converter (48 kHz sampling fre-
quency, 16 bit resolution) and the PROTOOLS software package. The
sounds were produced and recorded in an anechoic room (70 Hz cutoff
frequency). The test table was covered entirely with an absorbent
material (melamine).
2.2.2. Signal processing
Sound signal “descriptor” parameters were used within the fre-
quency space in the first approach which was designed to accurately
analyze the timbre of the tested wood samples. The Spectral Center
of Gravity (SCG) was thus determined (1), along with the Spectral
Range (SR) (2) and the harmonicity factor (HF) (3).
(1)
where A
i
is the modulus of the discrete Fourier transform at
frequency f
i
.
(2)
.
(3)
Figure 1. Experimental set up for acoustic radiation measurements
(
α
= 30°, d
i
= 1.5 cm, d
m
= 2.5 cm).
SCG
A
i
f
i
i 1=
N
∑
A
i
i 1=
N
∑
=
SR
A
i
f
i
SCG–()
2
i 1=
N
∑
A
i
i 1=
N
∑
=
HF i()
resonance frequency of rank i
fundamental frequency
i–=
Classifications of xylophone bar materials 75
Table I. List of wood species.
Database No. Botanical name Country Density (kg/m
3
)
4271 Scottellia klaineana Pierre Côte d'Ivoire 629
5329 Ongokea gore Pierre Congo 842
6704 Humbertia madagascariensis Lamk. Madagascar 1234
6779 Ocotea rubra Mez French Guiana 623
6966 Khaya grandifoliola C.DC. Côte d'Ivoire 646
7021 Khaya senegalensis A.Juss. Burkina Faso 792
7299 Coula edulis Baill. Cameroon 1048
11136 Tarrietia javanica Bl. Cambodia 780
13293 Entandrophragma cylindricum Sprague Côte d'Ivoire 734
14233 Afzelia pachyloba Harms Cameroon 742
14440 Swietenia macrophylla King Martinique 571
14814 Aucoumea klaineana Pierre Congo 399
15366 Humbertia madagascariensis Lamk. Madagascar 1277
15377 Faucherea thouvenotii H.Lec. Madagascar 1061
15717 Ceiba pentandra Gaertn. Côte d'Ivoire 299
16001 Letestua durissima H.Lec. Congo 1046
16084 Monopetalanthus heitzii Pellegr. Gabon 466
16136 Commiphora sp. Madagascar 390
16211 Dalbergia sp. Madagascar 916
16624 Hymenolobium sp. French Guiana 600
16627 Pseudopiptadenia suaveolens Brenan French Guiana 875
16641 Parkia nitida Miq. French Guiana 232
16664 Bagassa guianensis Aubl. French Guiana 1076
16725 Discoglypremna caloneura Prain Gabon 406
16790 Faucherea parvifolia H.Lec. Madagascar 853
16796 Brachylaena ramiflora Humbert Madagascar 866
17431 Simarouba amara Aubl. French Guiana 455
18077 Gossweilerodendron balsamiferum Harms Gabon 460
18127 Manilkara mabokeensis Aubrev. Central African R. 944
18283 Shorea-rubro squamata Dyer Philippine 569
18284 Autranella congolensis A.Chev. Central African R. 956
18412 Entandrophragma angolense C.DC. Congo 473
18752 Distemonanthus benthamianus Baill. Cameroon 779
19041 Terminalia superba Engl. & Diels Cameroon 583
20030 Nesogordonia papaverifera R.Cap. Côte d'Ivoire 768
20049 Albizia ferruginea Benth. Côte d'Ivoire 646
20982 Gymnostemon zaizou Aubrev. & Pellegr. Côte d'Ivoire 380
21057 Anthonotha fragrans Exell & Hillcoat Côte d'Ivoire 777
24440 Piptadeniastrum africanum Brenan Côte d'Ivoire 975
25971 Guibourtia ehie J.Leon. Côte d'Ivoire 783
26439 Manilkara huberi Standl. Brazil 1096
27319 Pometia pinnata Forst. Salomon Islands 713
27588 Glycydendron amazonicum Ducke French Guiana 627
28071 Cunonia austrocaledonica Brong. & Gris. New Caledonia 621
28082 Nothofagus aequilateralis Steen. New Caledonia 1100
28086 Schefflera gabriellae Baill. New Caledonia 570
28089 Gymnostoma nodiflorum Johnst. New Caledonia 1189
28099 Dysoxylum sp. New Caledonia 977
28100 Calophyllum caledonicum Vieill. New Caledonia 789
28102 Gyrocarpus americanus Jacq. New Caledonia 206
28103 Pyriluma sphaerocarpum Aubrev. New Caledonia 793
28163 Cedrela odorata L. Guadeloupe 512
29468 Moronobea coccinea Aubl. French Guiana 953
29503 Goupia glabra Aubl. Brazil 885
29509 Manilkara huberi Standl. Brazil 1187
30231 Micropholis venulosa Pierre French Guiana 665
30258 Cedrelinga catenaeformis Ducke Brazil 490
30679 Vouacapoua americana Aubl. French Guiana 882
76 L. Brancheriau et al.
In the second approach, the sound signal “descriptor” parameters
were used in the temporal space. The parametric method of Steiglitz-
McBride [20] was used to simultaneously determine the amplitude
β
i
and the temporal damping
α
i
associated with the resonance frequency (4).
In the equation (4), the summation was limited to the first three reso-
nance frequencies because of the frequency contents of measured sig-
nals (excitation of specimens by a finite impulse which acts as a low
pass filter in addition with the damping properties of wood material).
(4)
where s is the radiated signal as a function of time t, f
i
is the resonance
frequency of the order i and ϕ
i
is the phase shift. Amongst the temporal
descriptors, dissipation in wood material under longitudinal or trans-
verse vibration conditions is usually characterized by a logarithmic
decrement calculation [2, 16, 19]. This value, relative to a free-free
vibration frequency of the material, can be used through a generaliza-
tion of the vibrational response of a dissipative system at one degree
of freedom (5) and via complex dissipative systems [17].
(5)
when the damping rate
λ
i
is much lower than 1, the logarithmic dec-
rement
δ
Log(i)
is proportional to the damping rate [2]. The damping
rate and logarithmic decrement are thus linked by the following rela-
tion (6):
.(6)
Logarithmic decrement studies have been carried out notably by
Kollmann [8], Bordonné [2] and Holz [7] among others. A lack of rela-
tionship between the density and the logarithmic decrement
δ
Log(i)
was experimentally noted by Kollmann [8] in oak and spruce, and by
Bordonné [2] in tropical species. However, Bordonné [2] observed a
regular increase in the logarithmic decrement with the associated fre-
quency in kaori, which is a softwood. This trend was also noted by
Holz [7] in spruce.
Temporal descriptors, along with associated vibrational frequen-
cies, of a dynamic dissipation phenomenon in a material are all equiv-
alent, but it is important to specify the equations that link these
different parameters. Equation (6) establishes the first linkage. For
additive synthesis of a real signal, the signal must be composed of a
sum of exponentially damped sinusoids (4). The combined use of addi-
tive synthesis models and waveguide synthesis can highlight relation-
ships between different signal damping, damping rate
λ
i
, temporal
damping
α
i
, and internal friction tan
δ
i
quantitative values associated
with the complex modulus concept [18] with respect to transverse
vibrations [3]:
(7)
.(8)
In the third approach, the signal was used to determine the mechan-
ical parameters of the material [5, 9]. The longitudinal modulus of elas-
ticity and the transverse shear modulus can be calculated when the
geometry and mass of the test samples are known [4].
3. RESULTS AND DISCUSSION
3.1. Acoustic and multisensory classifications
of the xylophone maker
The acoustic and multisensory classification results are
given in Tables II and III. The classifications are linear – graded
from best to worst – with the results separated in three separate
groups, i.e. good, medium and poor. The xylophone maker
detected eight odd samples due to defects or cutting problems
(Tab. III). These odd samples were excluded from the analyses.
During the multisensory classification, the xylophone maker
separated the low and high density woods (Tab. III). The light
woods had some defects that would hamper their professional
use, i.e. fragility, instability and lack of acoustic power. How-
ever, these two categories were not differentiated in the acous-
tic classification (Tab. II). The density was not reflected in the
acoustic information. The two classifications were still coher-
ent since the very good and very poor acoustic quality samples
were properly positioned at the extremes in the two tables
(Tabs. II and III). In the qualitative classification, the acoustic
information thus took precedence over the esthetic and textural
features.
Table II. Xylophone maker’s acoustic classification (best quality: 16211, worst quality: 16790).
Good Medium Poor
Quality 1 2 3 4 5 6 7 8 9
1 16211
Dalb. sp.
15366
Humb. m.L.
16084
Mono. h.P.
30231
Micr. v.P.
15377
Fauc. t.H.L.
14814
Auco. k.P.
5329
Ongo. g.P.
7299
Coul. e.B.
29503
Goup. g.A.
2 16624
Hyme. sp.
30258
Cedr. c.D.
24440
Pipt. a.B.
28163
Cedr. o.L.
6779
Ocot. r.M.
20982
Gymn. z.A.P.
18127
Mani. m.A.
15717
Ceib. p.G.
18284
Autr. c.A.C.
3 16136
Comm. sp.
27588
Glyc. a.D.
6704
Humb. m.L.
18412
Enta. a.C.
7021
Khay. s.A.J.
13293
Enta. c.S.
28102
Gyro. a.J.
18077
Goss. b.H.
16725
Disc. c.P.
4 28100
Calo. c.V.
28099
Dyso. sp.
6966
Khay. g.C.
20049
Albi. f.B.
30679
Vou a . a. A.
28071
Cuno. a.B.G.
28086
Sche. g.B.
26439
Mani. h.S.
16790
Fauc. p.H.L.
5 14440
Swie. m.K.
29468
Moro. c.A.
16664
Baga. g.A.
16641
Park. n.M.
27319
Pome. p.F.
29509
Mani. h.S.
20030
Neso. p.R.C.
28082
Noth. a.S.
6 16627
Pseu. s. B.
14233
Afze. p.H.
18283
Shor. s.D.
19041
Term. s.E.D
4271
Scot. k.P.
25971
Guib. e.J.L.
28103
Pyri. s.A.
7 17431
Sima. a. A.
11136
Tar r. j.Bl.
18752
Dist. b.B.
16796
Brac. r.H.
21057
Anth. f.E.H.
16001
Lete. d.H.L.
28089
Gymn. n.J.
st()
β
i
α
i
t–()2πf
i
t ϕ
i
+()sinexp
i 1=
3
∑
≈
st()
β
i
λ
i
2πf
i
t–()2πf
i
1
λ
i
2
–()t ϕ
i
+()sinexp
i 1=
3
∑
≈
δ
Log i()
2π
λ
i
≈
α
i
2π
λ
i
f
i
=
α
i
π
2
f
i
δ
i
tan=
Classifications of xylophone bar materials 77
3.2. Comparison of the acoustic classification
and the signal processing analysis results
The number of samples analysed was reduced to 50 after the
8 odd samples were eliminated from the initial batch. The
14 parameters derived from the sound signal analysis are presented
in Table IV. The aim here was to identify parameters that would
best account for the xylophone maker’s acoustic classification.
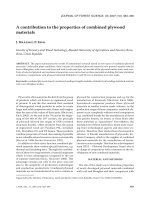
The bivariate correlation matrix (Fig. 2) calculated on the
basis of the 14 characteristic parameters revealed close colin-
earity between these parameters. A principal component anal-
ysis was thus conducted. This analysis generated a new set of
parameters derived from the original set in which the new
parameters (principal components) were not correlated and
closely represented the variability of the original set. Table V
shows that five principal components accounted for 94% of all
information contained in the 14 original parameters.
A hierarchical cluster analysis was performed on the basis
of the principal components, such that: (a) the measurement of
similarities between studied individuals is a distance measure-
ment, (b) the distance measurement is the Euclidian distance
calculated in the orthogonal space formed by the five standard
principal components, and (c) the agglomeration method uses
the mean distance between groups.
The resulting tree diagram highlighted three groups, called
G1, G2 and G3. The composition of these groups was compared
to that of the three groups derived from the xylophone maker’s
acoustic classification on the basis of the contingency table
(Tab. VI). This table indicates differences between the acoustic
and hierarchical classifications. Two different hypotheses
Table III. Xylophone maker’s multisensory classification (best quality: 16211, worst quality: 7299). Odd samples were not taken into account
in further analyses.
Quality
Medium or high density (from 600 to 1277 kg/m
3
)
Good Medium Poor
12 34 5 6
1 16211
Dalb. sp.
15366
Humb. m.L.
18752
Dist. b.B.
25971
Guib. e.J.L.
7021
Khay. s.A.J.
29509
Mani. h.S.
2 16624
Hyme. sp.
24440
Pipt. a.B.
27588
Glyc. a.D.
6966
Khay. g.C.
28071
Cuno. a.B.G.
30679
Vou a . a. A.
3 28100
Calo. c.V.
11136
Tar r. j .Bl.
6704
Humb. m.L.
6779
Ocot. r.M.
5329
Ongo. g.P.
4 14233
Afze. p.H.
16796
Brac. r.H.
18283
Shor. s.D.
15377
Fauc. t.H.L.
7299
Coul. e.B.
5 28099
Dyso. sp.
16664
Baga. g.A.
20049
Albi. f.B.
18127
Mani. m.A.
6 16627
Pseu. s. B.
4271
Scot. k.P.
20030
Neso. p.R.C
16001
Lete. d.H.L.
7 29468
Moro. c.A.
21057
Anth. f.
E.H.
27319
Pome. p.F.
28103
Pyri. s.A.
Quality
Low density (from 206 to 600 kg/m
3
)
Odd samples
Good Medium
12 34
1 16136
Comm. sp.
28163
Cedr. o.L.
18077
Goss. b.H.
14814
Auco. k.P.
28089
Gymn. n.J.
2 30231
Micr. v.P.
16084
Mono. h.P.
28102
Gyro. a.J.
28082
Noth. a.S.
3 14440
Swie. m.K.
28086
Sche. g.B.
20982
Gymn. z.A.P.
13293
Enta. c.S.
4 18412
Enta. a.C.
15717
Ceib. p.G.
26439
Mani. h.S.
5 30258
Cedr. c.D.
16725
Disc. c.P.
16790
Fauc. p.H.L.
6 19041
Term. s.E.D.
16641
Park. n.M.
18284
Autr. c.A.C.
7 17431
Sima. a. A.
29503
Goup. g.A.
78 L. Brancheriau et al.
might explain this lack of fit, i.e. either (1) the xylophone maker
based his classification on information other than that con-
tained in the parameters used, or (2) he only used part of the
information of parameters derived from the sound signal analysis.
A partial least-squares regression model was used to deter-
mine whether either of these hypotheses applied. By this regres-
sion method, a multiple linear regression is performed on a new
set of variables (latent variables) assembled by taking the var-
iability in the original set as well as the variability in the target
set (here the xylophone maker’s acoustic classification) into
account [22]. A unitary distance between two samples in the
acoustic classification was arbitrarily attributed in order to
make the acoustic classification variable quantitative.
The partial least squares regression obtained was highly sig-
nificant (R
2
= 0.74, Tab. VII). The two latent variables that best
accounted for the xylophone maker’s classification pooled an
equal share of the experimental information (around 20% per
variable). However, the first latent variable accounted for a
major part (58%, Tab. VII) of the variability noted in the xylo-
phone maker’s acoustic classification.
Figure 3 shows that the first latent variable pooled information
contained in the temporal damping variables (Nos. 13 and 14,
Tab. IV), which were closely correlated (Fig. 2). The second
Table IV. Characteristic parameters computed from dynamic test
results.
No. Characteristic parameters
1 Density
2 Longitudinal modulus of elasticity (E
L
)
3 Shear modulus (G
TL
)
4 Ratio: modulus of elasticity/density
5 Ratio: shear modulus/density
6 Rank 1 vibration frequency (fundamental)
7 Rank 2 vibration frequency (1st harmonic)
8 Harmonicity factor (HF)
9 Spectral center of gravity (SCG)
10 Spectral range (SR)
11 Fundamental amplitude (β
1
)
12 1st harmonic amplitude (β
2
)
13 Fundamental damping coefficient (α
1
)
14 1st harmonic damping coefficient (α
2
)
1
Figure available in colour at www.edpsciences.org/forest
Figure 2. Absolute bivariate correlation coefficients for characteristic
parameters
1
.
Table V. Total variance explained by principal components.
No. PC % of variance % Cumulative
13535
22661
31576
41086
5894
Table VI. Comparison of acoustic classification and hierarchical
clustering performed on principal components (contingency table).
Size of group G1 G2 G3
Good 3 4 0
Medium 7 16 3
Poor 4 7 6
Table VII. Total variance explained by latent variables (NIPALS
algorithm).
Latent
variable
Characteristics
parameters
Acoustic
classification
% of
variance
%
cumulative
% of
variance
%
cumulative
120205858
219391674
Figure 3. Bilateral regression coefficients for variables and latent
variable 1.
Classifications of xylophone bar materials 79
latent variable pooled information of variables No. 1, 9, 10 and
11 (Fig. 4). The fundamental frequency amplitude was the orig-
inal variable best represented by this latent variable (No. 11,
Tab. IV). The other original variables (Nos. 1, 9 and 10) were
represented by this latent variable because of their close corre-
lation with variable No. 11 (Fig. 4). The xylophone maker’s
choices were thus mainly influenced by temporal damping of
the fundamental frequency, and to a lesser extent by the ampli-
tude of this frequency.
Note that the classified samples were not musically tuned.
Between-specimen differences in pitch hampered clear com-
parisons between species. This could account for the absence
of frequency descriptor in the explanation of the xylophone
maker’s choices.
3.3. Acoustic classification and wood anatomy
The study of the relationship between the qualitative classi-
fication and anatomical structure of the wood specimens was
focused on species ranked at both extremes of the classification.
The discussion is thus mainly hinged on the seven species clas-
sified as “good” and the seven species classified as “poor” in
both the acoustic and multisensory classifications (Tab. VIII).
3.3.1. Vessel elements
All tested specimens were tropical woods, so there was very
little variation in the vessel diameters within each annual
growth ring, except for the Dalbergia from Madagascar which
showed clear semi-ring-porous areas. The mean tangential
diameter ranged from 140 to 280 µm in all of the good acoustic
woods and from 60 to 160 µm in the poor acoustic woods. The
vessel frequency/mm
2
ranged from 2 to 8 (up to 18 in Commi-
phora) in the “good” specimens, and from 7 (4 in Letestua) to
20 (50 in Cunonia) in the “poor” specimens. The vessels were
solitary and in radial multiples of 2 to 4 in most of the woods,
but they were exclusively solitary in Cunonia and Ongokea
(poor acoustics) and in Calophyllum (good acoustics), whereas
they were commonly in radial multiples of 4 and more in Letestua
and Pyriluma (poor acoustics) and Hymenolobium (good
acoustics). They were generally diffuse but with a tendency to
be arranged radially in Letestua, Manilkara and Pyriluma (typ-
ical feature of woods belonging to the Sapotaceae family).
3.3.2. Axial parenchyma
The axial parenchyma was found to be mainly paratracheal
in the good acoustic woods, ranging from scanty paratracheal
(Calophyllum, Commiphora and Swietenia) or lozenge-aliform
– (Dalbergia, Pseudopiptadenia and Simarouba) to highly abun-
dant and very confluent, forming wide bands linking vessels
(Hymenolobium). Only Calophyllum and Swietenia had an
apotracheal parenchyma, i.e. the first in the form of a few short
to long bands, and the latter in marginal bands. All wood spec-
imens with poor acoustics had an apotracheal parenchyma, i.e.
abundant diffuse-in-aggregates parenchyma (Coula, Cunonia,
Ongokea and Pyriluma) or with many tangential narrow bands
(Letestua and Manilkara).
3.3.3. Rays
In the good acoustic woods the rays frequency ranged from
4 to 9/mm. The rays were 1-3- to 4-seriate (15–55 µm wide)
and 180–500 µm high. Their structure was homogeneous or
subhomogeneous, i.e. composed only of procumbent cells or
procumbent cells with one row of square marginal cells. In the
poor acoustic woods the rays frequency ranged from 9 to 16/mm.
The rays were 2-4- to 5-seriate (20–50 µm wide) and 400–1000 µm
high. Their structure was heterogeneous, i.e. procumbent cells
in the body with several rows of square and/or upright marginal
cells.
3.3.4. Fibres
The wood fibres in specimens with good acoustics were rel-
atively short, i.e. from 900 µm (Dalbergia) to 1300 µm (Swi-
etenia) long, and up to 2000 µm in Hymenolobium, wide from
19 µm (Pseudopiptadenia) to 36 µm (Commiphora
), with a
lumen diameter ranging from 9 µm (Pseudopiptadenia) to
28 µm (Commiphora). Fibres in the poor acoustic woods were
1300 µm (Ongokea) to 2000 µm (Coula) long, and 20 µm
(Manilkara) to 34 µm (Ongokea) wide, with a lumen diameter
Figure 4. Bilateral regression coefficients for variables and latent
variable 2.
Table VIII. Species with the best and worst acoustic qualities which
were classified identically in the acoustic and multisensory tests.
Good acoustic quality Poor acoustic quality
Dalbergia sp. Coula edulis Baill.
Hymenolobium sp. Ongokea gore Pierre
Commiphora sp. Manilkara huberi Standl.
Calophyllum caledonicum Vieill. Pyriluma sphaerocarpum Aubrev.
Swietenia macrophylla King Letestua durissima H.Lec.
Pseudopiptadenia suaveolens
Brenan
Manilkara mabokeensis Aubrev.
Simarouba amara Aubl. Cunonia austrocaledonica Brong.
& Gris.
80 L. Brancheriau et al.
of less than 10 µm. All woods with good acoustics had libriform
fibres (simple pits), whereas those with poor acoustics had
either libriform fibres (Letestua, Manilkara and Pyriluma) or
fibre-tracheids (bordered pits), e.g. Coula, Cunonia and
Ongokea.
3.3.5. Storied structure
All poor acoustic woods as well as three with good acoustics
(Calophyllum, Commiphora and Pseudopiptadenia) did not
show a storied structure. However, all the axial elements and
the rays have a clearly defined horizontal storied pattern in Dal-
bergia and Hymenolobium, with a relatively storied pattern in
Simarouba and Swietenia.
3.3.6. Relationship between the acoustic classification
and the wood anatomy
The acoustic quality of the woods could not be explained by
any vessel characteristics. The present findings do not comply
with the theory that the narrow diameter and high frequency of
vessels in wood is detrimental to acoustic quality since Ceiba
and Discoglypremna, which only have a few (1–2/mm
2
) large
vessels (around 200 µm diameter), had very poor acoustics.
However, the parenchyma tissue, depending on their distri-
bution patterns and abundance, seemed to have an impact on
the acoustic quality. Woods with the best acoustics had axial
parenchyma, which was mainly paratracheal and not very
abundant (but this latter condition did not seem critical), with
only a few short rays, and definitely with a homogeneous structure.
Characterization of the organization of wood components
could be enhanced by approaching it from a different perspec-
tive, i.e. assuming that woods with the best acoustic qualities
have wood structure not regularly disrupted by parenchyma.
There are always tangential disruptions due to the presence of
rays (a few wood rayless species exist, but these are rare sci-
entific curiosities). These disruptions are minimized when only
a few small rays are present. Radial disruptions in the wood
structure consistency are primarily due to the presence of ves-
sels (this applies to all woods tested in the present study, but
woods of gymnosperm species and of a few rare small dicot
families do not have vessels). Hence, woods with few vessels
should theoretically have better acoustics than very porous
woods. The presence of paratracheal parenchyma does not
increase the number of disruptions in the fibrous tissues but it
slightly increases disruptions induced by the vessels. However,
apotracheal parenchyma, diffuse-in-aggregates or in tangential
bands, regularly and frequently disrupts the radial cohesion
between fibres. For instance, in the woods with good acoustics,
the fibrous tissue was radially disrupted about twice/cm by
marginal parenchyma bands in Swietenia, 15 times by bands
in Hymenolobium, while in the woods with poor acoustics the
tissues were disrupted 35–50 times/cm by parenchyma bands
in Manilkara and up to 120 times/cm by diffuse-in-aggregates
parenchyma in Pyriluma.
The fibre morphology did not seem to have a major impact
on the acoustic quality of the woods as long as the lumen diam-
eter was 10 µm or more, i.e. the fibre flexibility coefficient
(lumen diameter/fibre width × 100) had to be above 40 or so.
A storied wood structure does not always ensure good acous-
tics but it likely does enhance the sound quality.
We did not experimentally assess the impact of some ana-
tomic features of the wood specimens on acoustic quality.
However, a few structural characteristics of the specimens that
were classified (in terms of acoustic quality) as slightly less
good than the top seven woods and not quite as bad as the poor-
est woods could be briefly considered.
Of the specimens ranked just under the seven best woods in
the acoustic classification, Humbertia, Cedrelinga and Afzelia
had a scanty paratracheal or lozenge-aliform parenchyma
(Afzelia) as well as a few diffuse parenchyma in the top two spe-
cies or narrow marginal bands (Afzelia). They had many rays
(5–8/mm), that were short (less than 300 µm high) with a homo-
geneous structure. The vessel frequency was 1–5/mm
2
. The
fibre lumen diameter was very narrow in Humbertia and Afze-
lia, but very wide in Cedrelinga. Finally, none of these three
woods had a storied structure.
The three species that were ranked just above the seven poor-
est woods in the acoustic classification were Discoglypremna,
Nesogordonia and Ceiba. All three had a diffuse-in-aggregate
parenchyma. Their rays were either relatively low (250–650 µm
high) and numerous (10–15/mm) in the first two species, or few
in number (5/mm) but very high (more than 1200 µm) in Ceiba,
with a heterogeneous (Discoglypremna and Ceiba) or sub-
homogeneous (Nesogordonia) structure. The vessel frequency
was 1–3/mm
2
in Discoglypremna and Ceiba, and around 20/mm
2
in Nesogordonia. The fibre lumen diameter was relatively nar-
row in this species, but wide to very wide in the other two. The
wood structure was regularly storied including the rays in
Nesogordonia, but with most of the rays nonstoried in Ceiba.
4. CONCLUSION
When analyzing materials it is essential to determine the
relationships between the manufacturing process (in our case
the wood development), the microstructure and properties,
while also correlating the properties with performance. This is
useful for designing methods to help users make optimal
choices on materials and implementation conditions, and to
determine cost-effective ways of achieving the best perform-
ance, increasing the reliability of the materials and controlling
assembly processes. The properties of cellular solids depend on
two sets of parameters; those which describe the geometric
internal structure and those which describe the intrinsic prop-
erties of the material of which the cell walls are made. When
the material is wood, each species could be considered as a
“wood factory” that produces a unique wood, always having
the same basic composition: a cellular composite consisting of
cellulose, lignin and hemicelluloses containing various quan-
tities of extractives. The most marked variations between spe-
cies are noted in the cellular organization pattern, i.e. the
distinctive “fingerprint” of each species. It is thus of interest to
assess the relationship between these patterns and the acoustic
or vibratory properties of the wood and to compare them with
the acoustic performances responsible for the acoustic quality.
The percussive acoustic quality of a wood, as determined
empirically by the xylophone maker, can first be related to the
Classifications of xylophone bar materials 81
two sound signal parameters, i.e. temporal damping of the fun-
damental frequency and to a lesser extent the amplitude of this
frequency. The wood density doesn’t impact this acoustic qual-
ity, but the light woods have some technological drawbacks.
Our analysis of the organization of wood components in the
tested species relative to the acoustic quality classification
highlighted the importance of the regularity and homogeneity
of the anatomical structures.
A draft anatomical portrait of a good acoustic wood could
be drawn up on the basis of our analysis of wood structures in
the seven acoustically best and seven poorest woods. This por-
trait should include a compulsory characteristic, an important
characteristic and two or three others of lesser importance.
The axial parenchyma is the key trait. It should be paratra-
cheal, and not very abundant if possible. If abundant (thus
highly confluent), the bands should not be numerous. Apotra-
cheal parenchyma can be present, but only in the form of well
spaced bands (e.g. narrow marginal bands).
The rays (horizontal parenchyma) are another important fea-
ture. They should be short, structurally homogeneous but not
very numerous.
The other characteristics are not essential, but they could
enhance the acoustic quality. These include:
– Small numbers of vessels (thus large);
– A storied structure;
– Fibres with a wide lumen (or a high flexibility coefficient).
The samples tested in this study were not musically con-
firmed, so the analysis was biased since no frequency descriptor
could be identified. This parameter should be taken into con-
sideration in future studies in order to come up with a more
exhaustive list of parameter descriptors of acoustic quality for
wood specimens and to identify other subtle features associated
with acoustic quality.
Acknowledgements: The authors are extremely grateful to Robert
Hébrard, musical instrument designer and xylophone maker, who gave
useful advices and performed the acoustic and the multisensory clas-
sification of the wood specimens.
REFERENCES
[1] Bismarck G., Sharpness as an attribute of the timbre of steady
sounds, Acustica J. 30 (1974) 146–158.
[2] Bordonné P.A., Module Dynamique et Frottement Intérieur dans le
Bois – Mesures sur Poutres Flottantes en Vibrations Naturelles,
Ph.D. thesis, Institut National Polytechnique de Lorraine, 1989.
[3] Brancheriau L., Expertise mécanique des sciages par analyses des
vibrations dans le domaine acoustique, Ph.D. thesis, École supé-
rieure de mécanique de Marseille, 2002.
[4] Brancheriau L., Baillères H., Natural vibration analysis of clear
wooden beams: a theoretical review, Wood Sci. Technol. J. 36
(2002) 347–365.
[5] Bucur V., Acoustics of wood, CRC Press, 1995, pp. 135–143.
[6] Grey J.M., Multidimensional perceptual scaling of musical timbres,
J. Acous. Soc. Am. 61 (1977) 1270–1277.
[7] Holz D., Tropical hardwoods used in musical instruments – can we
substitute them by temperate zone species? Holzforschung J. 50
(1996) 121–129.
[8] Kollmann F.F.P., Côté W.A.J., Principles of wood science and
technology, Springer-Verlag, Berlin, 1968, pp. 274–281.
[9] Martinis R., Valentina Socco L., Sambuelli L., Nicolotti G., Schmitt
O., Bucur V., Tomographie ultrasonore pour les arbres sur pied,
Ann. For. Sci. 61 (2004) 157–162.
[10] Matsunaga M., Sugiyama M., Minato K., Norimoto M., Physical
and mechanical properties required for violin bow materials, Holz-
forschung J. 50 (1996) 511–517.
[11] Matsunaga M., Minato K., Physical and mechanical properties
required for violin bow materials. II: Comparison of the processing
properties and durability between pernambuco and substitutable
wood species, J. Wood Sci. 44 (1998) 142–146.
[12] Matsunaga M., Minato K., Nakatsubo F., Vibrational property
changes of spruce wood by impregnating with water-soluble
extractives of pernambuco (Guilandina echinata Spreng.), J. Wood
Sci. 45 (1999) 470–474.
[13] McAdams S., Winsberg S., Donnadieu S., De Soete G., Krimphoff
J., Perceptual scaling of synthesized musical timbres: common
dimensions, specificities and latent subject classes, Psychol. Res. J.
58 (1995) 177–192.
[14] Obataya E., Umezawa T., Nakatsubo F., Norimoto M., The effects
of water soluble extractives on the acoustic properties of reed
(Arundo donax L.), Holzforschung J. 53 (1999) 63–67.
[15] Ono T., Norimoto M., Study on Young’s modulus and internal fric-
tion of wood in relation to the evaluation of wood for musical ins-
truments, Jap. J. Appl. Phys. 22 (1983) 611–614.
[16] Ouis D., Vibrational and acoustical experiments on logs of spruce,
Wood Sci. Technol. J. 33 (1999) 151–184.
[17] Ouis D., Detection of decay in logs through measuring the dampe-
ning of bending vibrations by means of a room acoustical techni-
que, Wood Sci. Technol. J. 34 (2000) 221–236.
[18] Ouis D., On the frequency dependence of the modulus of elasticity
of wood, Wood Sci. Technol. J. 36 (2002) 335–346.
[19] Pellerin R.F., Vibrational approach to nondestructive testing of
structural lumber, For. Prod. J. 15 (1965) 93–101.
[20] Steiglitz K., McBride L.E., A Technique for the Identification of
Linear Systems, IEEE Trans. Automat. Contr. 10 (1965) 461–464.
[21] Sugiyama M., Matsunaga M., Minato K., Norimoto M., Physical
and mechanical properties of pernambuco (Guilandina echinata
Spreng.) used for violin bows, Mokuzai Gakkaishi 40 (1994) 905–
910.
[22] Tenenhaus M., La Régression PLS : Théorie et Pratique, Technip,
Paris, 1998.