Báo cáo lâm nghiệp: "Modeling the impact of thinning on height development of dominant and codominant loblolly pine trees" pot
Bạn đang xem bản rút gọn của tài liệu. Xem và tải ngay bản đầy đủ của tài liệu tại đây (130.9 KB, 6 trang )
Ann. For. Sci. 63 (2006) 349–354 349
c
INRA, EDP Sciences, 2006
DOI: 10.1051/forest:2006015
Original article
Modeling the impact of thinning on height development of dominant
and codominant loblolly pine trees
Mahadev S
a
*
, Michael S
b
,HaroldE.B
c
, Ralph L. A
c
a
Ontario Forest Research Institute, Ministry of Natural Resources, 1235 Queen Street E, Sault Ste Marie, P6A 2E5 ON, Canada
b
White Earth Indian Reservation in White Earth, Minnesota, USA
c
Department of Forestry, Virginia Polytechnic Institute and State University, Blacksburg, VA 24061
(Received 24 June 2005; accepted 3 October 2005)
Abstract – Data collected from loblolly pine thinning study plots established in plantations on cutover, site-prepared lands were used to evaluate
thinning impact on height growth of dominant and codominant loblolly pine trees. Height growth was reduced initially by thinning but was increased
after 3 years following thinning. The average total height of dominant and codominant trees in thinned stands exceeded its counterpart in unthinned
stands 12 years after thinning. Initial growth response to thinning was less at older stand ages than at younger ages. A model was constructed to
characterize the development of height in thinned and unthinned stands. This model reflects the initial suppression of dominant and codominant height
growth followed by an acceleration as a result of thinning.
site index / thinning shock / thinning r esponse function / Pinus t aeda
Résumé – Modélisation d e l’impact de l’éclaircie sur le d éveloppement en hauteur des arbres dominants et codominants chez Pinus taeda L. Des
données récoltées dans des dispositifs expérimentaux d’étude des éclaircies, installés dans des plantations de Pinus taeda, ont été utilisées pour évaluer
l’impact de l’éclaircie sur la croissance en hauteur des arbres dominants et co-dominants. La croissance en hauteur a été initialement réduite par éclaircie,
mais s’est accrue dans les 3 ans suivant l’éclaircie. La moyenne de la hauteur totale des arbres dominants et codominants dans les peuplements éclaircis
est supérieure à celle des arbres dominants et codominants des peuplements non éclaircis, 12 ans après l’éclaircie. La réponse initiale en termes de
croissance à l’éclaircie était plus faible dans les vieux peuplements que dans les peuplements jeunes. Un modèle a été construit pour caractériser
l’évolution de la croissance en hauteur dans les peuplements éclaircis et les peuplements non éclaircis. Ce modèle reflète l’effet initial dépressif de
l’éclaircie sur la croissance des arbres dominants et codominants suivi d’une accélération comme résultat de l’effet d’éclaircie.
site index / effet de l’éclaircie / fonctions de réponse de l’éclaircie / Pinus t aeda
1. INTRODUCTION
In order to achieve forest management objectives, individ-
ual tree and stand developments are manipulated by apply-
ing an array of silvicultural treatments. Thinning is one of the
most common and effective silvicultural treatments for regu-
lating individual tree and stand growth. There are situations,
however, where initial responses to thinning are not always
positive. Reductions in height or diameter growth, chlorotic
foliage, and damage or mortality associated with increased
exposure after thinning are examples of negative responses.
These negative responses, individually or collectively, are re-
ferred to as “thinning shock” [6].
It is generally accepted that mean dominant stand height
is not strongly influenced by changes in stand density. This
is a key assumption underlying the use of site index, defined
as the top height (mean height of dominant and codominant
trees) of a stand at a specified (index) age, as an indicator
of site quality (productivity). However, previous studies by
* Corresponding author:
Ginn et al. [5] and Peterson et al. [10] on loblolly pine (Pi-
nus taeda L.) and by Harrington and Reukema [6], Miller and
Reukema [9], and Crown et al. [4] on Douglas-fir (Pseudo-
tsuga menziesii Franco) indicate that height growth in a stand
is affected by thinning.
If thinning has an impact on the height growth, it is im-
portant that the thinning response be incorporated in growth
and yield prediction models. Including response to thin-
ning may improve understanding of management effects and
help forest managers make accurate decisions on appropriate
management regimes. In the past, efforts have been made to
incorporate the response of thinning in growth and yield mod-
els implicitly or explicitly. The individual tree growth simula-
tion model, PTAEDA2 [3], is an example where response to
thinning is implicit through changes in each tree’s competitive
status.
Short and Burkhart [11] and Liu et al. [7] described changes
in crown ratio as an explicit function of a generalized thin-
ning response variable. The thinning response variable can ac-
count for various factors which affect response to thinning,
such as intensity of thinning, age of the stand at the time
Article published by EDP Sciences and available at or />350 M. Sharma et al.
of thinning, and the time elapsed since thinning. Similarly,
Amateis et al. [1] developed separate diameter increment mod-
els for loblolly pine trees grown in thinned and unthinned
stands.
Smith [13] developed a height growth model for loblolly
pine trees grown in thinned and unthinned stands by explicitly
utilizing the generalized thinning response variable presented
later by Liu et al. [7]. The performance of the model, however,
was not fully satisfactory since the data used to fit the model
did not include a time span long enough to differentiate the
stand development following thinning.
A height growth model that performs well under negative
as well as positive effects of variable thinning intensity has not
been advanced. Here, we present results from a study aimed
at analyzing both initial and long-term responses to different
intensities of thinning for height of dominant and codomi-
nant loblolly pine trees grown in plantations on cutover, site-
prepared areas. We then develop a height growth equation ac-
counting for thinning response over time.
2. MATERIEL AND METHODS
2.1. Data
The data used in this study were collected from permanent plots
established in thinned and unthinned loblolly pine plantations on
cutover, site-prepared lands [2]. During the dormant seasons of 1980–
1981 and 1981–1982, permanent plots were established in planted
stands of loblolly pine (Pinus taeda L.) through the native range of
the species in the southeastern United States at 186 locations. At the
time of initial plot establishment, the stands averaged 14 years in age
(defined as years since planting). Plot locations ranged from Mary-
land south to Georgia and west to East Texas (latitude from approxi-
mately 30
◦
Nto38
◦
N and longitude from around 75
◦
Wto95
◦
W).
At each location, three treatment plots were installed: an unthinned
control, a lightly thinned, and a heavily thinned plot.
Thinnings were from below with occasional larger trees removed
where damage or spacing considerations were a factor. Approxi-
mately 30 and 50% of total basal area was removed from the lightly
and heavily thinned plots, respectively [2]. A second thinning was
applied in roughly half of the thinned plots during the 1992–1994
dormant seasons, 12 years after plot establishment.
Diameter at breast height (dbh), total height, and crown class
(dominant, codominant, intermediate, and suppressed) information
was collected on all trees every three years since plot establishment.
Crown class determination was made by field personnel according to
the crown class definitions of Smith [12]. At the time of this study,
six remeasurements had been completed.
Summary statistics for the total height of all trees for each treat-
ment at each measurement are presented in Table I. At the end of the
sixth remeasurement, only 84 stands out of 186 (41 once thinned and
the rest twice thinned) remained and the rest were damaged by flood,
fire, disease and/or other activities. Data from once thinned stands
were set aside for parameter estimation and the rest were used for
model evaluation.
2.2. Thinning impact on height growth
In order to examine the thinning impact on the growth of dominant
and codominant loblolly pine trees, the mean value of total height of
dominant and codominant trees was calculated for each unthinned
and once thinned stand at each location (site) for each remeasure-
ment. Trees that were broken, diseased or damaged at any point in the
study were excluded from this analysis. Also, plots in which the num-
bers of dominant and codominant trees were fewer than 5 were not
included in the analysis. Unless otherwise specified, the term “mean”
used in this paper refers to the arithmetic mean. Similarly, “height”
represents the total height of dominant and codominant trees.
Mean heights in lightly and heavily thinned stands were compared
by conducting paired t-tests on mean height of dominant and codomi-
nant trees across sites by remeasurement (Tab. II), with their counter-
parts in unthinned stands. P-values in Table II indicate that the plots
with different levels of thinning were very similar in terms of total
height of dominant and codominant trees at plot establishment.
At the first remeasurement (3 years after plot establishment), mean
height was significantly smaller in heavily thinned stands than in un-
thinned stands (p < 0.05). Afterward, the difference in mean height
between unthinned and heavily thinned stands diminished gradually.
By the fifth remeasurement, the mean height was greater (although
not significantly) in heavily thinned stands than in unthinned stands.
The mean height became significantly greater in heavily thinned
stands than in unthinned stands (p < 0.05) by the time of sixth remea-
surement. Mean height in heavily thinned stands, however, was not
significantly different from its counterpart in lightly thinned stands
across the measurements.
In the case of lightly thinned stands, the mean height was not sig-
nificantly different from the mean height in unthinned stands. Never-
theless, the difference in mean heights between unthinned and lightly
thinned stands followed the pattern of the difference in mean heights
between unthinned and heavily thinned stands over time.
It is obvious from Table II that the maximum negative impact of
thinning on height growth occurred around the first remeasurement
(3 years after thinning) and recovery took about 6–9 years there-
after. Exact times for the maximum negative thinning impact and the
growth recovery for height could not be obtained from the data since
the stands were measured every three years following thinning.
2.3. Model development
Two assumptions were made for developing a model to predict
mean height of dominant and codominant trees by stand age. The
first is that height growth approaches zero as height approaches a
maximum limit [8] and the second is that growth is proportional to
the thinning response function (TRF). Mathematically:
dY
dA
= α
Y
A
1 −
Y
M
(TRF)(1)
where Y is average height, A is age in years, M is an asymptotic
maximum parameter, TRF is some function representing a thinning
effect, and α is a proportionality constant. Rearranging the terms of
Equation (1) gives:
dY
Y
1 −
Y
M
= α
(
TRF
)
dA
A
(2)
Integrating Equation (2) results in:
dY
Y
1 −
Y
M
= α
(
TRF
)
dA
A
(3)
Thinning effect on height development 351
Table I. Summary statistics for total height of all trees for each treatment (thinning) plot at each measurement.
Unthinned Lightly thinned Heavily thinned
Trees/ha
Height
Trees/ha
Height
Trees/ha
Height
Measurement* Mean (m) Stdev (m) Mean (m) Stdev (m) Mean (m) Stdev (m)
0 1443 11.38 3.63 1407 11.38 3.68 1409 11.37 3.64
1 1363 13.10 3.51 836 13.59 3.49 636 13.70 3.51
2 1220 14.57 3.36 793 15.16 3.32 605 15.28 3.34
3 999 15.80 3.21 673 16.39 3.08 516 16.58 3.07
4 750 17.25 3.21 548 17.78 3.05 421 18.10 3.04
5 555 18.80 3.31 353 19.58 3.08 268 19.91 3.13
6 436 20.00 3.34 290 20.74 3.12 223 20.97 3.08
*0= plot establishment, 1 = 3 years after plot establishment, 2 = 6 years after plot establishment, etc.
Table II. P values of paired t-tests for mean height of dominant and codominant trees in lightly and heavily thinned plots of each stand
compared with unthinned plots by remeasurement.
Measurement*
Unthinned vs. lightly thinned Unthinned vs. heavily thinned Lightly thinned vs. heavily thinned
Difference (m) p-value Difference (m) p-value Difference (m) p-value
0 0.01 0.936 0.03 0.719 0.02 0.832
1 0.12 0.450 0.23 0.022 0.11 0.355
2 0.02 0.868 0.16 0.096 0.13 0.339
3 –0.02 0.894 0.08 0.448 0.10 0.460
4 –0.03 0.838 0.01 0.918 0.04 0.754
5 –0.10 0.552 –0.15 0.210 –0.05 0.727
6 –0.33 0.113 –0.32 0.027 0.01 0.958
*0= plot establishment, 1 = 3 years after plot establishment, 2 = 6 years after plot establishment, etc.
As far as TRF is concerned, Short and Burkhart [11] introduced a
TRF function in a crown height development model for loblolly pine
trees as:
TRF =
I
A
t
A
r
(4)
where I is the ratio of after to before thinning basal area, A is the
stand age, A
t
is the stand age at the time of thinning (A > A
t
), and
r is the rate parameter corresponding to thinning response. In order
to account for the thinning response in the beginning, the value of r
should be less then zero. In that case, Equation (4) is a monotonically
decreasing function over time. This implies that the response of stand
or tree characteristics is maximized at the time of thinning and dimin-
ishes thereafter. Biologically, however, there should be no immediate
response at the time of thinning.
Therefore, Liu et al. [7] presented another TRF:
TRF = I
r
k(A−A
t
) − (A−A
t
)
2
A
2
(5)
where k is a parameter, known as the duration parameter, and the
other variables are as defined earlier. The units of k are years. As a
result, the rate parameter, r, becomes unitless.
Equation (5) has the following properties: the response to thinning
(1) starts at zero (TRF = 1) at the time of thinning and becomes
negative; (2) reaches a maximum after some time t
m
since thinning;
and (3) the growth in thinned stands exceeds the growth in unthinned
stands after t
m
,(A − A
t
) equals the duration parameter, k. It can be
easily seen that the maximum negative response to thinning occurs at
t
m
=
kA
t
k + 2 A
t
(6)
years after thinning. It is obvious that the age of maximum response
depends on the age of the stand at time of thinning (A
t
)andk. Details
of the characteristics of this TRF can be found in Liu et al. [7].
Equation (5) has all the properties required to represent a thinning
response function (TRF) for the height growth of loblolly pine trees.
Therefore, Equation (5) was adopted as a thinning response function
(TRF) in this study. Equation (3) with this TRF function becomes:
dY
Y
1 −
Y
M
= α
I
r
k(A−A
t
) − (A−A
t
)
2
A
2
dA
A
(7)
The left hand side of Equation (7) can be evaluated analytically. The
height growth between any two points Y
1
and Y
2
(corresponding to
ages A
1
and A
2
, respectively) can be computed from:
Y
2
Y
1
dY
Y
1 −
Y
M
= log
Y
2
(M − Y
1
)
Y
1
(M − Y
2
)
Thus, the function of height growth, log
Y
2
(M−Y
1
)
Y
1
(M−Y
2
)
between stand ages
A
1
and A
2
can be written as:
log
Y
2
(M − Y
1
)
Y
1
(M − Y
2
)
= α
A
2
A
1
I
r
k(A−A
t
) − (A−A
t
)
2
A
2
dA
A
(8)
The right hand side of Equation (8), however, does not have a closed
form solution. Therefore, it must be evaluated numerically. Tang
et al. [14] introduced a two-stage regression method to solve uniden-
tifiable simultaneous equations in system ecology based on an error-
in-variable model. To make the method more applicable in a complex
352 M. Sharma et al.
situation, Tang and Wang [15] presented a parameter estimation algo-
rithm that estimates the parameters and evaluates the integral simulta-
neously. Therefore, this algorithm was adopted to solve Equation (8)
and estimate the parameters. In order to use the algorithm, however,
the asymptotic value of height (M) must be known so that the depen-
dent variable, log
Y
2
(M−Y
1
)
Y
1
(M−Y
2
)
, can be calculated for each observation.
The height growth equation presented by McDill and Amateis [8],
i.e. Equation (3) without TRF, was used to estimate the asymptotic
value of height.
Each observation used in fitting Equation (8) was calculated using
an initial measurement and the subsequent remeasurement. The ini-
tial measurement was used to define Y
1
and A
1
, and the ending mea-
surement was used to define Y
2
and A
2
. As a result, all measurements
except the first and last belonged to two observations – as the ini-
tial measurement in one observation and as the ending measurement
in another. This resulted in six observations per plot. Equation (8)
was fitted to the data set obtained from the stands that were thinned
only at plot establishment using the algorithm developed by Tang and
Wang [15].
Equation (8) for height growth was evaluated by comparing its
performance with the height growth model presented by Smith [13].
Smith’s model was the following:
H = exp
ln(H
0
)
(
A
0
/A
)
β
0
e
β
1
TRF
A
−
TRF
0
A
0
(9)
where, H and H
0
are heights and TRF and TRF
0
are thinning re-
sponse values at ages A and A
0
, respectively, and β
0
and β
1
are pa-
rameters. Equation (9) was also fitted to the same data set using the
NLIN procedure in SAS. Evaluation was performed by calculating
bias in estimating heights under different thinning conditions for the
estimation data set.
Further evaluation of the height growth model was performed by
calculating bias in estimating heights for the data from twice thinned
stands which were set aside for model validation. In order to avoid
the confounding effect of second thinning, only heights measured up
to the fourth measurement were used for the evaluation.
3. RESULTS AND DISCUSSION
The estimate for asymptotic height obtained from Equa-
tion (3) without TRF was 38 m. Similarly, estimated values of
parameters for Equation (8) corresponding to α, r,andk were
1.2714, 1.7655, and 4.5631, respectively. To ensure that the
solution represents a global rather than local minimum, mul-
tiple initial values of the model parameters were provided for
the fits. The predicted heights using this set of parameters at
different thinning level, however, resulted in a time period of
8 years for height recovery after thinning, which is less than
the approximately 13 years indicated by the observed data.
Therefore, a value of k was sought in Equation (8) that re-
sults in the recovery period of approximately 13 years. By
setting different values of k in Equation (8) and running the
program to estimate other parameters, a value of k equal to 7
resulted in the recovery period of around 13 years. Estimates
for other parameters, α and r, corresponding to this value of k
were 1.2949 and 2.0488, respectively.
It should be noted that the TRF parameters in Equation (8)
do not have the same interpretation as the parameters in Equa-
tion (5). The value of the duration parameter, k, in Equa-
tion (5), for example, represents the recovery period for height
after thinning. On the other hand, k = 7 in Equation (8) re-
sults in the recovery period of approximately 13 years after
thinning. Therefore, the parameter k in Equation (8) cannot be
directly interpreted as the duration parameter as opposed to
in Equation (5). This difference in the interpretation of these
values results from estimating the parameters and evaluating
the integral simultaneously. The parameter k in Equation (8) is
under the integral and hence is evaluated upon integration. On
the other hand, Equation (5) alone is interpreted without any
further evaluation.
The positive sign of the thinning response rate parameter, r,
in Equation (8) indicates that trees in plantations under thin-
ning would eventually have greater heights than the trees in
unthinned stands. The heavier the thinning, the greater is the
response. Similarly, the positive value of k indicates that height
growth initially has a negative response to thinning, starting at
zero at the time of thinning and subsequently reaching a nega-
tive maximum.
The time to the maximum negative response (t
m
) can be
calculated by replacing k in Equation (6) with its estimate that
is 13. Assuming that the stands were thinned at age 11 years
(average age of thinning for the stands that survived through
the 6th remeasurement), the maximum negative thinning im-
pact on the height growth occurs 4 years after thinning. Af-
ter this point, the height growth response to thinning turns
positive and increases over time. The mean height in thinned
stands crosses over the mean height in unthinned stands ap-
proximately 13 years after thinning.
Evaluation of height growth models was carried out by cal-
culating bias (observed – predicted) in estimating heights of
dominant and codominant trees for each stand at each remea-
surement. Average bias was computed across the stands for
each treatment (thinning) at each remeasurement for both fit-
ting and validation data sets (Tab. III). It is clear that Equa-
tion (8) is superior to Equation (9) in terms of bias for all thin-
ning levels.
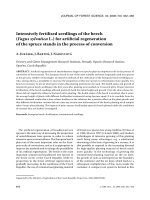
Further evaluation of Equation (8) was performed by gen-
erating height growth curves for the thinned stands with in-
tensities of 0, 30, and 50% percent basal area removed at
age 11 years. These curves were constructed using the av-
erage dominant height (11 m) at plot establishment (Fig. 1).
Trees are taller in unthinned stands than in thinned stands be-
tween ages 11 and 24 years: the heavier the intensity of thin-
ning the shorter the trees in the stand during this period. As
expected, the growth pattern reversed after the time approxi-
mately 13 years following thinning and total height is greater
in thinned stands than in unthinned stands after that time. This
growth pattern continues through the rest of the observation.
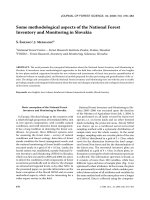
Height growth curves were also produced using Equa-
tion (8) for trees in thinned (50% basal area removed) and
unthinned stands at two different site productivities. Mean
heights of the dominant and codominant trees at lower and
higher site productivities at the time of thinning at age 11 years
were assumed to be 8 and 12 m, respectively (Fig. 2).
The negative response to thinning (the thinning shock) is
slightly greater for the trees at higher site than at lower site
Thinning effect on height development 353
Table III. Mean bias (observed – predicted) for height (m) of loblolly pine trees at different measurements for models (8) and (9) using fit and
validation data.
Measurement*
Unthinned stands Lightly thinned stands Heavily thinned stands
Equation (8) Equation (9) Equation (8) Equation (9) Equation (8) Equation (9)
Fit data set
1 0.077 –0.097 –0.134 0.029 –0.022 0.106
2 –0.171 –0.145 –0.031 –0.016 –0.010 –0.003
3 –0.056 0.017 –0.023 –0.016 –0.005 –0.021
4 0.094 0.173 0.028 0.059 0.041 0.045
5 0.161 0.217 0.098 0.138 0.110 0.149
6 0.031 0.023 0.067 0.106 –0.053 –0.060
Validation data set
1 –0.241 –0.251 –0.124 –0.145 –0.142 –0.086
2 –0.125 –0.060 0.072 0.138 0.052 0.075
3 0.032 0.123 0.088 0.125 –0.066 0.039
4 0.040 0.126 0.004 0.041 0.012 0.114
*1= 3 years after plot establishment, 2 = 6 years after plot establishment, etc.
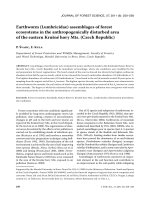
Heavily
Figure 1. Height curves generated by Equation (8) for un-
thinned, lightly thinned, and heavily thinned stands using initial
height of 11 m at age 11 years.
Figure 2. Height curves generated by Equation (8) for heavily
thinned and unthinned stands at two sites of different productiv-
ities using a thinning intensity of 50% basal area removed and a
thinning age of 11 years.
quality. After the crossover between heights in thinned and
unthinned stands, the difference in heights between unthinned
and thinned stands is greater for lower than for higher site
qualities.
Several researchers in the past have also reported the neg-
ative and positive thinning impacts on the stand growth. The
thinning impact on height growth of Douglas-fir trees reported
by Harrington and Reukema [6] was similar to that described
here. Miller and Reukema [9] and Crown et al. [4] also re-
ported reduced height growth of Douglas-fir trees following
thinning.
Peterson et al. [10] found that loblolly pine trees in thinned
stands quickly expanded their crowns horizontally starting the
year following thinning along with the reduction in height
growth. They also found that the crown expansion approached
its maximum 6 years after thinning.
354 M. Sharma et al.
Similarly, Ginn et al. [5] reported decreased height growth
and increased live crown diameter growth of loblolly pine trees
during the first year after thinning, followed by increased stem
diameter growth during the second year. However, none of
these studies reported the crossover between heights in thinned
and unthinned stands. This may be because the duration of
time of the stand development they observed following thin-
ning was not long enough to exhibit the full effect of the thin-
ning.
There have been efforts made at explaining stand develop-
ment following thinning. In an attempt to describe crown de-
velopment of loblolly pine trees after thinning, Liu et al. [7]
argued that there should be no immediate thinning response on
height growth. The response to thinning should begin at zero
and increase to some maximum as the crowns of the residual
trees respond to the extra growing space and additional sun-
light. The response should diminish after crown closure and
approach the unthinned condition. Ginn et al. [5] attributed the
decrease in height growth of loblolly pine trees to a redistribu-
tion of photosynthate from height growth to the expansion of
the lower crown after thinning.
Equation (8) can be applied to estimate height (Y
2
)atage
A
2
if the height (Y
1
)atageA
1
, basal area ratio (I), and the age
at the time of thinning (A
t
) are known. Since the parameters
α, r and k known (estimated values), the right hand side of the
equation can be evaluated by using computer software (e.g.
Mathematica). Y
2
can then be calculated as:
Y
2
=
MY
1
exp(c)
M − Y
1
(1 − exp(c))
(10)
where, c represents the right hand side of Equation (8) for a
given set of variables. The integral of Equation (8) can also be
computed online [16].
4. CONCLUSIONS
This study shows that height growth of dominant and
codominant loblolly pine trees is affected by thinning. Within
the range of removals contained in this data set, the heavier the
thinning the greater is the response. Height growth is initially
reduced by thinning resulting in shorter trees in thinned stands
than in unthinned stands. After the decrease in height growth
reaches its maximum, growth begins to increase yielding taller
trees in thinned stands than in unthinned stands at older ages.
However, the initial thinning response at an older stand age is
not as great as thinning response at an earlier age. Moreover,
the light thinning applied in this study was not intense enough
to significantly affect height growth even at younger ages.
Although the impact of thinning on dominant height devel-
opment of loblolly pine plantations is relatively small, and in
many circumstances the differences can be safely ignored, un-
derstanding and quantifying the nuances of thinning on stand
development can potentially aid in improving growth esti-
mates and management prescriptions.
Acknowledgements: This study was supported by the Loblolly Pine
Growth and Yield Research Cooperative at Virginia Polytechnic In-
stitute and State University. The authors are grateful to Shouzheng
Tang for his assistance in using the parameter estimation algorithm
to estimate the parameters in the model.
REFERENCES
[1] Amateis R.L., Burkhart H.E., Walsh T.A., Diameter increment and
survival equations for loblolly pine trees growing in thinned and un-
thinned plantations on cutover, site-prepared lands, South. J. Appl.
For. 13 (1989) 170–174.
[2] Burkhart H.E., Cloeren D.C., Amateis R.L., Yield relationships in
unthinned loblolly pine plantations on cutover, site-prepared lands,
South. J. Appl. For. 9 (1985) 84–90.
[3] Burkhart H.E., Farrar K.D., Amateis R.L., Daniels R.F., Simulation
of individual tree growth and stand development in loblolly pine
plantations on cutover, site-prepared areas, School of Forestry
and Wildlife Resources, Virginia Polytechnic Institute and State
University, Publication FWS-1-87, Blacksburg, VA, 1987, 47 p.
[4] Crown M., Quenet R.V., Layton C., Fertilization and thinning ef-
fects on a Douglas-fir ecosystem at Shawnigan Lake: 3-year growth
response, Can For Serv Rep BC-X-152, Victoria, BC, 1977, 36 p.
[5] Ginn S.H., Seiler J.R., Cazell B.H., Kreh R.E., Physiological and
growth responses of eight-year-old loblolly pine stands to thinning,
For. Sci. 37 (1991) 1030–1040.
[6] Harrington C.A., Reukema D.L., Initial shock and long-term stand
development following thinning in a Douglas-fir plantation, For.
Sci. 29 (1983) 33–46.
[7] Liu J., Burkhart H.E., Amateis R.L., Projecting crown measures for
loblolly pine trees using a generalized thinning response variable,
For. Sci. 41 (1995) 43–53.
[8] McDill M.E., Amateis R.L., Measuring forest site quality using the
parameters of a dimensionally compatible height growth function,
For. Sci. 38 (1992) 409–429.
[9] Miller R.E., Reukema D.L., Urea fertilizer increases growth of 20-
year-old thinned Douglas-fir on a poor quality site. USDA Forest
Serv Res Note PNW-291, Pac Northwest Forest and Range Exp Stn,
Portland, Oreg., 1977, 8 p.
[10] Peterson J.A., Seiler J.R., Nowak J., Ginn S.E., Kreh R.E., Growth
and physiological responses of young loblolly pine stands to thin-
ning, For. Sci. 43 (1997) 529–534.
[11] Short E.A.III, Burkhart H.E., Predicting crown-height increment for
thinned and unthinned loblolly pine plantations, For. Sci. 38 (1992)
594–610.
[12] Smith D.M., The Practice of Silviculture, 7th ed., John Wiley and
Sons, Inc., New York, 1962, 578 p.
[13] Smith M.C., Diameter and height increment and mortality functions
for loblolly pine trees in thinned and unthinned plantations, M.S.
thesis, Department of Forestry, Virginia Polytechnic Institute and
State University, Blacksburg, VA, 1994, 138 p.
[14] Tang S., Li Y., Wang Y., Simultaneous equations, error-in-variable
models, and model integration in systems ecology, Ecol. Model. 142
(2001) 285–294.
[15] Tang S., Wang Y., A parameter estimation program for the error-in-
variable model, Ecol. Model. 156 (2002) 225–236.
[16] Waner S., Costenoble R. Copyright 1995, stra.
edu/faculty/Stefan_Waner/RealWorld/integral/integral.html.