Báo cáo lâm nghiệp:"A height-diameter model for Pinus radiata D. Don in Galicia (Northwest Spain)" docx
Bạn đang xem bản rút gọn của tài liệu. Xem và tải ngay bản đầy đủ của tài liệu tại đây (712.08 KB, 9 trang )
237
Ann. For. Sci. 60 (2003) 237–245
© INRA, EDP Sciences, 2003
DOI: 10.1051/forest:2003015
Original article
A height-diameter model for Pinus radiata D. Don in Galicia
(Northwest Spain)
Carlos A. López Sánchez
a
*, Javier Gorgoso Varela
a
, Fernando Castedo Dorado
a
, Alberto Rojo Alboreca
a
,
Roque Rodríguez Soalleiro
b
, Juan Gabriel Álvarez González
a
and Federico Sánchez Rodríguez
b
a
Escuela Politécnica Superior de Lugo, Universidad de Santiago de Compostela, Departamento de Ingeniería Agroforestal,
Campus Universitario S/N, 27002 Lugo, Spain
b
Escuela Politécnica Superior de Lugo, Universidad de Santiago de Compostela, Departamento de Producción Vegetal,
Campus Universitario S/N, 27002 Lugo, Spain
(Received 6 August 2001; accepted 12 August 2002)
Abstract – A total of 26 models that estimate the relationship between height and diameter in terms of stand variables (basal area, quadratic
mean diameter, maximum diameter, dominant diameter, dominant height, arithmetic mean height, age, number of trees per hectare and site
index), were fitted to data corresponding to 9686 trees, using linear and non-linear regression procedures. The precision of the models was then
evaluated by cross-validation. The data were collected during two inventories of 182 permanent plots of radiata pine (Pinus radiata D. Don)
situated throughout Galicia, in the Northwest of Spain. Comparison of the models was carried out by studying the coefficient of determination,
bias, mean square error, Akaike's information criterion and by using a F-test to compare predicted and observed values. Best results were
obtained with those models that included any independent variable related to the height of the stand (mean or dominant height), although this
implies a greater sampling effort for its application. The model of Tomé gave the best height estimates.
Pinus radiata D. Don / forest modelling / Galicia / height-diameter relationship
Résumé – Un modèle hauteur-diamètre pour Pinus radiata D. Don en Galice (nord-ouest de l’Espagne). Vingt-six modèles prenant en
compte le rapport hauteur-diamètre en fonction des variables de masse (diamètre maximal, diamètre dominant, hauteur dominante, hauteur
moyenne arithmétique, âge, nombre d'arbres par hectare, qualité du site, etc.), ont été évalués par rapport aux données relatives à 9686 arbres,
grâce à des procédures de régression linéaire et non linéaire. La précision des modèles a ensuite été évaluée par validation croisée. Les données
correspondent à deux inventaires réalisés sur 182 parcelles permanentes de Pinus radiata D. Don réparties dans toute la Galice, au nord-ouest
de l'Espagne. La comparaison des modèles a été effectuée suite à l’étude du coefficient de détermination, du biais, de l’écart quadratique moyen
et du critère d’information d'Akaike. Un F-Test a été utilisé pour comparer les valeurs prévues et observées. Les meilleurs résultats ont été
obtenus avec les modèles comprenant une variable indépendante en lien avec la hauteur de la masse (moyenne ou hauteur dominante), bien que
cela implique un gros effort d’échantillonnage pour son application. Le modèle de Tomé a permis d’obtenir les meilleures évaluations de
hauteur.
Pinus radiata D. Don / modélisation de forêt / Galice / rapport hauteur-diamètre
1. INTRODUCTION
Diameter at breast height and total height are the most
commonly measured variables in forest inventories. Total
height is less frequently used in the development of forest
models than diameter, as it is hard and costly to measure, and
as a result inaccurate measurements are often made [14]. A
single sample of height measurements is therefore usually
taken and equations that relate the two variables fitted [26].
These height-diameter relationships are applied to even-
aged stands and can be fitted to linear functions, such as
second-order polynomial equations [18, 23, 28, 31], or, more
usually, to non-linear models [19]. However, the height curves
thus obtained for stands do not adapt well to all the possible
situations that can be found within a stand. This is for a
number of reasons:
1. The height curve of an even-aged stand does not remain
constant and is displaced in an increasing direction, for both
* Correspondence and reprints
Tel.: (34) 982 252231; fax: (34) 982 241835; e-mail:
238 C.A. López Sánchez et al.
variables, with age [2, 3, 12, 24, 39], i.e. trees that have the
same diameter at different times belong to sociologically
different classes. The height-diameter curve of a stand is
therefore a state function, which is different from the curve of
height growth of the stand with age.
2. The height curves for good quality sites will have steeper
slopes than those for poor quality sites [34].
3. Clearly, for a particular height, trees that grow in high
density stands will have smaller diameters than those growing
in less dense stands, because of greater competition among
individuals [4, 25, 34, 42].
Therefore, in even-aged stands, in which there is great
variation in age, quality and density between cohorts, a
single h-d relationship for the whole stand would be the result
of many different h-d relationships, with high variability
around the regression line. In such cases, to reduce the error
involved in estimating heights, the use of a generalised height-
diameter equation is recommended, which models the changes
in the height-diameter relationship over time [14].
The aim of the present study is to find an equation that can
be used to predict the height-diameter relationship in Pinus
radiata stands in Galicia (north-western Spain) by considering
a number of stand variables (dominant diameter, dominant
height, age, density, site index, etc.), which may influence the
relationship.
2. MATERIALS AND METHODS
2.1. Data used
For this study, total height and diameter at breast height data were
used from 355 inventories of a set of 182 permanent plots that the
Escuela Politécnica Superior de Lugo (University of Santiago de
Compostela) has established in pure, even-aged stands of Pinus
radiata D. Don throughout Galicia. The plots are square or
rectangular, with dimensions varying between 25 ´ 25 and 30 ´
40 metres. The number of trees per plot ranges between 30 and
145 depending on the stand density. The plots were installed to give
the greatest variety of combinations of age, density and site quality.
Data were collected in two stages; the plots were established and
the first inventory carried out between 1995 and 1996, and the second
inventory was carried out between 1998 and 1999. Between the two
measurements, plots located in thinned stands were remeasured, so
that some plots were inventoried three times.
In each plot the diameter at breast height of all of the trees was
crosswise measured, using calipers, to the nearest millimetre. Heights
were measured using a Blume-Leiss hypsometer in a sample of
30 trees chosen at random from all of the trees in the plot.
The following stand variables were calculated from the data
collected in the inventories: basal area, quadratic mean diameter,
maximum diameter, dominant diameter and height (using Assman's
criterion for both), mean height, age (because the stands are even-
aged, the age was calculated from the year of planting), density and
site quality, defined as the dominant height (expressed in metres) that
the stand reaches at 20 years and determined from the site quality
curves available for this specie in Galicia [35].
The mean, maximum and minimum values and standard
deviations of the main dendrometric and stand variables are given in
table I and table II, respectively.
2.2. Models analysed
A large number of generalised height-diameter equations have
been reported in the forestry literature, many of which have been
developed for a particular species or specific area. For this study, we
have considered the most commonly used, as well as those developed
for Pinus radiata. Finally, we analysed the 26 generalised height-
diameter equations given in table III; these are classified according to
the real sampling effort in the following groups:
Group 1: Low sampling effort models, including those models which
need diameter measurements and knowledge of age in some cases.
Group 2: Medium sampling effort models, including models which
need measurements of diameter and of a sample of tree heights.
Group 3: High sampling effort models, including models which need
the knowledge or measurements of stand age as well.
The terminology used in the description of the models is as follows:
h = total height of tree, in m; d = diameter at breast height over bark,
in cm; G = basal area of the stand, in m
2
ha
–1
; d
g
= quadratic mean
diameter of the stand, in cm; D
max
= maximum diameter of the stand,
in cm; D
0
= dominant diameter of the stand, in cm; H
0
= dominant
height of the stand, in m; H
m
= mean height of the stand, in m; t = age
of the stand, in years; N = number of trees per hectare; SI = site index,
in m; log = logarithm
10
; ln = natural logarithm; b
i
= regression
coefficients to be determined by model fitting.
The measurement of the mean height requires a greater sampling
effort that may allow the limitation of future use of models that
include this variable. To avoid this problem, it has been obtained a
relationship between the mean height and the dominant height of the
stand, the latter value being easier to obtain on field. The resulting
equation is the following: H
m
= –1.4497 + 0.9295 · H
o
(R
2
adj
=
0.9504; MSE = 1.4860).
Tabl e I. Characteristics of the tree samples used for model fitting.
Sample for model fitting
(N = 9686)
Variable Mean Maximum Minimum Standard deviation
h 17.29 36.40 3.00 6.19
d 23.90 62.95 5.00 11.93
Table II. Characteristics of the plots from which the samples of trees
used for model fitting were taken.
Sample for model fitting
(N = 9686)
Variable Mean Maximum Minimum Standard deviation
G 53.66 218.50 0.98 39.46
d
g
23.70 53.84 6.04 9.66
D
max
38.82 80.70 11.10 13.85
D
0
33.49 64.75 10.33 11.11
H
0
19.98 34.02 5.80 5.70
H
m
17.13 30.17 3.95 5.29
t 23.28 41.00 5.00 8.50
N 996.11 4864 216.70 550.42
IS 18.97 26.8 13.00 3.24
A height-diameter model for Pinus radiata 239
Estimations obtained with the above equation (instead of the
observed values) were used for the adjustment of the models that
include mean height of the stand (H
m
) as an independent variable.
2.3. Statistical analysis
Most of the models described above are non-linear, therefore
model fitting was carried out with the NLIN procedure of the SAS/
STATọ statistical programme [36] using the Gauss-Newton
algorithm [17]. The initial values of the parameters for starting the
iterative procedure were obtained, where possible, by previously
linearizing the equation and fitting it to the data by ordinary least
squares, using the REG procedure of the same statistical programme.
When it was not possible to linearize the equation, values obtained by
other authors in similar studies were used.
Comparison of the model estimates was based on graphical and
numerical analysis of the residuals and values of four statistics: the
bias , which evaluates the deviation of the model with respect to the
observed values; the mean square error (MSE), which analyses
the precision of the estimates; the adjusted coefficient of
determination (R
2
adj
), which reflects the part of the total variance that
is explained by the model and which takes into account the number
of parameters that it is necessary to estimate; and finally, the relative
values of Akaike's information criterion (D
j
), which is an index for
Table III. Generalized height-diameter models analyzed.
Author(s) Expression Group
Curtis [13] 1
Cox (I) [11] 1
Clutter
and Allison [10]
1
Mứnness [30]
2
Caủadas et al. I [8] 2
Caủadas et al.
II [8]
2
Caủadas et al.
III [8]
2
Caủadas et al.
IV [8]
2
Gaffrey [15] 2
Sloboda et al. [38] 2
Harrison et al. [16] 2
Castedo et al. [9]
Mod.*
2
Pienaar [33]
Mod.**
2
Hui and Gadow
[21]
2
Mirkovich [29] 2
Schrửder and
lvarez I [37] ***
2
Cox III [11]
Mod. ****
2
Schrửder and
lvarez II [37] ***
2
ữ
ữ
ứ
ử
ỗ
ỗ
ố
ổ
ì+ì+ì+
=
t.d
b
t
b
d
bb
g
h
111
3210
10
()
dbNbdbb
g
eh
ì+ì+ì+
=
3210
lnln
e
ữ
ứ
ử
ỗ
ố
ổ
ì+
ì
ì+ì+ì+
+=
t
N
b
td
b
t
b
d
bb
h
log111
43210
103.1
3
3
1
00
0
3.1
111
3.1
-
ỳ
ỳ
ỷ
ự
ờ
ờ
ở
ộ
ữ
ữ
ứ
ử
ỗ
ỗ
ố
ổ
-
+
ữ
ữ
ứ
ử
ỗ
ỗ
ố
ổ
-ì+=
HDd
bh
()
0
0
0
3.13.1
b
D
d
Hh
ữ
ữ
ứ
ử
ỗ
ỗ
ố
ổ
ì-+=
()
dDb
H
D
d
h
-ì+
-
+=
00
0
0
3.1
3.1
()
00
0
1
1
3.13.1
0
Db
db
e
e
Hh
ì
ì
-
-
ì-+=
e
e
2
2
1
00
0
3.1
111
3.1
-
ỳ
ỳ
ỷ
ự
ờ
ờ
ở
ộ
ữ
ữ
ứ
ử
ỗ
ỗ
ố
ổ
-
+
ữ
ữ
ứ
ử
ỗ
ỗ
ố
ổ
-ì+=
HDd
bh
()
ữ
ữ
ứ
ử
ỗ
ỗ
ố
ổ
-ì+
ữ
ữ
ứ
ử
ỗ
ỗ
ố
ổ
-ì
ì-+=
dd
b
d
d
b
g
g
eHh
11
1
0
10
3.13.1
e
()
ữ
ữ
ứ
ử
ỗ
ỗ
ố
ổ
-ì
ữ
ữ
ứ
ử
ỗ
ỗ
ố
ổ
ữ
ữ
ứ
ử
ỗ
ỗ
ố
ổ
-ì
ìì-+=
dd
d
b
d
d
b
m
g
g
eeHh
1
1
1
0
3.13.1
e e
m
()
ữ
ữ
ứ
ử
ỗ
ỗ
ố
ổ
-ìì+ì=
ì-
ì
0
2
01
11
00
H
db
Hb
eebHh
ee
()
2
1
0
000
3.1
3.1
b
b
d
dD
HHb
h
ữ
ữ
ứ
ử
ỗ
ỗ
ố
ổ
-
-ìì
+=
2
1
1
00
b
d
d.b
g
eHbh
ữ
ữ
ứ
ử
ỗ
ỗ
ố
ổ
-ìì=
-
e
3
021
00
3.1
b
Hb
b
dHbh
ì
ìì+=
()
d
b
g
edbHbbh
3
2010
3.1
-
ìì-ì++=
e
g
()
d
b
g
edbHbbh
3
2010
3.1
-
ìì-ì++=
e
g
ỳ
ỳ
ỳ
ỳ
ỳ
ỳ
ỷ
ự
ờ
ờ
ờ
ờ
ờ
ờ
ở
ộ
ìì
ì+
++ì+ì+
ì=
d
dHd
N
b
db
d
H
bHbb
Hh
gmg
g
m
m
m
)(
.
4
3210
m
m
m
m
g
g
g
()
d
b
g
eGbdbHbbh
4
32010
3.1
-
ìì+ì-ì++=
e
g
Cox II [11]
Mod. 1 ****
2
Cox II [11]
Mod. 2 ****
2
Tomộ [40]
3
Bennet
and Clutter [5]
3
Lenhart [27] 3
Amateis et al. [1] 3
Burkhart
and Strub [6]
3
Pascoa [32] 3
* Generalized height-diameter function obtained relating the parame-
ters of S
BB
function [22] to stand variables.
** Modification of the original model omitting the parameter associa-
ted with the number e as its value was close to one and the asympto-
tic standard error was very high.
*** Modifications of the model of Mirkovich [29] to reduce the bias in
the height estimates.
**** Modification of the original model using the arithmetic mean hei-
ght of the stand (H
m
) as the independent variable instead of the mean
value of the maximum and minimum stand heights, which are harder to
measure in the field.
d
g
d
m
d
gm
edbeHb
ebdbHbbh
ì-ì-
ì-
ìì+ìì+
+ì+ì+ì+=
08.03
5
08.03
4
08.0
3
95.0
210
e
ee
m
m
g
g
dbb
g
dbb
m
db
gm
edbeHb
ebdbHbbh
ìì
ì
ìì+ìì+
+ì+ì+ì+=
4846
4
75
3210
e
e
e
m
m
g
g
ữ
ữ
ứ
ử
ỗ
ỗ
ố
ổ
-ì
ữ
ứ
ử
ỗ
ố
ổ
ì+ì+ì+
ì=
0
32010
11
000,1
0
Dd
tb
N
bHbb
eHh e
d
b
t
b
N
bISbb
eh
11
100
43210
ì+ì+ì+ì+
=
e
h
H
0
e
b
0
1
d
1
D
max
ốứ
ổử
b
1
b
2
Nln b
3
1
t
b
4
H
0
lnì+ì+ì+
ốứ
ổử
ì+
=
ữ
ữ
ứ
ử
ỗ
ỗ
ố
ổ
ữ
ứ
ử
ỗ
ố
ổ
ì+ì
ữ
ữ
ứ
ử
ỗ
ỗ
ố
ổ
-+
ìì=
t
N
bb
Ddt
b
b
Hbh
log11
00
43
max
2
1
10
d
b
td
b
d
N
b
t
bHbb
eh
11ln1
ln
5432010
ì+
ì
ì+ì+ì+ì+
= e
d
b
t
b
bbb
eNGHbh
54
321
00
+
ìììì=
e
i
Z
240 C.A. López Sánchez et al.
selecting the best model, based on minimising the Kullback-Liebler
distance [7]. The expressions for these statistics are as follows:
Bias: ;
Mean square error: ;
Coefficient of determination: ;
Adjusted coefficient of determination:
Akaike's information criterion differences:
where Y
i
, and are the observed, predicted and mean values of
heights, respectively; N is the total number of data used in fitting the
model; p the number of parameters to estimate; R
2
the coefficient of
determination; K
j
the number of parameters in model j plus 1 (K
j
=
p+1) and an estimate of the error variance of model j, calculated
as: .
To analyse the predictive capacity of the equations a cross-validation
was carried out. The values of the prediction residuals obtained in the
cross-validation were used to calculate the bias, mean square error
(MSE), Akaike’s information criterion differences ( ) and the
precision of the model (MEF
adj
):
where Z
i
and are the observed and mean values of heights,
respectively, is the prediction residual; N’ is the total number of
data used and p is the number of parameters to be estimated.
To evaluate the possible existence of bias, the linear model
([20, 41]) was fitted, and a F-test was used to check
the null hypothesis (the absence of bias) i.e. that the slope of the
straight line was equal to 1 at the same time as the independent term
(b) was equal to 0.
3. RESULTS
3.1. Model fitting phase
In order to be able to interpret and compare the results more
easily and because of the large number of equations analysed,
the models were classified in three groups according to the
sampling effort, as pointed out in the Materials and Methods
section above.
Tables IV, V and VI show the values of the statistics used to
compare the models in the fitting phase and in the cross-
validation for the groups 1, 2 and 3 respectively.
The results of fitting and cross-validation for the models of
group 1 are the poorest, as could be expected. The use of
independent variables related only with either the diametrical
distribution or with the age of the stand does not appear to be
sufficient explanation for the variability observed on height
values. Therefore, it is advisable the inclusion of an additional
variable in order to improve the estimates.
Finally, it’s important to emphasise the poor behaviour of
the model of Clutter and Allison [10], in spite of this model
was used to estimate the height of individual trees in a growth
model for Pinus radiata in New Zealand.
The values of the statistics of the models included in the
group 2 (table V) show that the second modification of the Cox
[11] model (Cox II, Mod. 2) is the equation of this group that
most accurately estimates the height. This equation improves
the accuracy of the first modification (Cox II, Mod. 1) due to
the lack of restrictions for the values of the exponent of the
independent variables. Only the exponent affecting d
g
has
been restricted, due to a lack of convergence. The good results
obtained with this model are consistent with those obtained by
Cox [11] for the same species (Pinus radiata) in Chile.
The models of Møness [30] and Cañadas et al. IV [8] also
fit well to the data. The advantage of these models is that they
are functions of one single parameter, although the bias and
MSE were slightly higher than those of the modified versions
of the model of Cox II [11].
Table IV. Values of the statistics for fitting and cross-validation for group 1 models.
MODELS FIT CROSS - VALIDATION
Vari abl es R
2
adj
Bias MSE MEF
adj
pred. vs. obs. F-Test Bias MSE
F VAL. Pr > F
Curtis [13] d, d
g
, t 0.7515 0.0567 9.5314 10727.1099 0.7512 17.56 < 0.0001 0.0569 9.5393 10720.3448
Cox I [11] d, d
g
, N 0.7362 –0.0563 10.1168 11304.4445 0.7359 18.71 < 0.0001 –0.0565 10.1272 11299.5841
Clutter and Allison [10] d, t, N 0.7317 0.0382 10.2890 11468.9820 0.7311 6.87 0.001 0.0387 10.3093 11473.2493
i
D
j
i
D
j
()
N
YY
E
N
i
ii
å
=
-
=
1
ˆ
()
pN
YY
MSE
N
i
ii
-
-
=
å
=1
2
ˆ
å
å
=
-
=
-
-
=
N
i
ii
N
i
ii
Y(Y
Y(Y
-1 R
1
2
1
2
2
)
)
ˆ
–
l
()
÷
÷
ø
ö
ç
ç
è
æ
-
-
=
pN
N
RR
1
. -1-1
22
adj
– –
;
)·2
ˆ
ln·min(·2
ˆ
ln·
22
jjjjj
KNKN +-+=D ss
;
i
Y
ˆ
i
Y
2
ˆ
s
()
N
YY
N
i
ii
å
=
-
=
1
2
2
ˆ
ˆ
s
2
ˆ
s
i
D
÷
÷
ø
ö
ç
ç
è
æ
-
-
-
-
=
å
å
=
-
=
pN
N
Z
MEF
N
i
i
N
i
i
'
1'
.
)Z(Z
)
ˆ
(Z
-1
'
1
2
i
'
1
2
i
2
adj
–
-
i
Z
i
Z
ˆ
bZ
ˆ
aZ
ii
+×=
A height-diameter model for Pinus radiata 241
The six models classified in group 3 (table VI) have similar
results to those of group 2, although the model of Tomé [40]
gives the best performance of all the models tested, according
to the values of the statistics used to compare the models in the
fitting phase and the cross-validation. The results were slightly
better than those obtained with the model of Cox II [11] when
the values of the exponents of the independent variables were
not restricted.
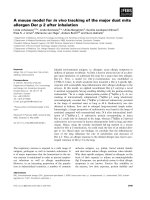
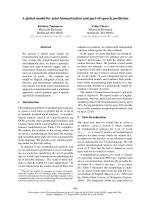
Plot of residuals versus the heights predicted in the fitting
phase of the model of Tomé [40] are shown in figure 1. There
was no reason to reject the hypotheses of normality,
homogeneity of variance and independence of residuals.
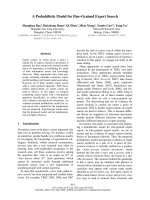
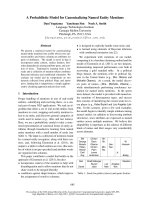
Plot of the observed heights versus the predicted heights in
the cross-validation of this model are shown in figure 2. The
criterion to evaluate the behaviour of the model was the
determination coefficient of the straight line fitted between the
observed and predicted heights. The chart shows no tendency
toward the overestimation or underestimation of height values.
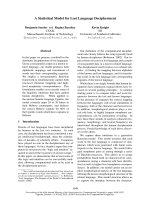
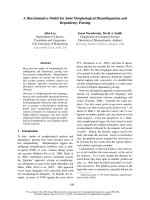
To analyse the behaviour of the two best models (Tomé
[40] and Cox II [11] Mod. 2) the values of the bias and the
Table V. Values of the statistics for fitting and cross-validation for group 2 models.
MODELS FIT CROSS - VALIDATION
Va ri abl es R
2
adj
Bias MSE MEF
adj
pred. vs. obs. F-Test Bias MSE
F VAL. Pr > F
MØnness [30] d, D
0,
H
0
0.9130 0.0399 3.3371 558.7367 0.9129 42.29 < 0.0001 0.0399 3.3382 547.1393
Cañadas et al. I [8] d, D
0,
H
0
0.9093 0.0909 3.4771 956.7995 0.9093 142.46 < 0.0001 0.0908 3.4782 946.1194
Cañadas et al. II [8] d, D
0,
H
0
0.8895 0.5730 4.2357 2869.4106 0.8904 748.95 < 0.0001 0.5728 4.2391 2862.2331
Cañadas et al. III [8] d, D
0,
H
0
0.9090 0.1743 3.4893 991.6849 0.9090 167.04 < 0.0001 0.1742 3.4908 981.0705
Cañadas et al. IV [8] d, D
0,
H
0
0.9145 0.0361 3.2760 379.8576 0.9145 6.06 0.0023 0.0361 3.2771 368.2144
Gaffrey [15] d, d
g
, H
0
0.7772 –2.1953 8.5411 9662.6009 0.8020 6666.1 < 0.0001 –2.1957 8.5448 9651.9901
Sloboda et al. [38] d, d
g
, H
m
0.8765 –0.0258 4.7334 3945.4715 0.8764 1.46 0.2328 –0.0259 4.7374 3940.9090
Harrison et al. [16] d, H
0
0.8992 –0.0307 3.8654 1987.2401 0.8991 10.46 < 0.0001 –0.0307 3.8681 1979.2874
Castedo et al. [9] Mod. d, H
0
0.8575 –0.0336 5.4655 5339.3047 0.8573 8.9 0.0001 –0.0339 5.4720 5336.1777
Pienaar [33] Mod. d, d
g
, H
0
0.9039 –0.0960 3.6846 1520.2139 0.9038 132.39 < 0.0001 –0.0960 3.6873 1512.5555
Hui and Gadow [21] d, H
0
0.8858 –0.0160 4.3818 3203.8350 0.8856 2.41 0.0896 –0.0162 4.3860 3198.4347
Mirkovich [29] d, d
g
, H
0
0.9055 0.0273 3.6246 1362.2359 0.9054 8.18 0.0003 0.0273 3.6283 1357.3113
Schröder and Álvarez I, [37] d, d
g
, H
0
0.9106 –0.0041 3.4291 825.0991 0.9105 0.19 0.8285 –0.0041 3.4325 820.0672
Cox III [11] Mod. d, d
g
, H
m
, N 0.8763 –0.0032 4.7428 3967.6250 0.8761 0.1 0.9085 –0.0036 4.7503 3973.1747
Schröder and Álvarez II [37] d, G, d
g
, H
0
0.9106 –0.0041 3.4292 826.3648 0.9104 0.19 0.8271 –0.0042 3.4335 823.9297
Cox II [11] Mod. 1 d, d
g
, H
m
0.9135 0.0000 3.3168 504.6334 0.9133 0 0.9993 0.0002 3.3232 508.4968
Cox II [11] Mod. 2 d, d
g
, H
m
0.9156 0.0000 3.2367 270.9605 0.9153 0.00 0.9986 0.0001 3.2453 281.8632
Tabl e VI. Values of the statistics for fitting and cross-validation for group 3 models.
MODELS FIT CROSS - VALIDATION
Var ia bles R
2
adj
Bias MSE MEF
adj
pred. vs. obs. F-Test Bias MSE
F VAL. Pr > F
Tomé [40] d, D
0
,
H
0
, t, N 0.9179 –0.0028 3.1491 0.0000 0.9178 0.21 0.812 –0.0029 3.1526 0.0000
Bennet and Clutter [5] d, t, N, IS 0.8574 0.0379 5.4701 5349.6127 0.8568 12.8 < 0.0001 0.0382 5.4896 5369.1342
Lenhart [27] d, H
0
, t, N, D
max
0.9118 0.0221 3.3821 697.4526 0.9117 6.61 0.0013 0.0221 3.3865 695.4285
Amateis et al. [1] d, H
0
, t, N, D
max
0.9113 0.0107 3.4028 751.6177 0.9110 1.63 0.196 0.0105 3.4108 759.5348
Burkhart and Strub [6] d, H
0
, t, N, 0.9065 0.0152 3.5857 1259.8154 0.9063 3.02 0.049 0.0150 3.5914 1260.2069
Pascoa [32] d, H
0
, t, G 0.9005 0.0399 3.8157 1861.7774 0.9003 19.03 < 0.0001 0.0397 3.8220 1863.1169
i
D
i
D
i
D
i
D
242 C.A. López Sánchez et al.
mean square error were calculated and plotted against
diameter classes, for the fitting phase and the cross-validation.
(figures 3 and 4).
Despite a slight trend to overestimation for the higher diam-
eter classes, the model proposed by Tomé [40], which includes
five independent variables, gives a better performance.
The good performance of this model may be due, in part, to
the inclusion of the stand age, which is an important variable
in the consideration of even-aged, uniform stands [8] (which
the stands in plantations usually are) because, in these cases,
the age gives an indication of the mean size of the individual
trees in the stand.
In general, the inclusion of new independent variables in
the height-diameter equation reduced bias and increased the
precision of the model. However, the increase in accuracy of
the estimations is usually associated with a larger sampling
-10
-8
-6
-4
-2
0
2
4
6
8
10
0 5 10 15 20 25 30 35 40
predicted (m)
residuals (m)
Figure 1. Plot of residuals versus predicted values in the fitting phase for the model of Tomé [40].
Figure 2. Plot of observed values versus predicted values in the cross-validation for model of Tomé [40]. The solid line represents the linear
model fitted to the scatter plot of data. The dotted line represents the diagonal.
A height-diameter model for Pinus radiata 243
effort due to the greater number of independent variables that
must be measured in the field. The model of Tomé [40] could
offer a balance between the accuracy of the model and the
sampling effort, because the value of age is well-known if the
date of plantation is available.
4. CONCLUSIONS
The inclusion of the mean height or of the dominant height
as an independent variable in the height-diameter equations
appears to be necessary in order to achieve acceptable
predictions. This requires the measurement of at least one
sample of heights for the practical application of the equation.
The best predictions of height were obtained by the model
of Tomé [40], which uses diameter (d), dominant diameter
(D
0
), dominant height (H
0
), age (t) and number of trees per
hectare (N) as independent variables; this was followed in
performance by the modified version 2 of the model of Cox II
[11], which depends on three variables (d, d
g
, H
m
).
Aknowledgements: This study was financed by the Comisión
Interministerial de Ciencia y Tecnología (CICYT) and the European
Commission, project No 1FD97-0585-C03-03.
Figure 3. Values of (a) bias and (b) mean square error obtained for diameter classes in the fitting phase of the two best models (Tomé [40] and
Cox II [11] Mod. 2).
(a)
(b)
244 C.A. López Sánchez et al.
REFERENCES
[1] Amateis R.L., Burkhart H.E., Zhang S., TRULOB: Tree Register
Updating for Loblolly Pine (an individual tree growth and yield
model for managed loblolly pine plantations). Coop. Rep. 83.
Blacksburg, VA: Virginia Polytechnic Institute and State
University, Departament of Forestry, Loblolly Pine Growth and
Yield Cooperative, 1995.
[2] Assmann E., Untersuchungen über die Höhenkurven von
Fichtenbeständen, AFJZ, 1943.
[3] Assmann E., The principles of Forest Yield Study, Pergamon Press,
Oxford, 1970.
[4] Bailey R.L., Brooks J.R., Determining site index and estimating
timber volumes without measuring heights, South. J. Appl. For. 18
(1994) 15–18.
[5] Bennett F.A., Clutter J.L., Multiple-product yield estimates for
unthinned slash pine plantations-pulpwood, sawtimber, gum,
U.S.D.A. For. Serv. Res. Pap. SE-35, 1968.
[6] Burkhart H.E., Strub M.R., A model for simulation of planted
loblolly pine stands, in: Fries J. (Ed.), Growth Models for Tree and
Stand Simulation, Royal College of Forestry, Research Note 30,
Stockholm, 1974, pp. 128–135.
[7] Burnham K.P., Anderson D.R., Model selection and inference: a
practical information-theoretic approach, Springer-Verlag, New
York, 1998.
(a)
(b)
Figure 4. Values of (a) bias and (b) mean square error obtained for diameter classes in the cross-validation of the two best models (Tomé [40]
and Cox II [11] Mod. 2).
A height-diameter model for Pinus radiata 245
[8] Caủadas N., Garcớa C., Montero G., Relaciún altura-diỏmetro para
Pinus pinea L. en el Sistema Central, in: Actas del Congreso de
Ordenaciún y Gestiún Sostenible de Montes, 1999 (in press).
[9] Castedo F., Ruiz A.D., lvarez Gonzỏlez J.G., Modelizaciún de la
relaciún altura-diỏmetro para Pinus pinaster Ait. en Galicia
mediante la funciún de densidad bivariante S
BB
, Investigaciún
Agraria, Sistemas y Recursos Forestales 10 (2001) 111126.
[10] Clutter J.L., Allison B.J., A growth and yield model for Pinus
radiata in New Zealand, in: Fries J. (Ed.), Growth Models for Tree
and Stand Simulation, Royal College of Forestry, Research Note
30, Stockholm, 1974, pp. 136160.
[11] Cox F., Modelos parametrizados de altura, Informe de convenio de
investigaciún interempresas, 1994.
[12] Curtis R.O., Height-diameter and height-diameter-age equations
for second-growth Douglas-fir, For. Sci. 13 (1967) 365375.
[13] Curtis R.O., Stand density measures: an interpretation, For. Sci. 16
(1970) 303314.
[14] Gadow K.V., Waldwachstum. Beilage zur Vorlesung fỹr das
Sommersemester. Universitọt Gửttingen, 2001.
[15] Gaffrey D., Forstamts-und bestandesindividuelles Sortimentie-
rungsprogramm als Mittel zur Planung, Aushaltung und Simula-
tion. Diplomarbeit Forscliche Fakultọt, Universitọt Gửttingen,
1988.
[16] Harrison W.C., Burk T.E., Beck D.E., Individual tree basal area
increment and total height equations for Appalachian mixed
hardwoods after thinning, South. J. Appl. For. 10 (1986) 99104.
[17] Hartley H.O., The modified Gauss-Newton method for the fitting of
nonlinear regression functions by least squares, Technometrics 3
(1961) 269280.
[18] Hohenadl W., Die Bestandesmessung, Fw. Cbl., 1936.
[19] Huang S., Titus S.J., Wiens D., Comparison of nonlinear height-
diameter functions for major Alberta tree species, Can. J. For. Res.
22 (1992) 12971304.
[20] Hui G., Gadow K.v., Modelling Forest Development, Kluwer
Academic Publishers, 1999.
[21] Hui G., Gadow K.v., Zur Entwicklung von Einheitshửhenkurven
am Beispiel der Baumart Cunninghamia lanceolata, AFJZ 164
(1993) 218220.
[22] Johnson N.L., Bivariate distributions based on simple translation
systems, Biometrika 36 (1949) 297304.
[23] Krenn K., Die Bestandesmassenermittlung mit Hilfe stehender
Probestọmme, Frankfurt/M., 1944.
[24] Lappi J., A longitudinal analysis of Height/Diameter curves, For.
Sci. 43 (1997) 555570.
[25] Larsen D.R., Hann D.W., Height-diameter equations for seventeen
tree species in southwest Oregon, Oreg. State. Univ. For. Res. Lab.
46, 1987.
[26] Laar A.v., Akỗa A., Forest Mensuration. 1. Aufl., Cuvillier Verlag,
Gửttingen, 1997.
[27] Lenhart J.D., Yield of old-field loblolly pine plantations in the
Georgia Piedmont, Ph. D. Thesis, Univ. Ga., Athens, 1968.
[28] Michailoff J.L., ĩber die Anwendung der Methode der Kleinsten
Quadrate bei der Aufstellung von Massentafeln mit einem
Eingange, Skopie, 1951.
[29] Mirkovich J.L., Normale visinske krive za chrast kitnak i bukvu v
NR Srbiji. Zagreb. Glasnik sumarskog fakulteta 13, 1958.
[30] Mứnness E.N., Diameter distributions and height curves in even-
aged stands of Pinus sylvestris L., Medd. No. Inst. Skogforsk 36
(1982) 143.
[31] Naslund M., Die Durchforstungsversuche der forstlichen
Versuchsanstalt Schwedens im Krefernwald, M.S.S., 1937.
[32] Pascoa F., Estructura, crecimento e produỗao em povoamentos de
pinheiro bravo. Um modelo de simulaỗao, Ph. D. thesis,
Universidade Tộcnica de Lisboa, 1987.
[33] Pienaar L.V., PMRC Yield Prediction System for Slash Pine
Plantations in the Atlantic Coast Flatwoods, PMRC Technical
Report, Athens, 1991.
[34] Prodan M., Peters R., Cox F., Real P., Mensura Forestal. Instituto
Interamericano de Cooperaciún para la Agricultura (IICA), Costa
Rica, 1997.
[35] Sỏnchez F., Rodrớguez R., Rojo A., lvarez J., Resultados
preliminares del estudio de curvas de calidad de estaciún y de los
factores ecolúgicos implicados en la productividad de Pinus
radiata D. Don en Galicia (Espaủa), in: Actas del Primer Congreso
Latinoamericano IUFRO: El manejo sustentable de los recursos
forestales, desafớo del siglo XXI, 1998.
[36] SAS INSTITUTE INC., SAS/STAT
TM
Users guide, Release 8.0
Edn, Cary, NC, USA, 1999.
[37] Schrửder J., lvarez Gonzỏlez J.G., Developing a generalized
diameter-height model for maritime pine in Northwestern Spain,
Forstwissenschaftliches Centralblatt 120 (2001) 1823.
[38] Sloboda V.B., Gaffrey D., Matsumura N., Regionale und lokale
Systeme von Hửhenkurven fỹr gleichaltrige Waldbestọnde, Allg.
Forst. Jagdztg. 164 (1993) 225228.
[39] Speidel E., Beitrọge zu den Wuchsgesetzen des Hochwaldes und
der Durchforstunsglehre, Tỹbingen, 1983.
[40] Tomộ M., Modelaỗao do crescimento da ỏrvore individual em
povoamentos de Eucalyptus globulus Labill. (1ê rotaỗao) na regiao
centro de Portugal, Ph. D. Thesis, Instituto Superior de Agronomớa,
Lisboa, Portugal, 1989.
[41] Vanclay J.K., Modelling forest growth-applications to mixed
tropical forests, CAB International, Wallingford, 1994.
[42] Zhang S.A., Burkhart H.E., Amateis R.L., The influence of
thinning on tree height and diameter relationships in loblolly pine
plantations, South. J. Appl. For. 21 (1997) 199205.
To access this journal online:
www.edpsciences.org