Báo cáo lâm nghiệp: "A fractal root model applied for estimating the root biomass and architecture in two tropical legume tree species" pps
Bạn đang xem bản rút gọn của tài liệu. Xem và tải ngay bản đầy đủ của tài liệu tại đây (608.56 KB, 9 trang )
337
Ann. For. Sci. 61 (2004) 337–345
© INRA, EDP Sciences, 2004
DOI: 10.1051/forest:2004027
Original article
A fractal root model applied for estimating the root biomass
and architecture in two tropical legume tree species
Eduardo SALAS
a
, Harry OZIER-LAFONTAINE
b
, Pekka NYGREN
c
*
a
Escuela de Fitotecnia, Universidad de Costa Rica, Ciudad Universitaria “Rodrigo Facio”, San Pedro de Montes de Oca, Costa Rica
b
UR Agropédoclimatique, INRA, Centre Antilles-Guyane, Domaine Duclos, 97170 Petit Bourg, Guadeloupe, France
c
Department of Forest Ecology, PO Box 27, 00014 University of Helsinki, Finland
(Received 31 January 2003; accepted 20 August 2003)
Abstract – A fractal root model with parameter estimation based on pipe model theory was applied for studying root architecture of Erythrina
lanceolata and Gliricidia sepium associated with crops in agroforestry. The results were compared with a theoretical volume-filling fractal
model on scaling of plant vascular system. Scaling of root diameter at bifurcation followed same parameter values over the whole root system.
The parameter values were approximately equal in both species. Length between two bifurcations could not be estimated according to volume-
filling fractal principles, but an empirical regression was used. An empirical model was also applied for estimating bifurcation angles. These
characteristics seem to respond strongly to local root environment, and their modelling calls for studying root-soil interactions. Agronomic
applications of this study indicate the usefulness of an architectural approach for the study of belowground interactions in agroforestry systems.
Erythrina lanceolata / Gliricidia sepium / agroforestry / pipe model / self-similarity
Résumé – Application d’un modèle racinaire fractal à l’estimation de la biomasse et de l’architecture racinaire de deux espèces
d’arbres légumineux. Un modèle racinaire fractal dont l’estimation des paramètres repose sur la théorie du « modèle vasculaire » a été appli-
qué à l’étude de l’architecture de Erythrina lanceolata et Gliricidia sepium cultivés dans des systèmes agroforestiers. Ce modèle a été confronté
à un modèle fractal théorique dédié à la simulation du système vasculaire de plantes. La diminution de la section conductrice au niveau de cha-
que ramification demeure indépendante du diamètre, et peut-être considérée comme étant invariable à l’échelle de l’ensemble du système raci-
naire. Les valeurs des paramètres d’échelle sont approximativement équivalentes pour les deux espèces. La distance entre deux ramifications
n’a pas pu être estimée à partir du deuxième modèle, aussi a-t-elle été estimée à partir d’une régression empirique. Un modèle empirique a éga-
lement été utilisé pour l’estimation de la distribution des angles de ramifications. Ces modalités sont typiques d’interactions fortes avec les
caractéristiques de l’environnement local, et leur modélisation nécessite une étude approfondie des interactions sol-racines. Cette étude débou-
che sur des considérations agronomiques qui montrent l’utilité d’approches architecturales pour l’amélioration de la gestion des interactions
souterraines dans les systèmes agroforestiers.
Erythrina lanceolata / Gliricidia sepium / agroforesterie / modèle vasculaire / autosimilarité
1. INTRODUCTION
Root system studies are necessary for understanding the
tree-crop interactions in agroforestry systems [15]. This objective
calls for studies of three-dimensional (3D) root architecture,
because sharing of soil space also strongly affects the sharing
of soil resources [12].
Field description of root architecture is a challenging task,
and most conventional root sampling techniques are inade-
quate. Auger sampling of known soil volumes provides reliable
estimates of biomass and length distribution of fine roots [11,
18], but coarse roots are too sparsely situated in the soil to be
reliably studied by this method; trench wall methods provide
information on the local root distribution, but the laborious dig-
ging usually impedes the excavation of enough repetitions for
quantitative estimates [3]; finally, the complete exposure of a
root system provides all necessary information, but it may be
prohibitively expensive if applied to several trees, and it may
cause severe disturbance to the crop production. Due to these
inadequacies, modelling techniques have been proposed to deal
with the architectural description [5, 10]. Parameterisation and
validation of a root architecture model requires the excavation
of complete root systems, or at least large representative parts
of them, but in a smaller scale than in purely descriptive meth-
ods.
Van Noordwijk et al. [21, 25] proposed that fractal geometry
combined with parameter estimation based on the pipe model
theory [19] could be applied for describing tree root architecture.
The pipe model of vascular plants is shown to be a special case
of the more general fractal branching and scaling pattern in a
* Corresponding author:
338 E. Salas et al.
variety of biological systems [26], and it thus is a valid basis
for estimating the fractal parameters of a root system. Further,
it has been proposed that based on fractal geometry assump-
tions, an index of tree root competitiveness may be estimated
by exposing the proximal roots, or roots directly attached to the
root collar, and measuring their vertical insertion angle and
diameter. Competitiveness index is calculated as the ratio of the
sum of squared diameters of horizontal roots (insertion angle
< 45°) to the squared diameter of the stem [24]. If the fractal
assumptions hold, the index provides a simple means to esti-
mate tree root competitiveness.
The self-similarity principle [13] defines an object that
maintains similar form over a range of scales. This principle
applied to a tree root system predicts that roots follow the same
bifurcation pattern from proximal roots to the smallest transport
roots. Water and nutrient absorbing fine roots are not consid-
ered here, as they are functionally different from the water and
nutrient transporting coarse roots and may follow different
growth patterns [20]. The basic parameters of fractal root mod-
els describe the ratio of the sum of root cross-sectional areas
after a bifurcation to the cross-sectional area before bifurcation,
α
, and the distribution of the cross-sectional areas after bifur-
cation, q [21, 25].
Independency of ratios
α
and q on root diameters has been
observed in tropical legume trees over a large range of diame-
ters [16, 23]. However, large variability within the whole root
system was observed, which affected the precision of the root
length and biomass estimates and the architecture generated by
the model. Further, the model had low aptitude for predicting
root lengths, and other fitting possibilities need to be studied
[16]. West et al. [27] presented a general fractal allometric
model for vascular plants, which takes into account the tapering
of the water conducting vessels. Model parameters are derived
from fractal geometry and hydrodynamics rather than from
empirical observations. The model has been developed for
plant shoots. As transport roots form part of the same water con-
ducting system, similar allometric principles should apply to
root and shoot.
In addition to these aspects related to the improvement of
α
,
q and root length prediction, there is a need to investigate the
global relevance of these concepts when applied to other spe-
cies. The objective of our contribution is to research the ways
of improving the accuracy of the fractal root model as formu-
lated by van Noordwijk et al. [21, 25] for describing the archi-
tecture of a tree root system, and predicting root biomass and
length. We applied the model to two tropical legume trees,
Erythrina lanceolata Standley (Papilionaceae: Phaseoleae)
and Gliricidia sepium (Jacq.) Kunth ex Walp. (Papilionaceae:
Robinieae). We also studied relationships between scaling
parameters of the models of van Noordwijk et al. [21, 25] and
West et al. [27], and the applicability of the latter for predicting
average link length of lateral roots.
2. MATERIALS AND METHODS
2.1. The fractal root models
Topology of the root system of a G. sepium or an E. lanceolata was
described as a network of connected links whose length and diameter
are root order dependent [21, 25]. At a given bifurcation event, a root
segment, or link (order n, link i) is divided into several new links that
forms the next higher order (order n + 1, link j).
Root architecture is designed using a recursive algorithm [16]. The
algorithm is applied until the final branch of the network, roots of min-
imum diameter D
m
are reached. Here, we applied the D
m
of 5 mm.
The scaling factor
α
is defined as the ratio of the square of root diameter
before bifurcation ( ) to the sum of squares of the diameters of bifur-
cating roots (Σ ):
. (1)
The allocation factor of root cross-sectional area, q, is estimated:
. (2)
Mathematical details are provided in [21, 25], and the model algo-
rithm is described in [16].
Root bifurcation angle was estimated stochastically from field data.
First, the relative frequency distribution of both vertical and horizontal
bifurcation angles in 0.175 rad (10°) classes was generated from field
data. From this distribution, the cumulative frequency range that cor-
responds to each class was computed. A random number between 0
and 100 was generated using the ‘runif()’ function of the S-Plus soft-
ware [22]. The random number was compared with the cumulative fre-
quency series, and the angle within the probability range of which the
random number corresponded, was used as the angle of the following
bifurcation. This algorithm provides reliable estimates of the root bifur-
cation angles independently of the form and density of the angle dis-
tribution, and no fitting of a theoretical distribution to data is necessary.
Full application of the model of West et al. [27] would require infor-
mation on vessel diameter that was not available. However, scaling
of the total cross-sectional area before and after bifurcation is compa-
rable between the model presented above and that of West et al. [27].
The scaling is estimated:
(3)
where A
a
is the average cross-sectional area of bifurcating roots, A
b
is the cross-sectional area before bifurcation, n is the number of new
links and a is a scaling parameter. When a is 1, the model reduces to
the classical area preserving pipe model [19]. The ratio nA
a
/A
b
is equal
to
Σ / . Thus:
. (4)
Introducing α to equation (3) gives:
. (5)
Equation (5) simplifies to:
n
a
=
α
n. (6)
The parameter a is thus the n-based logarithm of the product αn:
a = log
n
α
n.(7)
For a volume-filling network, the relationship between link length of
order i +1 (l
i+1
) and i (l
i
) is related to the number of new links (n) [27]:
. (8)
In this study, the value of n is 2 for all applications of equations (3)
to (8).
2.2. Field observations for model parameterisation
2.2.1. Measurements
Field measurements for model parameterisation differed slightly
between E. lanceolata and G. sepium. However, the variables measured
D
b
2
D
a
2
2
a
2
b
DD Σ=α
(
)
2
a
2
a
max DDq Σ=
a
nAnA
−
=
1
b
a
D
a
2
D
b
2
b
a
1
AnA=
−
α
a
n
−−
=
11
α
31
i1i
−
+
= nll
Fractals for root biomass and architecture 339
in exposed root systems were similar for both species: (i) link order
and number following the topology presented in [16], (ii) link diameter
before each bifurcation, and diameters of the bifurcating links, (iii) link
length L
i
, (iv) vertical and horizontal angle between the bifurcating
links (bifurcation angle) to closest 10°, (v) stem diameter above the root
collar of the measurement trees, and (vi) relationship between fresh root
volume and dry mass.
2.2.2. Erythrina lanceolata experiment
The field data on Erythrina lanceolata was measured in the exper-
imental farm of the Costa Rican Ministry of Agriculture and Animal
Husbandry (MAG) close to Quepos, Costa Rica (9° 26’ N, 84° 09’ W,
20 m asl.). In Damas (9° 03’ N, 84° 13’ W, 6 m a.s.l.), the closest
meteorological station of the Costa Rican National Meteorological
Institute, the 15-yr monthly average of temperature maxima vary from
30 °C (November) to 32 °C (February through April) and minima
from 21 °C (January) to 23 °C (April through June). Annual rainfall
varies from 3 000 to 4 000 mm, with a relatively dry season from Jan-
uary through March, when potential evapotranspiration exceeds pre-
cipitation. The soil characteristics are summarised in Table I.
Erythrina lanceolata was planted as a shade and support tree for
vanilla (Vanilla planifolia L.) in 1993. Trees were planted over
2 300 m
2
on a 2 × 3 m spacing (1 667 trees·ha
–1
). About a quarter of
the area was reserved for testing a vanilla variety new to the region,
and the rest was used for commercial vanilla cultivation. Trees in the
commercial plantation were partially pruned once or twice a year, and
trees in the variety trial plot were pruned at a lower frequency. No prun-
ings in the variety trial area were done during the two years preceding
this study.
The plantation was divided into four plots of 99 trees in June 1997.
Three pruning regimes of E. lanceolata were assigned to the plots:
(i) complete pruning every six months (T-6), (ii) partial, ca. 50%,
pruning every three months (P-3), and (iii) an intact control (C). Under
the fourth pruning regime, complete pruning every three months, all
trees died within a year [2]. Pruned plots were situated in the commer-
cial plantation area, and the control plot was situated in the vanilla variety
trial.
Eighteen months after the beginning of the pruning regimes
(November 1998), a tree from each regime (C, T-6 and P-3) was ran-
domly selected for root architecture studies. The root system was com-
pletely exposed in a 90° sector from the stem. The roots were carefully
dug one by one in order to avoid changes in their position. The roots
were exposed to the minimum diameter of 5 mm, and the variables
described above were measured.
In April 1999, three trees from each pruning treatment were ran-
domly selected for a more detailed study of the proximal roots. All
proximal roots were exposed. In addition to the data recorded for the
roots in the complete root system exposure, the diameter difference
between the point of insertion to root collar (below the initial thick-
ening) and first bifurcation was recorded.
2.2.3. Gliricidia sepium experiment
Field data on Gliricidia sepium was measured at the experimental
farm of the Antillean Research Centre of the Institut National de la Recher-
che Agronomique (INRA) in Prise d’Eau, Guadeloupe (16° 12’ N,
61° 39’ W, 125 m a.s.l.). The monthly average of temperature maxima
varies from 28 °C (December through March) to 30 °C (August
through October) and minima from 19 °C (January) to 23 °C (June
through September). Annual rainfall is ca. 2 500 mm, with a relatively
equal distribution throughout a year, but potential evapotranspiration
may exceed precipitation between January and April. The soil char-
acteristics are summarised in Table I.
Gliricidia sepium was planted in May 1993 using stakes cut from
a near-by living fence. Trees were planted over 0.4 ha on a 0.7 × 3m
spacing (4 760 trees·ha
–1
). Native Paspalum notatum Flügge domi-
nated the grass layer (ca. 80% of grass biomass), with planted Digi-
taria decumbens Stent. as the second most common species. The
experiment was managed uniformly by means of partial prunings
every 3–6 months according to the growth of trees, in order to avoid
excessive shading of the grass.
In March 1997, two plants of G. sepium were selected for the archi-
tectural description of the root systems. They were excavated with a
digger, in a sphere of 1.5–2 m of radius, and 0.8–1 m depth, and then
washed in order to separate roots from soil particles. On June 1997,
the root systems of four other trees were carefully removed by hand
in a 16 m
2
delimited trench, after having been over-flooded the day
before. This method allowed measurements of more accurate infor-
mation on in situ root systems, particularly on undisturbed root angles.
Observations were carried out to 0.8 m depth.
After the excavation, link lengths and extreme diameters were
measured for all intact root segments, in relation with their order and
link number, until the seventh order. The consistency between the
measurements of the radial and insertion angles measured before and
after excavation was tested. Due to the lignified structure of the roots,
there were no discrepancies between the two series of measurements.
Calculation of coefficients
α
and q was made on the same data set.
3. RESULTS
3.1. Parameter estimation from field data
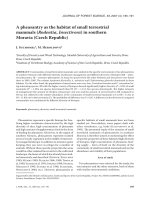
Uniformity of the scaling factor α and allocation factor q
(Eqs. (1) and (2), respectively) within the root systems of
E. lanceolata and G. sepium was tested with respect to link
diameter before bifurcation and link order (Fig. 1). The differ-
ences in the values of
α
and q between link orders 1, 2, 3 and
≥ 4 were tested by analysis of variance for whole data set, and
by orthogonal contrasts for the differences between selected
pairs of link orders. The effect of link diameter on the param-
eters was studied by linear regression.
Table I. Chemical soil characteristics of the study sites.
Site
pH
in water
Cation exchange
capacity
a
(cmol[+]·L
–1
)
Total
nitrogen
b
(g·kg
–1
)
Available
phosphorus
c
(mg·L
–1
)
Soil
order
Quepos, Costa Rica 5.3 29.9 1.5 9.1 Inceptisol
Prise d’Eau, Guadeloupe 6.1 17.5 2.3 85.8 Oxisol
a
Ammonium acetate (pH 7) method;
b
Kjeldahl method;
c
Olsen method.
340 E. Salas et al.
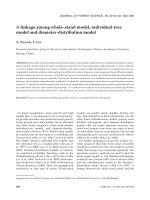
No significant differences were detected in the value of
between the link orders, and the proportion of explained vari-
ance, r
2
, was 0.02 for both species. The regression between link
diameter and
α
was not significant for E. lanceolata ( P =0.087,
r
2
= 0.02), nor for G. sepium (P = 0.921, r
2
= 0.00). In G. sepium,
significant differences in the value of q were detected between
link orders, but the r
2
was low at 0.06. In E. lanceolata, the
value of q did not show any dependence on link order (P =
0.991). The regression between link diameter and q was not sig-
nificant for either species (P = 0.081, r
2
= 0.03 and P =0.181,
r
2
= 0.01 for E. lanceolata and G. sepium, respectively). These
analyses indicated that the variation observed in the values of
α
and q (Fig. 1) is random, and we decided to use the general
average values for the whole root system. The
α
values for
E. lanceolata and G. sepium, 1.15 and 1.14, respectively, cor-
respond to value 1.19 for parameter a in the model of West et al.
[27], when two new links are formed in each bifurcation (n =2
in Eqs. (3–7)).
In E. lanceolata, the average link length varied from 15 cm
in order 6 to 75.7 cm in order 1. In G. sepium, the average link
length varied from 2 cm in order 7 to 39.3 cm in order 1. Eryth-
rina lanceolata had more proximal roots than G. sepium, and
they were thicker in root collar (Tab. II). There was large var-
iation in proximal root length of both species but, on average,
the proximal roots of E. lanceolata were twice as long as those
of G. sepium.
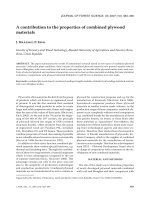
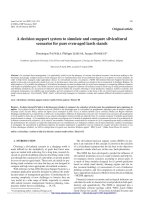
Two models were fitted to the data on observed average link
length. Observed length of proximal roots (order 1) was used
as the starting point for the theoretical volume-filling estimate
(Eq. (7)). The estimated length of order 2 was used for estimating
length of order 3, and the procedure was repeated until order 7
(Fig. 2). An empirical logarithmic regression was also fitted to
the data (Tab. II). The fit of the empirical regression was excel-
lent for G. sepium and satisfactory for E. lanceolata from link
order 1 through 7 (Tab. II and Fig. 2). Because the volume-filling
model used the observed length of order 1 as starting point, its
fit was evaluated for orders 2 through 7, the lengths of which
were real estimates. The proportion of explained variance, r
2
,
of the volume-filling model was 0.43 for G. sepium and 0.57 for
E. lanceolata. The r
2
values of the empirical model for orders 2
through 7 were 0.98 and 0.62 for G. sepium and E. lanceolata,
respectively. Because of the better fit, the empirical model was
used for estimating link length in all simulations reported here.
In 86.4% of all root bifurcation events in E. lanceolata and
90% in G. sepium, only one lateral root bifurcated from the
main axis. In all other events in E. lanceolata, two laterals were
formed, while a few cases with more than two laterals were
observed in G. sepium.
Figure 1. The scaling factor
α
(top) and allocation factor q (bottom) as a function of root diameter and link order in Erythrina lanceolata (left)
and Gliricidia sepium (right). The numbers in the upper right corner of each plot are general mean ± standard deviation. The mean is also dis-
played by the horizontal line in each plot.
α
Fractals for root biomass and architecture 341
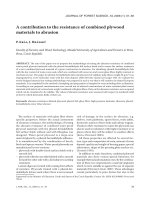
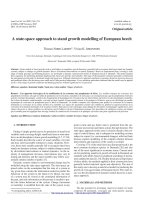
The vertical bifurcation angle distributions differed strongly
between the two legume tree species. In E. lanceolata, laterals
continued the growth in the same soil horizon as the main root
in more than half of the bifurcations. Almost no roots were ori-
ented up from the main link (Fig. 3). In G. sepium, the vertical
angles were quite evenly distributed over the whole range from
negative (down) to positive (up) straight angle. The horizontal
bifurcation angle was ≤ 0.175 rad (10°) in ca. 40% of bifurca-
tion events in both species; the rest were quite evenly distrib-
uted between 0.349 and 1.571 rad (Fig. 3). Neither vertical nor
horizontal bifurcation angle distribution was normal (Shapiro-
Wilk test at 0.1%). Attempts to fit skewed theoretical distributions
like gamma and Weibull distribution to the bifurcation angle
data also failed, and the bifurcation angle was estimated sto-
chastically from the data in Figure 3 using the procedure
described in Section 2.1.
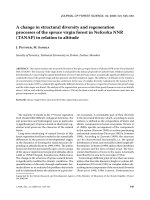
Proximal roots of E. lanceolata were conic (Fig. 4). A strong
regression between the squared root diameter at root collar and
the squared root diameter at first bifurcation was observed,
although there were a few roots shorter than 40 cm without any
conicity. The conicity of the proximal roots of G. sepium was
not significant; hence, it was not included in the simulation
model. The regression between the root volume and root dry
mass was strong (Tab. II) for both tree species.
Linear regression between the squared stem diameter and the
sum of squared proximal root diameters was significant
(P < 0.001) for both species, but the regression coefficient was
much higher for G. sepium than for E. lanceolata (Fig. 5). The
size differences between the two legume tree species were
apparent: the maximum squared stem diameter was five times,
and the sum of squared proximal root diameters was four times
bigger in E. lanceolata than G. sepium (Fig. 5).
Competitiveness index was calculated as the ratio of the sum
of squared diameters of horizontal roots (insertion angle < 45°)
to the sum of squared diameter of all proximal roots. The prox-
imal roots of E. lanceolata were more vertically oriented than
in G. sepium, which was also reflected in competitiveness indi-
ces (Tab. II). Mean ± SD of the index for E. lanceolata was
0.75 ± 0.17 and 0.89 ± 0.13 for G. sepium. By pruning regime,
the mean ± SD of competitiveness index in E. lanceolata was
higher in the intact trees, 0.87 ± 0.03, than under P-3 and T-6
pruning regimes, 0.68 ± 0.09 and 0.69 ± 0.26, respectively.
3.2. Model results
In the simulations, the link diameter was generated according
to the bifurcation rules determined by equations (1) and (2).
Thus, comparison of observed and simulated average link
diameters provides a test of the accuracy of the simulations.
Because the first order or proximal root diameters were based on
field data, the comparison was made from second order roots to
the highest order with enough field data for calculating standard
deviations when the E. lanceolata data was divided by pruning
Table II. Selected root architecture characteristics of Erythrina lanceolata and Gliricidia sepium.
Characteristic E. lanceolata G. sepium
Proximal roots
Mean number per tree ± SD 13.0 ± 2.00 (n = 9) 9.8 ± 3.00 (n =6)
Mean diameter ± SD (cm) 3.4 ± 1.98 (n = 118) 2.3 ± 0.92 (n = 49)
Mean length ± SD (cm) 75.7 ± 38.8 (n = 27) 39.3 ± 15.5 (n =31)
Root dry mass (M
r
in g) M
r
=0.32× V
r
M
r
=0.63× V
r
– root volume (V
r
in cm
3
) relationship r
2
=0.97 r
2
=0.99
Empirical link length (L
i
in cm) L
i
= 74.24–27.47 × ln(i) L
i
= 40.82–20.41 × ln(i)
– root order (i) relationship r
2
=0.85 r
2
=0.99
Mean of competitiveness index ± SD 0.75 ± 0.17 (n = 9) 0.89 ± 0.13 (n = 5)
Figure 2. Comparison of the volume-filling (Eq. (8)) and empirical
(Tab. II) model estimates for average link length with observed
values in Erythrina lanceolata (top) and Gliricidia sepium (bottom).
The error bars indicate the SEM for observed values.
342 E. Salas et al.
regime (Fig. 6). Simulated and observed values were similar.
However, second order links of P-3 and intact E. lanceolata
were overestimated. None of the differences between simulated
and observed values was significant according to the Student’s
t-test at 5%.
The differences in the simulated root biomass, root length
and number of links between pruning regimes of E. lanceolata
were tested by analysis of covariance, in which the pruning
regime was the class variable and the number of proximal roots
was used as covariable, followed by Duncan’s Multiple Range
Test at 5%. Simulated root biomass, total root length and
number of links were significantly higher in the intact trees than
under either pruning regimes (Tab. III). No significant differ-
ences were found without the covariable.
According to the simulations, the root system of E. lanceolata
appears to be quite deep; most simulations produced root systems
about 2.0 m deep, although some deeper individual roots were
produced in the intact trees. Simulation on G. sepium typically
resulted in about 1.0 m deep root systems. The horizontal radius
of the root system of an E. lanceolata tree was typically
between 2.0 and 3.0 m, and of a G. sepium between 1.5 and
2.5 m. The main roots followed quite a superficial pattern in
both species, but lower order links were quite deep.
The estimated radius of the root system of each E. lanceolata
tree reached the root collar area of two other trees (Fig. 7).
Assuming the average radius of 2.18 m (e.g. tree 6 in Fig. 7),
Figure 4. Observed and estimated relationship between the squared
diameter at the point of insertion to root collar, the base ( ), and at
the first bifurcation, the end ( ), in proximal roots of Erythrina
lanceolata.
D
b
2
D
e
2
Figure 3. Relative frequency distribution of vertical (left) and horizontal (right) root bifurcation angles in Erythrina lanceolata and Gliricidia
sepium.
Figure 5. Relationship between the squared stem diameter, , and
the sum of squared proximal root diameters, Σ , in Erythrina lan-
ceolata (top) and Gliricidia sepium (bottom).
D
s
2
D
p
2
Fractals for root biomass and architecture 343
the root system of each tree would have some overlap with the
root systems of 10 other trees under the illustrated P-3, which
had intermediate total root length among the studied pruning
regimes (Tab. III). The estimated radius of the root system of
each G. sepium tree reached the root collar area of five other
trees (Fig. 7). Assuming the average radius of 1.55 m, the root
system of each tree would have some overlap with the root sys-
tems of 15 other trees.
4. DISCUSSION
4.1. Fractal scaling of root system
Values of the scaling parameter
α
(1.15 and 1.14 for
G. sepium and E. lanceolata, respectively) and allocation
parameter q (0.72 and 0.77) were very similar. General root
architecture of the two species was quite similar, best described
as dichotomous with uneven link diameters. This suggests that
this kind of root architecture scales with approximately equal
parameters in different tree species. However, van Noordwijk
and Purnomosidhi [23] found general mean ± SD of 1.33 ±
0.538 for
α
in 29 multipurpose tree individuals that belonged
to 19 species. They did not discuss any trends in relation to general
root architecture. The general mean ± SD of q was 0.86 ± 0.148.
The values of
α
and q did not depend on link order or diameter
in our study nor in [23].
The model of West et al. has been applied for scaling root
biomass [8], but the scaling of vascular system is derived only
for shoots [27]. We found a close relationship between the val-
ues of parameter
α
of van Noordwijk et al. [21, 25] and a of
West et al. [27]. This implies the latter model may be applied
Table III. Simulated mean ± standard deviation of total root system mass, length and number of links in Erythrina lanceolata under three
pruning regimes (C = intact control, P-3 = 50% pruning every three months, T-6 = total pruning every six months). The means within a column
followed by the same letter do not differ significantly if the observed number of proximal roots for each simulated tree is used as covariable
(Duncan’s Multiple Range Test at 5%). The simulations were conducted based on measured proximal root diameters of three trees per pruning
regime.
Pruning regime
Number of Root mass Root length
Number of links
proximal roots [kg] [m]
C 12.7 ± 2.89 12.95 ± 4.42 a 223 ± 59.2 a 828 ± 256 a
P-3 13.3 ± 2.52 7.46 ± 0.48 b 176 ± 36.1 b 587 ± 115 b
T-6 13.3 ± 2.31 6.85 ± 2.99 b 158 ± 50.1 b 517 ± 188 b
Figure 6. Estimated and observed mean root diameter by root order in Gliricidia sepium and under three pruning regimes in Erythrina lanceo-
lata (C = unpruned control, P-3 = about 50% pruning every three months, and T-6 = complete pruning every six months). The error bars indi-
cate standard deviations.
344 E. Salas et al.
to tree roots, but actual measurements of vessel diameter are
required for its full evaluation.
Contrary to the good agreement of the models of van Noord-
wijk et al. [21, 25] and West et al. [27] with data in predicting
the scaling of link diameter, the theoretical volume-filling
model (Eq. (8)) poorly explained the link length in G. sepium.
Although the fit was better in E. lanceolata, in both cases an
empirical logarithmic regression fitted to the actual link length
data gave the best fit (Fig. 2).
4.2. Root bifurcation angle
Attempts to use theoretical distributions for predicting root
bifurcation angle failed. Only the stochastic algorithm based on
observed bifurcation angle distribution worked well. Further,
differences in bifurcation angle distribution, especially vertical
angles, produced the main architectural differences between the
two species studied. While link diameter relationships before and
after a bifurcation can be derived from hydrodynamics [27] and
they appear to be genetically determined by the properties of
the vascular tissue [reviewed in 29], bifurcation angles may
respond to the patchy soil environment where water and nutri-
ents are unequally distributed. Several studies [1, 4, 9, 12, 28]
indicate preferential root growth towards nutrient rich patches
in soil. We may thus hypothesise that root bifurcation angles
are strongly modified by responses to the soil environment and
morphological plasticity of the roots.
4.3. Root competitiveness index
The root competitiveness index calculated as the relation-
ship between the sum of squared diameters of horizontal prox-
imal roots and squared stem diameter [24], or between the
squared diameters of horizontal and all proximal roots is based
on the assumption that the roots continue to grow in the same
direction as observed close to the root collar. The assumption
seemed to hold for E. lanceolata, lateral roots of which contin-
ued growth in the same soil horizon as the main root. In
G. sepium, lateral roots tended to grow up or downwards from
the main roots (Fig. 3). The usefulness of a competitiveness
index based on proximal roots seems to depend on the general
architecture of the tree root system. Considering the potential
plasticity of the root system architecture in response to the soil
environment, the evaluation of the usefulness of the index
requires more field research.
The squared stem diameter was strongly correlated with the
sum of squared proximal root diameters in G. sepium, but the
regression was weak in E. lanceolata (Fig. 5). This may have
been caused by formation of heartwood in older and bigger
E. lanceolata trees. After the formation of heartwood begins,
the simple pipe model relationship holds only if applied to sap-
wood relationships [29]. Thus, it was also justified to replace the
squared stem diameter by the sum of squared diameters of all
proximal roots in the calculation of the competitiveness index.
Van Noordwijk and Purnomosidhi [23] calculated the ratio
of the sum of squared vertical root diameters to sum of squared
diameters of all proximal roots of 19 multipurpose tree species
in Southeast Asia. This index can be converted to the compet-
itiveness index used in this study (Tab. II) by subtracting it from
one. Only six species out of 19 had an index below 0.5, i.e.
majority of their roots were vertical. Erythrina lanceolata would
rank between the tenth and 11th most shallow root system in
[23], or close to the average. Gliricidia sepium studied in Indo-
nesia ranked the ninth most shallow, while G. sepium in Guade-
loupe (this study) would rank between third and fourth in [23].
4.4. Considerations for agroforestry practices
Roots of both G. sepium and E. lanceolata overlapped between
individual trees in the studied spatial arrangements (Fig. 7),
suggesting intra-row competition between the trees. Root sys-
tem overlap was more important in the bigger E. lanceolata.
The root systems of E. lanceolata grown in 2 × 3 m spacing
were relatively circular (Fig. 7), while the denser G. sepium
rows (0.7 × 3 m) reduced root extension within row and
increased occupation of the inter-row spaces (Fig. 7). Roots of
both species occupied completely the inter-row, or crop, space.
This may have both positive and negative consequences for
crop production in agroforestry systems. Presence of G. sepium
roots appears to enrich soil with N [6], but trees may compete
for other nutrients and water with the crop. Dinitrogen fixation
in E. lanceolata seems to be sensitive to shoot pruning [17], and
competition even for soil N may occur following the pruning [14].
Figure 7. Schematic presentation on the horizontal extension of the
root systems of three Erythrina lanceolata trees under the P-3 pru-
ning regime (50% pruning every three months; top), and three Gliri-
cidia sepium trees (bottom). For E. lanceolata, the simulated root
architecture of tree 8 is shown, and the ellipses refer to the simulated
root extension in trees 6 and 10, the small dots refer to other trees and
the rectangle is the 12-tree sample plot. For G. sepium, the simulated
root architecture of a tree is shown, and the ellipses refer to the simu-
lated root extension in two other trees and the small dots refer to
other trees.
Fractals for root biomass and architecture 345
Both partial and complete pruning appeared to restrict root
growth in E. lanceolata (Tab. III). This probably reflects the
whole life history of E. lanceolata in the study site; intact trees
had been growing without pruning since establishment of the
plantation, while both pruned treatments were also pruned ear-
lier. The 18-month-period of current pruning practices was not
long enough to produce significant differences in coarse root
biomass or length between the partial and complete pruning
treatments. Both foliage production and fine root biomass were
significantly lower under complete than partial pruning man-
agement [2]. The latter are sensitive indicators on short-term
stress, and it appears that the coarse root biomass and general
root architecture respond conservatively to tree management.
4.5. Concluding remarks
Root systems of both G. sepium and E. lanceolata appeared
to be fractal. Both the scaling parameter
α
and allocation
parameter q had about the same value in both species. The the-
oretical model based on volume-filling fractals [27] failed to
fit to the data on link length, and an empirical regression
describing the link length as a function of link order best fitted
to the data. Root bifurcation angles seemed to respond flexibly
to soil environment and attempts to fit any theoretical distribu-
tion or regression for estimating them failed. It is possible that
proper modelling of link length and bifurcation angle requires
consideration of root functions and their response to local soil
environment. Lateral roots of E. lanceolata continued their
growth in the same soil layer as the main root, but laterals of
G. sepium often grew towards different soil horizons. The latter
observation casts some doubt on the validity of the root com-
petitiveness index that is based on the vertical orientation of
proximal roots. Root systems of both species also occupied the
crop growing space in the studied agroforestry practices. Prun-
ing management appeared to check coarse root growth over
medium-term, but no short-term effects of pruning on coarse
root biomass and architecture were detected. The simple fractal
root model of van Noordwijk et al. [21, 25, see also 16] applied
in this study appears to be practical for root studies in agrofor-
estry. The application of the general fractal allocation model
of West et al. [7, 8, 26, 27] to root systems also seems to be
worth of further research.
Acknowledgements: We thank Ing. Agr. José Mattey Fonseca, director
of the MAG experimental station in Quepos, Prof. Carlos Ramírez and
Dr Frank Berninger for good cooperation during the field work, and
Mr Asdruval Chacón for field assistance. The study was financed by
the Academy of Finland (Research Grant 28203).
REFERENCES
[1] Arredondo J.T., Johnson D.A., Root architecture and biomass allo-
cation of three range grasses in response to nonuniform supply of
nutrients and shoot defoliation, New Phytol. 143 (1999) 373–385.
[2] Berninger F., Salas E., Effects of pruning intensity on biomass
dynamics in Erythrina lanceolata, Agrofor. Syst. 57 (2003) 19–28.
[3] Böhm W., Methods of studying root systems, Springer-Verlag,
Berlin, Germany, 1979, 188 p.
[4] Crick J.C., Grime J.P., Morphological plasticity and mineral nutri-
ent capture in two herbaceous species of contrasted ecology, New
Phytol. 107 (1987) 453–460.
[5] De Reffye P., Houllier F., Blaise F., Barthélémy D., Dauzat J.,
Auclair D., A model simulating above- and below-ground tree
architecture with agroforestry applications, Agrofor. Syst. 30 (1995)
175–197.
[6] Dulormne M., Sierra J., Nygren P., Cruz P., Nitrogen-fixation
dynamics in a cut-and-carry silvopastoral system in the subhumid
conditions of Guadeloupe, French Antilles, Agrofor. Syst. 59
(2003) 121–129.
[7] Enquist B.J., Cope’s Rule and the evolution of long-distance trans-
port in vascular plants: allometric scaling, biomass partitioning and
optimization, Plant Cell Environ. 26 (2003) 151–161.
[8] Enquist B.J., Niklas K.J., Global allocation rules for patterns of
biomass partitioning in seed plants, Science 295 (2002) 1517–1520.
[9] Gersani M., Sachs T., Development correlations between roots in
heterogeneous environments, Plant Cell Environ. 15 (1992) 463–469.
[10] Jourdan C., Rey H., Guédon Y., Architectural analysis and model-
ling of the branching process of the young oil-palm root system,
Plant Soil 177 (1995) 63–72.
[11] Lehmann J., Zech W., Fine root turnover of irrigated hedgerow
intercropping in Northern Kenya, Plant Soil 198 (1998) 19–31.
[12] Lynch J., Root architecture and plant productivity, Plant Physiol.
109 (1995) 7–13.
[13] Mandelbrot B.B., The fractal geometry of nature, Freeman, New
York, USA, 1983, 468 p.
[14] Nygren P., Above-ground nitrogen dynamics following the com-
plete pruning of a nodulated woody legume in humid tropical field
conditions, Plant Cell Environ. 18 (1995) 977–988.
[15] Ong C.K., Corlett J.E., Singh R.P., Black C.R., Above- and below-
ground interactions in agroforestry systems, For. Ecol. Manage. 45
(1991) 45–57.
[16] Ozier-Lafontaine H., Lecompte F., Sillon J F., Fractal analysis of
the root architecture of Gliricidia sepium for the spatial prediction
of root branching, size and mass. Model development and evalua-
tion in agroforestry, Plant Soil 209 (1999) 167–180.
[17] Salas E., Nygren P., Domenach A.M., Berninger F., Ramírez C.,
Estimating biological N
2
fixation by a tropical legume tree using
the non-nodulating phenophase as the reference in the
15
N natural
abundance method, Soil Biol. Biochem. 33 (2001) 1859–1868.
[18] Schroth G., Zech W., Above- and below-ground biomass dynamics
in a sole cropping and an alley cropping system with Gliricidia
sepium in the semi-deciduous rainforest zone of West Africa, Agro-
for. Syst. 31 (1995) 181–198.
[19] Shinozaki K., Yoda K., Hozumi K., Kira T., A quantitative analysis
of plant form - the pipe model theory. I. Basic analyses, Jap. J. Ecol.
14 (1964) 97–105.
[20] Sievänen R., Nikinmaa E., Nygren P., Ozier-Lafontaine H., Pert-
tunen J., Hakula H., Components of functional-structural tree models,
Ann. For. Sci. 57 (2000) 399–412.
[21] Spek L.Y., van Noordwijk M., Proximal root diameters as predic-
tors of total root system size for fractal branching models. II.
Numerical model, Plant Soil 164 (1994) 119–127.
[22] S-Plus User’s Manual, Statistical Sciences, Inc., Seattle, WA, USA,
1991.
[23] Van Noordwijk M., Purnomosidhi P., Root architecture in relation
to tree-crop-soil interactions and shoot pruning in agroforestry,
Agrofor. Syst. 30 (1995) 161–173.
[24] Van Noordwijk M., Lawson G., Soumaré A., Groot J.J.R., Hairiah
K., Root distribution of trees and crops: Competition and/or com-
plementarity, in: Ong C.K., Huxley P. (Eds.), Tree-crop interac-
tions: a physiological approach, CAB International, Wallingford,
UK, 1996, pp. 319–364.
[25] Van Noordwijk M., Spek L.Y., De Willingen P., Proximal root
diameters as predictors of total root system size for fractal branch-
ing models. I. Theory, Plant Soil 164 (1994) 107–118.
[26] West G.B., Brown J.H., Enquist B.J., A general model for the origin
of allometric scaling laws in biology, Science 276 (1997) 122–126.
[27] West G.B., Brown J.H., Enquist B.J., A general model for the struc-
ture and allometry of plant vascular systems, Nature 400 (1999)
664–667.
[28] Zhang H., Forde B.G., An Arabidopsis MADS box gene that con-
trols nutrient-induced changes in root architecture, Science 279
(1998) 407–409.
[29] Zimmermann M.H., Xylem structure and the ascent of sap,
Springer-Verlag, Berlin, Germany, 1983, 143 p.